1
Aggregate Production Planning of Hybrid Corn Seed
Using Heuristic Methods at PT CNM
Syamsul Anwar
1Akademi Teknologi Industri Padang,
*[email protected]
Gus Ari Wardi
2Akademi Teknologi Industri Padang,
[email protected]
ABSTRACT
PT CNM is a company producing hybrid corn seeds that located at Solok, West Sumatera. Fluctuating product demand, while the resources or factory’s capacity were limited resulted in the company management face difficulties in making plans or production strategies that could meet customer demand. The purpose of this research is to make hybrid corn seed aggregat production planning with minimum total cost criteria. The approach used is to apply the aggregate production planning with heuristic methods. The first stage is to forecast demand for the 12 next months by using various of time series methods. The smallest value of the mean square error (SME) is used to selected the best forecast method. Finally the decomposition method is chosen to projected product demand. The second stage is to apply heuristic methods through pure strategies ; labour size control, inventory control, overtime, and a mixed strategy; overtime-subcontract. The comparison of total cost of these four strategies indicated that labour size control is the strategy with the minimum total cost. The application of these production strategies are given in more detail.The results of this study could help manager of company in making production planning.
Keywords: production planning, aggregate, heuristic methods.
INTRODUCTION
PT CNM is a company that producing hybrid corn seed. The factory is located at Solok town, West Sumatra Province, Indonesia. Marketing of product covers Sumatera, Java, Sulawesi and West Nusa Tenggara. Corn feedstocks are derived from corn plants around the factoryt in coorporated with farmer groups. The products of PT CNM are seed of corn to be used as animal feed, namely N-35 (size 1 kg) and N-37 (size 5 kg). Fluctuating product demand conditions, while the company has limited resources and production capacity makes the management have difficulty in making production planning to meet customer demand. So far the company in making production policy only rely on past sales records and intuition which is not measurable effectiveness and and efficiency.
2 2003) Aggregate planning is made to adjust production capacity in the face of uncertain market demand to optimize the use of resource (labour and production equipments) so that the total production cost can be reduced to minimum level. (Nasution, 2008). There are several strategies that can be implemented such as inventory planning, production level control, labour control, capacity control and others. If changes are made to a variable so that a change in the rate of production is called a pure strategy, such as inventory control, labour control, overtime, and sub-contract. Meanwhile a mixed strategy is use two or more pure strategies that production planning be more flexible. (Ginting, 2007)
In implementing this production strategy, there are some costs that arise as could be contributed to total production cost. Hiring cost is cost that arise from recruiting workers due to high product demand which it includes costs for advertising, recruitment process, and training workers. Whereas firing cost is costs that arise from laying off workers due to low product demand so that production rate will decrease drastically. Overtime cost is costs that arise from using work time out of normal work time to increase the production output. Overtime cost normally is higher than regular time cost. Inventory cost is cost that arise from holding inventory which to anticipate an increase in product demand at certain times. It is incuding capital costs, insurance, material damage cost, and warehouse rental fee. Lost sale cost are costs that arise from shortage of supplies so that product demand can not fulfilled. It is including costs of losing potensial revenues and losing consumer’s trust. Sub-contract cost is cost due to transferring orders to other companies, it could happen due to limited capacity of the factory. Sub-contract cost is usually higher than regular production cost and overtime cost. (Sukendar, 2008). The purpose of the research is to make an aggregate production planning of hybrid corn seeds at PT CNM which gives minimum total cost. Several previous studies that applied aggregate production planning, among others ; Chinguwa et al. (2013), Amri and Efrida (2010) used trial error (heuristic) methods and linear programming models, Kissani and El Mokrini (2012), Neureuther (2004), used linear programming, Purnomo (2010) made inventory planning and aggregate production planning used integer programming model. Wardani (2010) used linear transportation method. Octavianti et al. (2013) and Sukendar (2008) used heuristic methods. Based on previous researchs, heuristic methods and liniear programming models are the most widely method that used in solving problems of production planning in a firm. This study uses a heuristic method with a case study on an agricultural industry using heuristic methods by applying four types of production strategies; labour size control, inventory control, overtime, and overtime-subcontract.
RESEARCH METHOD
3 and others data related. Stage analysis is divided into two. Stage I is forecasting demand for year 2014 using time series methods with POM-QM software version 3. Stage II is applying aggregate planning strategies with heuristic methods (trial error) which is include four strategies ; labour size control, inventory control, overtime l, and overtime sub-contract.
RESULTS AND DISCUSSION
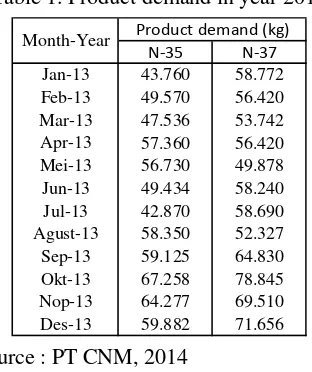
The first stage is to forecast product demand for year 2014. The process of forecasting performed with quantitative approach. From data that obtained by the PT CNM in year 2013, demand for product N-35 and N-37 as where they can be seen in Table 1 below.
Table 1. Product demand in year 2013
N-35 N-37 Jan-13 43.760 58.772 Feb-13 49.570 56.420 Mar-13 47.536 53.742 Apr-13 57.360 56.420 Mei-13 56.730 49.878 Jun-13 49.434 58.240 Jul-13 42.870 58.690 Agust-13 58.350 52.327 Sep-13 59.125 64.830 Okt-13 67.258 78.845 Nop-13 64.277 69.510 Des-13 59.882 71.656 Month-Year Product demand (kg)
Source : PT CNM, 2014
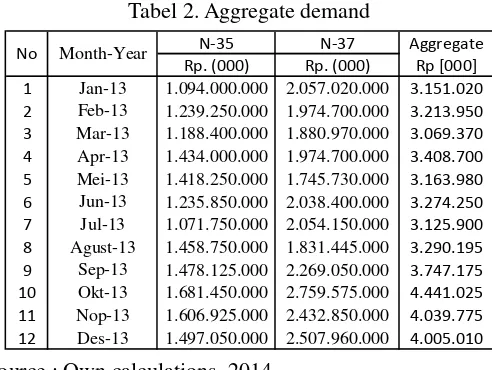
4 Tabel 2. Aggregate demand
N-35 N-37 Aggregate Rp. (000) Rp. (000) Rp [000] 1 Jan-13 1.094.000.000 2.057.020.000 3.151.020 2 Feb-13 1.239.250.000 1.974.700.000 3.213.950 3 Mar-13 1.188.400.000 1.880.970.000 3.069.370 4 Apr-13 1.434.000.000 1.974.700.000 3.408.700 5 Mei-13 1.418.250.000 1.745.730.000 3.163.980 6 Jun-13 1.235.850.000 2.038.400.000 3.274.250 7 Jul-13 1.071.750.000 2.054.150.000 3.125.900 8 Agust-13 1.458.750.000 1.831.445.000 3.290.195 9 Sep-13 1.478.125.000 2.269.050.000 3.747.175 10 Okt-13 1.681.450.000 2.759.575.000 4.441.025 11 Nop-13 1.606.925.000 2.432.850.000 4.039.775 12 Des-13 1.497.050.000 2.507.960.000 4.005.010 No Month-Year
Source : Own calculations, 2014
The pattern of product demand in year 2013 can be seen in Figure 1 below.
Figure 1. Product demand data year 2013
It can be seen that there are fluctuation in the data pattern and a trend upward. Then forecast demand was performed by five methods of times series ; moving average-3, weighted moving average-3,
exponential smoothing (alpha 0,8), linear regression, and decomposition. Indices performance for each forecasting method can be seen from the value of the Mean Square Error (MSE) as can be seen at Table 3 below.
Table 3. Recapitulation error forecasting results.
No. Forecasting method MSE
1 Moving average-3 171.115.100 2 Weighted moving average-3 160.539.700 3 Exponential smoothing 101.888.800 4 Linear Regression 69.389.740
5 Decomposition 66.353.740
Source : Own calculations, 2014
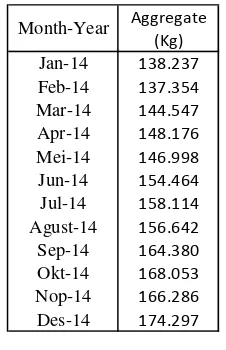
5 Tabel 4. Forecast product demand year 2014
Aggregate
The data was required in the aggregate production planning is the parameters of production on year 2013. Because of product demand in 2013 could be fullfilled so that product demand is assumed to be equal to the production capacity of the company. The parameters of production can be seen in Table 5 below.
Table 5. Parameters of production year 2013 Parameters of production year 2013 Quantity (kg) 1. Number of production in 1 year 1.385.482 2. Average production level per month 115.457 3. Average output level per worker per month 962,1 (number of workers = 120 persons) workers, otherwise if product demand down then firing workers. Parameters such as labour cost are needed in the implementation of this strategy. The data can be seen in Table 6 below.
6 Parameters of work force cost Cost (Rp)
1. Wage of worker per month 1.300.000 2. Hiring cost per month is estimated 1.300.000 100% x reguler wage per worker
3. Hiring cost per day 50.000 4. Hiring cost per hour 6.250 (1 shift = 8 hours)
5. Hiring cost per kg 2.702 (hiring cost per hour / 2,3 kg)
6. Firing cost per kg is estimated same with 2.702 hiring cost
Source : PT CNM and own calculations, 2014
In January 2014, the number of labour can be calculated by dividing demand to output product per worker ; 138 237 kg / 962.1 kg = 144 workers. Hiring needs in unit kg can be calculated from demand rate of January that reduced to demand rate of previous month ; 138.237 kg - 131.538 kg = 6.699 kg. While hiring needs in unit number of labour can be calculated from number of labour in January that reduced to number of labour on the previous month ; (144 – 120) workers= 24 workers. Hiring need cost in January can be calculated from hiring need in unit kg multipiled with hiring need cost per worker ; 6.699 kg x Rp 2702/ kg = Rp. 18.105.934. Labour costs can be calculated by 144 workers x Rp. 1.300.000 (wage) = Rp. 186.779.785. The total cost is sum of hiring need cost and labour cost ; Rp. 18.105.934 + Rp. 186.779.785 = Rp. 204.885.720. During the period of year 2014, there will be 8 months will need hiring of workers, while in the remaining 4 months will need firing workers. If a month need hiring workers then it means that firing workers will not occur. The total cost of this strategy is Rp 2.654.047.435. Detailed calculation can see appendix 1.
Inventory Control Strategy
For applying of this strategy, the production rate was set at the average demand level of year 2014 ; 154.796 kg / month. If amount of production in a month excesses product demand then it will be stored as inventory. To find out when inventory is used clearly by looking at product demand pattern relatively to production level as can be seen in Figure 2 below.
Figure 2. Product demand and production level
7 cover shortage of regular production. This will happen if the plant does not have initial inventory. Inventory cost is estimated at 5% of selling price of the products ; 5%x Rp. 30.000 (average price of 2 types of products) = Rp. 1.500/ kg. Inventory level in January 2014 can be calculated from regular capacity reduced to product demand ; 154.796 kg – 138.237 kg = 16.559 kg. If it is multiplied by Rp. 1,500 / kg that will be obtained inventory cost Rp. 24.837.826. Increasing of production level in January 2014 will lead to hiring cost that can be calculated from regular capacity reduced to average production
level in 2013 and multiplied by hiring cost per kg ; (154.796 kg - 115 457 kg) x Rp. 2702,7 / kg = Rp 106.321.386. The amount of workers during period 2014 is same due to production levels are fixed
at each month. It can be calculated from the amount of regular capacity was divided by average output per worker ; 154.796 kg / 962.1 kg = 161 workers. The labour cost can be calculated from amount of workers was multplied by wage; 152 workers x Rp. 1,300,000 = Rp. 197.600.000. Total cost is sum of inventory cost, hiring cost, and labour cost ; Rp. 11,017,761 + Rp 81.420.458 + Rp. 197.600.000 = Rp. 290.038.219.
Inventory level of February can be calculated from (inventory level of previous month + production level in February – product demand) ; 16.559 kg + 154.796 kg – 137.354 kg = 34.000 kg. Inventory cost is 34.000 kg x Rp. 1,500 / kg = Rp. 28.825.023. There will be no hiring costs due to the amount of workers are constant during year 2014 period. The next cost calculations are same as previously described. The total cost of this strategy is Rp 3.317.660.855. Detailed calculation can see appendix 2.
Overtime Strategy
8
Overtime and Sub-contract Strategy
If product demand can not be fulfilled by regular and overtime capacity, the company will perform the transfer orders to other companies (sub-contract). Sub-contract cost is estimated 125% times overtime cost ; 125 % x Rp. 1800.000 = Rp. 2,250,000 / hour. The advantage of this strategy is lost sale can be overcome by sub-contract. Same as overtime strategy, sub-contract will performed in April at 2.237 kg or 7 hours. The sub-contract cost can be calculated as 7 hours x Rp. 2,250,000 (sub-contract cost) = Rp. 15.243.762. Total cost is sum of overtime cost, lost sale cost and labour cost. The total cost of this strategy is Rp 3.181.958.545. Detailed calculation can see appendix 4.
Comparison of Strategies
Application of each strategy produces different characteristics. For more details, can see the production parameters of each strategy by looking at table 7 below.
Tabel 8. Production Parameters of four production strategies
1 2 3 4
Type of labor size flexible constant constant constant Labour size (person) 143 - 181 161 120 120 Type of production flexible constant constant constant Total regular production cap.(kg) 1.857.549 1.857.549 1.648.250 1.648.250 Total inventory (kg) 0 467.599 0 0 Total overtime cap. used (kg) 0 0 85.337 85.337 Lost sale (kg) 0 0 123.961 0 Sub-contract (kg) 0 0 0 123.961
Strategy Production Parameters
Source : own calculations, 2014
There are some similarities and differences in the types of costs arising from each strategy as can be seen at Table 8 below.
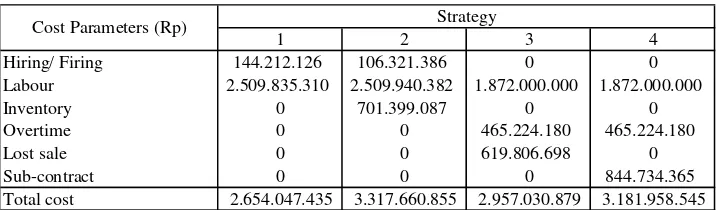
Tabel 8. Cost Parameters of four production strategies
1 2 3 4
Hiring/ Firing 144.212.126 106.321.386 0 0 Labour 2.509.835.310 2.509.940.382 1.872.000.000 1.872.000.000
Inventory 0 701.399.087 0 0
Overtime 0 0 465.224.180 465.224.180
Lost sale 0 0 619.806.698 0
Sub-contract 0 0 0 844.734.365
Total cost 2.654.047.435 3.317.660.855 2.957.030.879 3.181.958.545 Strategy
Cost Parameters (Rp)
9 Source : own calculations, 2014
From Table 8 above, labour cost is significant factor that contribute to total cost for all strategies. Hiring/firing cost are arise on strategy-1 and strategy-2. Inventory cost is only arise on strategy-2. Ovetime cost is arise on strategy-3 and strategy-4. Lost sale cost is only arise on strategy-3. Sub-contract cost is only arise on strategy-4. Overall, strategy-1 (labor size control) has smallest total cost at Rp. 2.654.047.435 so that this strategy is recommended to implemented for PT CNM.
CONCLUSION
This study has applied four type aggregate production strategies to the problems of PT CNM. Strategies are clustered in heuristic methods ; labour control strategy, inventory control strategy, overtime strategy, overtime and sub-contract strategy. These strategies each produce different total cost. Labour control strategy is the best strategy that generates the minimum total cost at Rp. 2.654.047.435. This research can be developed by analyzing how changes of total cost strategies due to changing in cost parameters (sensitivity analysis). This study uses only total production cost as a performance criteria of each strategy. Further research can focus to various aspects in selecting production strategy based on their advantages and disadvantages such as ease of implementation and quality risk.
APPENDIX
Appendix 1. Labor size control strategyDemand Labour Total cost
(Kg) (kg) (worker) cost (Rp) (kg) (worker) cost (Rp) cost (Rp) (Rp)
Jan-14 138.237 144 6.699 24 18.105.934 0 0 0 186.779.785 204.885.720
Feb-14 137.354 143 0 0 0 883 1 2.386.472 185.586.723 187.973.195
Mar-14 144.547 150 7.192 7 19.439.102 0 0 0 195.304.857 214.743.959
Apr-14 148.176 154 3.629 4 9.808.460 0 0 0 200.208.372 210.016.832
Mei-14 146.998 153 0 0 0 1.178 1 3.182.766 198.617.221 201.799.987
Jun-14 154.464 161 7.465 8 20.176.630 0 0 0 208.704.065 228.880.695
Jul-14 158.114 164 3.651 3 9.867.137 0 0 0 213.636.914 223.504.051
Agust-14 156.642 163 0 0 0 1.472 1 3.978.882 211.647.764 215.626.645
Sep-14 164.380 171 7.738 8 20.914.158 0 0 0 222.103.318 243.017.476
Okt-14 168.053 175 3.673 4 9.925.725 0 0 0 227.065.457 236.991.181
Nop-14 166.286 173 0 0 0 1.767 2 4.775.087 224.678.262 229.453.348
Des-14 174.297 181 8.011 8 21.651.775 0 0 0 235.502.571 257.154.345
1.857.549 129.888.920 14.323.206 2.509.835.310 2.654.047.435
Month-year Worker Hiring need Firing need
10
Demand Regular cap. Shortage of Hiring Labour Total (kg) (kg) Regular cap. (kg) (kg) cost (Rp) cost (Rp) cost (Rp) cost (Rp) Jan-14 138.237 154.796 16.559 24.837.826 161 106.321.386 209.161.699 340.320.911 Feb-14 137.354 154.796 34.000 51.000.143 161 0 209.161.699 260.161.842 Mar-14 144.547 154.796 44.249 66.373.759 161 0 209.161.699 275.535.458 Apr-14 148.176 154.796 50.869 76.303.680 161 0 209.161.699 285.465.379 Mei-14 146.998 154.796 58.667 88.000.036 161 0 209.161.699 297.161.734 Jun-14 154.464 154.796 58.999 88.498.362 161 0 209.161.699 297.660.061 Jul-14 158.114 154.796 3.319 55.680 83.520.428 161 0 209.161.699 292.682.126 Agust-14 156.642 154.796 1.846 53.834 80.750.772 161 0 209.161.699 289.912.471 Sep-14 164.380 154.796 9.585 44.249 66.373.759 161 0 209.161.699 275.535.458 Okt-14 168.053 154.796 13.257 30.992 46.487.969 161 0 209.161.699 255.649.668 Nop-14 166.286 154.796 11.490 19.502 29.252.352 161 0 209.161.699 238.414.051 Des-14 174.297 154.796 19.502 (0) (0) 161 0 209.161.699 209.161.699 1.857.549 467.599 701.399.087 106.321.386 2.509.940.382 3.317.660.855 Month-year Inventory Worker
Source : Own calculations, 2014
Appendix 3. Overtime control strategy
Demand Regular cap. Lost sale OT cost Total
(kg) (kg) (kg) (hour) (hour) (kg) (kg) (hour) cost (Rp) (Rp) (worker) Cost (Rp) cost (Rp)
Jan-14 138.237 137.354 883 3 26 8.585 4.813.732 120 156.000.000 160.813.732
Feb-14 137.354 137.354 0 0 26 8.585 0 120 156.000.000 156.000.000
Mar-14 144.547 137.354 7.192 22 26 8.585 39.210.448 120 156.000.000 195.210.448
Apr-14 148.176 137.354 10.822 33 26 8.585 2.237 7 11.184.801 46.800.000 120 156.000.000 213.984.801
Mei-14 146.998 137.354 9.644 29 26 8.585 1.059 3 5.296.684 46.800.000 120 156.000.000 208.096.684
Jun-14 154.464 137.354 17.109 52 26 8.585 8.525 26 42.623.449 46.800.000 120 156.000.000 245.423.449 Jul-14 158.114 137.354 20.760 63 26 8.585 12.176 37 60.877.653 46.800.000 120 156.000.000 263.677.653 Agust-14 156.642 137.354 19.288 58 26 8.585 10.703 32 53.516.722 46.800.000 120 156.000.000 256.316.722 Sep-14 164.380 137.354 27.026 82 26 8.585 18.442 56 92.207.913 46.800.000 120 156.000.000 295.007.913 Okt-14 168.053 137.354 30.699 93 26 8.585 22.114 67 110.570.504 46.800.000 120 156.000.000 313.370.504 Nop-14 166.286 137.354 28.932 88 26 8.585 20.347 62 101.736.594 46.800.000 120 156.000.000 304.536.594 Des-14 174.297 137.354 36.943 112 26 8.585 28.358 86 141.792.377 46.800.000 120 156.000.000 344.592.377
1.648.250 85.337 123.961 619.806.698 465.224.180 1.440 1.872.000.000 2.957.030.879
Month-year Shortage of Reg. Cap. Max. OT cap. Shortage of OT Cap. Labour
Source : Own calculations, 2014
Appendix 4. Overtime and sub-contract strategy
Demand Regular cap. Sub-contract OT cost Total
(kg) (kg) (kg) (hour) (hour) (kg) (kg) (hour) cost (Rp) (Rp) (worker) Cost (Rp) cost (Rp)
Jan-14 138.237 137.354 883 3 26 8.585 4.813.732 120 156.000.000 160.813.732
Feb-14 137.354 137.354 0 0 26 8.585 0 120 156.000.000 156.000.000
Mar-14 144.547 137.354 7.192 22 26 8.585 39.210.448 120 156.000.000 195.210.448
Apr-14 148.176 137.354 10.822 33 26 8.585 2.237 7 15.243.762 46.800.000 120 156.000.000 218.043.762 Mei-14 146.998 137.354 9.644 29 26 8.585 1.059 3 7.218.849 46.800.000 120 156.000.000 210.018.849 Jun-14 154.464 137.354 17.109 52 26 8.585 8.525 26 58.091.487 46.800.000 120 156.000.000 260.891.487 Jul-14 158.114 137.354 20.760 63 26 8.585 12.176 37 82.970.135 46.800.000 120 156.000.000 285.770.135 Agust-14 156.642 137.354 19.288 58 26 8.585 10.703 32 72.937.924 46.800.000 120 156.000.000 275.737.924 Sep-14 164.380 137.354 27.026 82 26 8.585 18.442 56 125.670.138 46.800.000 120 156.000.000 328.470.138 Okt-14 168.053 137.354 30.699 93 26 8.585 22.114 67 150.696.507 46.800.000 120 156.000.000 353.496.507 Nop-14 166.286 137.354 28.932 88 26 8.585 20.347 62 138.656.774 46.800.000 120 156.000.000 341.456.774 Des-14 174.297 137.354 36.943 112 26 8.585 28.358 86 193.248.789 46.800.000 120 156.000.000 396.048.789
1.648.250 85.337 123.961 844.734.365 465.224.180 1.872.000.000 3.181.958.545
Month-year Shortage of Reg. Cap. Max. OT cap. Shortage of OT Cap. Labour
Source : Own calculations, 2014
ACKNOWLEDGEMENTS
The authors would like to thank for suggestions from anonymous reviewers in improvement
of this research. Thanks to PT CNM’s management who have supported the data for this
research.
REFERENCES
Amri, T. H. and Efrida N., Perencanaan Pengendalian Produksi Air Minum Dalam Kemasan Menggunakan Metode Agregat Planning, Malikussaleh Industrial Engineering Vol.1 No.1, pp : 11-18, 2012
11 Ginting, R., Sistem Produksi, Graha Ilmu, Jakarta, 2007.
Kissani, I. And El Mokini, A., Aggregate Planning : Opportunities and Challenges between Developed and Developing Countries. Proceedings of the 2012 International Conference on Industrial Engineering and Operations Management, Istanbul, Turkey , pp : 1848 – 1855, 2012 Kumar, S. A., and Suresh, N., Production and Operation Management, New Age International
Publishers, New Delhi, 2008
Nasution, A.H., “Manajemen Industri”, Penerbit Andi, Yogyakarta , 2006.
Neureuther, B.D. , Aggregate Planning in Make-to-Order Environments, Proceedings of the Second
World Conference on POM and 15th Annual POM Conference, Cancun, Mexico , pp : 1 –
15, 2004
Octavianti, I. A., Setyanto, N. W., Tantrika, Ceria F. M., Perencanaan Produksi Agregat Produk Tembakau Rajang P01 dan P02 di PT X, available at http ://jrmsi.studentjournal.ub.ac.id/index.php/jrmsi/article/download/33/56, diakses pada 5 Agustus 2014
Purnomo, A. Perencanaan Produksi dan Pengendalian Persediaan Bahan Baku pada Pengrajin Tahu dan Tempe ”IM” Cibogo Bandung, Jurnal Logistik Bisnis Politeknik, Vol.1, No.1, pp : 97 – 117, 2010
Sukendar, I, Metode Perencanaan Aggregate Plannig Heuristik sebagai Perencanaan dan Pengendalian Produksi Untuk Minimasi Biaya, Prosiding Seminar Nasional Teknoin, Universitas Islam Sultan Agung, Semarang , pp : C107 – C-112, 2008
Wardhani, A. R., Perencanaan Agregat dengan Metode Transportasi pada PT X Pasuruan, Widya Teknika, Vol.18, No.1, pp : 6 – 10, 2010