Yuli Panca Asmara, Tedi Kurniawan.Corrosion Prediction for Corrosion Rate of Carbon.. | 64
Corrosion Prediction for Corrosion Rate of Carbon Steel
in Oil and Gas Environment: A Review
Yuli Panca Asmara*, Tedi Kurniawan
Faculty of Mechanical Engineering, Universiti Malaysia Pahang, 26600 Pekan, Pahang, Malaysia
*Correspondence: E-mail: [email protected]; Phone: +6094246239;Fax: +609424622
A B S T R A C T S A R T I C L E I N F O
Corrosion predictions are essential for corrosion and material engineers. It is used to prepare pre-Front End Engineering De-sign (pre-FEED). FEED guides to select appropriate materials, planning test schedule, work over management, and estimate future repair for cost analyses. Corrosion predictions also calcu-late life of pipeline and equipment systems during operational stages. As oil and gas environments are corrosive for carbon steel, it is important to account the corrosion rate of carbon steels in those environmental conditions. There are many exist-ing corrosion predictions software, which are available in oil and gas industries. However, corrosion predictions only can be used for particular ranges of environmental conditions because they use different input parameters. To select the most applicable of corrosion predictions software, engineers have to understand theoretical background and fundamental concept of the soft-ware. This paper reviews the applications of existing corrosion prediction software in calculating corrosion rate of carbon steel in oil and gas environmental systems. The concept philosophy of software is discussed. Parameters used and range of conditions are also studied. From the results of studies, there are limita-tions and beneficial impacts in using corrosion software. Engi-neers should understand the fundamental theories of the corro-sion mechanism. Knowing limitations of the models, the appro-priate model can be correctly selected and interpretation of cor-rosion rate will close to the real data conditions.
© 2018 Tim Pengembang Jurnal UPI
Article History:
Received 01 February 2018 Revised 05 March 2018 Accepted 15 March 2018 Available online 09 April 2018
____________________
Keyword:
Corrosion predictions models, Oil and gas environments, Carbon steel.
1. INTRODUCTION
Corrosion rate in oil and gas industries in-volve complex factors (Kurniawan, et al.,
2016). Those models basically are focused on CO2 environments (Asmara & Ismail, 2011a).
The additional factors such as H2S, H2S scaling
effects, oil wetting effects, multiphase flow, precipitation of corrosion product films, in-hibitor are, sometimes, also accounted in pre-dictions (Asmara, et al., 2011b).
Indonesian Journal of Science & Technology
DOI: http://dx.doi.org/10.17509/ijost.v3i1.10808
p- ISSN 2528-1410 e- ISSN 2527-8045 Because concepts and methods to
pre-dict corrosion rate are calculated in different ways, it is frequently found that there are dif-ferences of the corrosion data calculated by different models under nearly identical condi-tions. Some models provide over-estimate of corrosion rates than others(Leong, et al.,
2016). Corrosion models are formulated using various scenarios among theories and experi-ments (Alia, et al., 2017). Those models use parameters and formulas from literatures, ex-perimental data and their own experiences to calculate corrosion rate data (Asmara, et al.,
2013). The types of corrosion models can be classified into three types. The first is mecha-nistic models which uses theoretical back-ground and physical formulas to express the mechanisms of corrosion reactions. Secondly is empirical corrosion prediction model (Asmara, & Ismail, 2012). It is developed based on best-fit parameter in experimental regression. And the third is semi empirical models (Asmara, et al., 2016). This model is developed using parameters and formula from literatures and based on the research-ers’ e perie es. The models are also useful to manage corrosion protection strategy for the life of the metallic structural by optimizing the correct material selections. Thus, it is es-sential to use the appropriate corrosion model which is suitable for certain conditions in order to obtain correct corrosion rate data. So, the most cost-effective is achieved.
2. MECHANISTIC MODELS
The main concepts of mechanistic mod-els are using electrochemical reactions and physical changes of mechanism formulas (Asmara & Ismail, 2007). They includes state properties, thermodynamics theories of all species. It includes electrochemical reactions and diffusion process. Mechanistic model states that corrosion process covers mass transfer (diffusion), electrochemical reactions
which are oxidation/reduction reactions. The model focuses on cathodic and anodic reac-tions which occur in the system involving sev-eral species. The mechanism of anodic disso-lution depends on the dissodisso-lution rate and on the activity of hydroxide ions. While cathodic processes are related to the reduction of the species involved. Examples of mechanistic corrosion models are models derived by (de Waard & Milliams, 1975; Nesic 2007), etc.
2.1. Electrochemistry Processes
To investigate the corrosion mecha-nisms, electrochemical processes consider metal surface reactions which are transport process for each species that involves in the reactions. The model focuses in cathodic and anodic reactions which happen in the sys-tems. The electrochemical is chemical reac-tions where electrons are transferred be-tween molecules which is called oxidation/re-duction reactions in anodic and cathodic site (Nordsveen, et al., 2003).
2.2. Anodic Reactions
In anodic reactions, there is dissolution of metal. It is around the corrosion potential which can be under activation control or pas-sivation process. The mechanism of activation control was proposed by (Bockris, et al.,
1961). Anodic charge transfer in carbon steel is expressed as (Wang, 2002):
2.3. Cathodic Reactions
In metallic corrosion, cathodic processes are due to the reduction of separate species, i.e., H+,H
2O, H2CO3 and HCO3-. In acidic
solu-tions, the reduction of H+ is the dominant
DOI: http://dx.doi.org/10.17509/ijost.v3i1.10808
p- ISSN 2528-1410 e- ISSN 2527-8045 reactions in cathodic site, which are diffusion
limiting current density and activation current density. Activations current density are given by expression (Wang, 2002):
The exchange current density is given by
2
The limiting current density results from dif-fusion-limited transport of protons to the metal surface and can be calculated as
H m
H
K
Fa
i
,lim
(5)
where km is the mass transfer coefficient. The value of km can be calculated if the flow re-gime, diffusion coefficient of H+ ions and
solu-tion viscosity are known.
2.4. Scale formation
In the case of corrosion product on the metal surface with film formation, it can be expressed mathematically. These corrosion mechanisms are based on several assump-tions which can be described as follows: con-vective diffusion, molecular diffusion, and dif-fusion via solid film. Corrosion mechanism which happens in solutions as a combination of mix gases can be expressed from the fol-lowing equation. This expression is the case of corrosion rate of steel due to mixed species
species i (m/s). Cb is the bulk concentration of
species i (mol/m3), C
o is the interfacial
con-centration of species i at outer scale/solution interface (mol/m3), D
i is the diffusion
coeffi-cient for dissolved species i (m2/s), is the
outer scale porosity, is tortuosity factor, Ci
is interfacial concentration of species i, os is
the thickness of outer film scale, hbl is the
tur-bulence boundary layer thickness, mbl is the
mass transfer boundary layer thickness, f is the film thickness, A is the Arhrhenius con-stants, Tkis the temperature (Kelvin), and cs is
the surface concentration.
3. CORROSION PREDICTIONS SOFTWARE
DOI: http://dx.doi.org/10.17509/ijost.v3i1.10808
p- ISSN 2528-1410 e- ISSN 2527-8045 3.1. NORSOK
The NORSOK standard is owned by Nor-wegian Oil Industry Association and Federa-tion of Norwegian Manufacturing Industries. The program covers only calculation of corro-sion rates where CO2 is the corrosive agent. It
does not include the corrosivity, e.g. contam-ination of O2, H2S etc. The model is an
empir-ical model for CO2 at different temperatures,
pH, CO2 fugacities, wall shear stresses, and
temperatures from 20 to160°C. The model calculates pH and wall shear stress. The effect of acetic acid is not account for in this model, but it is still valid to predict corrosion rate if the concentration of acetic acid is less than 100 ppm.
3.2. ECE (Electronic Chemical Engineering)
ECE program software calculates corro-sion rate based on the modified model by (de Waard & Milliams 1975). ECE model includes oil wetting correlation based on field correla-tion. ECE proposes a corrosion prediction ex-pression using corrosion reactions and mass transfer effects. The mass transfer represents the main part of the dependence on flow ve-locity and pipe diameter. In ECE, they develop corrosion prediction by involving several vari-ables such as gas fugacity, formation of pro-tective films, effect of ferrous ions, presence of oil, effect of condensing water, and effect of multiple phase.
3.3. Cassandra (DWM 93)
Cassandra is a model developed based on the experiences of (de Waard & Milliams 1975). The input includes pH, CO2
concentra-tion, temperature, and water contaminant. This model does not consider scaling temper-ature. The user must set an assumption of the scaling temperature. This model has im-portant aspects which influence rate of corro-sion, namely corrosion inhibitor availability and corrosion risk categories. The model also
accounts for the presence of acetate in water as acetic acid. The major input to the model are: CO2 mole %, temperature, total pressure,
liquid velocity and water chemistry. Besides that, the model has secondary input, such as hydraulic diameter and glycol concentration, oil type (crude or condensate) and water type (condensed water or formation water). The effect of oil wetting in this model is not in-cluded.
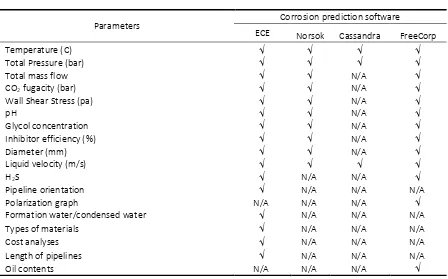
3.4. Parameters Comparison of NORSOK and CASSANDRA Models
Both NORSOK and Cassandra have limita-tions in predict the corrosion rate. Table 1 shows the parameter comparison between NORSOK and Cassandra models.
3.5. Experimental Corrosion Predictions Mod-els in Oil and Gas Environments
The corrosion mechanism of mild steel in the presence of CO2 in various conditions has
been a widely reviewed by researchers. Tthere are many experiments and field stud-ies have been conducted. The initial studstud-ies in CO2 corrosion was conducted by (de Waard &
Milliams 1975) that have become a funda-mental concept for the further studies on the CO2 corrosion phenomenon. The newest of
corrosion mechanism was studied by (Nesic & coworkers 2007) who have claimed to be suc-cessful in modeling CO2 corrosion rate based
on theoretically. Table 2 compiles corrosion predictions formulas based on experimental data.
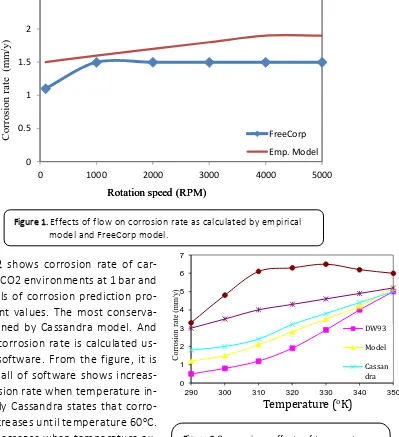
3.6. Effect of Flow in Corrosion Modelling
DOI: http://dx.doi.org/10.17509/ijost.v3i1.10808
p- ISSN 2528-1410 e- ISSN 2527-8045 abrasion. Water that flows to the surface can
wear the corrosion product film or create shear stress to the surface. Thus, corrosion will occur faster (Eisenberg et al., 1954). Cor-rosion rate also can increase due to effects of differences in velocity turbulence across the surface. Parameters that influence flow
induced corrosion are hydrodynamic
boundary layer and rate of momentum transfer from the bulk to the wall. In this conditiion, corrosion may be controlled by the rate of mass transfer of a reactant or the rate of corrosion products. As calculated by two models, they are confirmed that
increasing flow rate corrosion rate will also in-crease. However, empirical model calculates corrosion rate higher than freecorp model. Empirical model states that increasing flow, corrosion rate continues increase, while freecorp finds that the highest corrosion rate occurs at 1000 rotation speed. FreeCorp indi-cates that when rotation speeds are more than 1000 rpm, corrosion rate will remain constant which refers to limiting current den-sity (Silverman, 2004).
Parameters
Corrosion prediction software
ECE Norsok Cassandra FreeCorp
Temperature (C)
Total Pressure (bar)
Total mass flow N/A
CO2 fugacity (bar) N/A
Wall Shear Stress (pa) N/A
pH N/A
Glycol concentration N/A
Inhibitor efficiency (%) N/A
Diameter (mm) N/A
Liquid velocity (m/s)
H2S N/A N/A
Pipeline orientation N/A N/A N/A
Polarization graph N/A N/A N/A
Formation water/condensed water N/A N/A N/A
Types of materials N/A N/A N/A
Cost analyses N/A N/A N/A
Length of pipelines N/A N/A N/A
Oil contents N/A N/A N/A
DOI: http://dx.doi.org/10.17509/ijost.v3i1.10808
p- ISSN 2528-1410 e- ISSN 2527-8045
CR= e− 9225/T x10−pH x5.848x1017
For worst case calculation of the corrosion rate (CR) of low alloy steel in slightly sour conditions
�� = 31.15 �� �� � ∆� 1 . � . ��. ��− /� Crude oil type and water cut (W<30%)
�� = 31.15 �� �� � ∆� 1 . � . ��. ��− /� Crude oil type and water cut (W>30%)
CR is corrosion rate (mm/yr), ΔP/L is the pressure gradient (N/m3), W is water cut, PCO2 is partial pres-sure of carbon dioxide (MPa), T is temperature (K), Crcrude is factor to account for crude oil type, based on (0< Crcrude <1), Crfreq (= 0.023 (F) + 0.35) is the normalized factor to account for slug frequency (0< Crfreq <1), and F is slug frequency to a maximum of 35 slugs/minute.
Vcor = 31.15 Crfreq Croil (0.38 Fr)0.3 wc0.6 PCO20.8 T exp(-2671/T)
where Crfreq is term for slug frequency, Croil is term for crude oil type, wc is water fraction ( %), T is temperature in K, Fr is Froude number in the liquid film defined as: Fr is (Vt – Vf) / (g hf)0.5 (10) with
Vt is translational velocity of the slug (m/s), Vf is average velocity of the stratified liquid film (m/s),G
is acceleration due to gravity(m2/s), andhf is effective height of the liquid film.
CR = 8.6988 +9.856x10⁻³ (O
2)-1.48x10⁻⁷(O2)- 1.30865(pH) +4.934x10⁻²(CO2)(H2S)-
4.8231x10⁻⁵(CO
2)(O2)-2.372x10⁻³(H2S)(O2)-1.113x10⁻³(O2)(pH)
where CR is general corrosion rate, (O2) is O2 concentration of gas (ppmv), (CO2) is CO2 concentration
of gas (psi), H2S is H2S concentration of gas (psi), pH = pH initial
�� = 31�� (∆��) 1 . � . �
�. ����− /�
CR is general corrosion rate, FF is the frequency factor, (DP/L)0.33 is the flow pressure gradient in Pas-cal/meter, (PCO2)0.8 is the CO2 partial pressure in MPascal, T is the Kelvin temperature.
3.7. Effects of Temperature on Corrosion Rate of Carbon Steel
In oil and gas environments (CO2
sys-tem), temperature affects the conditions for formation of the protective carbonate layers and affects corrosion rate in a differ-ent manner. At temperatures lower than 60 °C, the solubility of FeCO3 is high and the
precipitation rate is slow; thus protective
films will not form until the pH is increased more than solubility product (Nafday, 2004). Above 60°C the solubility of FeCO3
decreases and the protectiveness of the iron carbonate layer increases with tem-perature; thus, the corrosion rate is re-duced. Scaling temperature is the temper-ature where corrosion rate reaches a max-imum value.
DOI: http://dx.doi.org/10.17509/ijost.v3i1.10808
p- ISSN 2528-1410 e- ISSN 2527-8045
0
290 300 310 320 330 340 350
Co bon steel in CO2 environments at 1 bar and pH 5. Models of corrosion prediction pro-vide different values. The most conserva-tive is obtained by Cassandra model. And the lowest corrosion rate is calculated us-ing norsok software. From the figure, it is clearly that all of software shows increas-ing of corrosion rate when temperature in-creases. Only Cassandra states that corro-sion rate increases until temperature 60oC.
It tends to decrease when temperature ex-ceeds 60oC. The temperature is called as
scaling temperature. From the figure, it also shows that there are obvious differ-ences among the models. It means that un-derstanding effects of temperature on cor-rosion rate are still under debatable. Every models uses different approach to count corrosion rate. The differences come from different assumption regarding effects of film formation, quality of film, solubility of FeCO3, saturation of pH, water cut,
interac-tion among species (Silverman, 2004).
4. EFFECTS OF pH
pH is an important parameter for corro-sion process. Normally, corrocorro-sion rate will be lower at higher pH,. The pH of a wet gas in CO2
system is often assumed as equal to the satu-ration of FeCO3 precipitation. Figure 3 shows
the predicted corrosion rates as effects of pH which differs depending on the models.
0
0 1000 2000 3000 4000 5000
FreeCorp
Figure 1. Effects of flow on corrosion rate as calculated by empirical model and FreeCorp model.
DOI: http://dx.doi.org/10.17509/ijost.v3i1.10808
p- ISSN 2528-1410 e- ISSN 2527-8045
From the figure, corrosion predictions software present large difference when pH is 4. But at pH 6, almost all models give the same values. These are because various as-sumptions in calculating corrosion rate as ef-fects of pH.The pH in CO2 system is often as-sumed as equal to the saturation of FeCO3 precipitation. The pH can also be calculated by involving the concentration of species such as CO2, H2CO3, HCO3-, CO32-, H2S, HS-, S 2-, H+, OH-, H2O, Fe2+ , CH3COOH (acetic acid), CH3COO-. Sometimes, pH calculation can be done by incorporating the FeCO3 precipita-tion kinetics. The pH is also influenced by H+ ions concentration, temperature, pressure, and ionic strength. Thus pH in calculation can be different among the models software. Dis-solved iron bicarbonate as the initial corro-sion product will also contribute to increase the pH of solution.
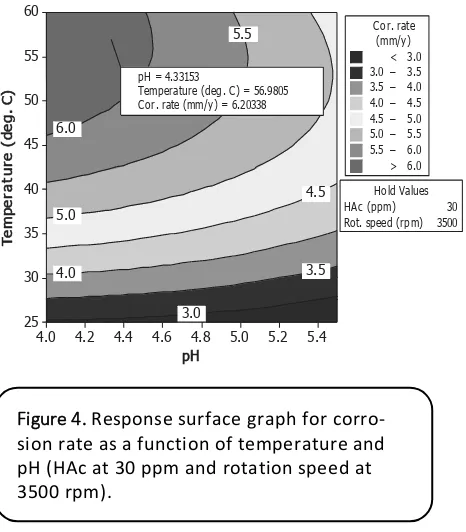
Design of Experiment (DOE) and Statistical Modeling for CO2 System
Recently, empirical models of corrosion processes have been used to predict corro-sion process involving several independent variables. However, most of the empirical models do not predict the corrosion rate in several variables simultaneously (Mokhtar,
2005). Using empirical methods, modeling in-teractions effects among the species and the operational conditions simultaneously, re-quire large number of experiment which is costly and takes time. These limitations can be overcome by using design experiment of response surface methodology (RSM). This is a simple method and believed can represent overall unselected variables.
6.0
Temperature (deg. C) = 56.9805 Cor. rate (mm/y) = 6.20338
The application of RSM allows visualiza-tion of the experimental results in a 3-D
Figure 3 Comparison effects of pH on corrosion rate of carbon steel at pH5 and 1 bar as calculated by some corrosion models.
DOI: http://dx.doi.org/10.17509/ijost.v3i1.10808
p- ISSN 2528-1410 e- ISSN 2527-8045 display. RSM is used to determine optimal
lev-els for variables input. RSM is a sequential procedure for constructing empirical relation for the experimental data. Using response in-formation, the optimum data between fac-tors can be developed and model improve-ments can be achieved. It has been proven that researchers have used response surface method (RSM) to process data systematically that can allow to apply multiple regression simultaneously. Response surface design methodology is also often used to refine mod-els to obtain an optimum design. RSM is use-ful to obtain critical points in the experimental variables. The surfaces generated by linear or polynomial models can be used to indicate the direction in which the original design must be started to attain the optimal condi-tions. For polynomial models, the critical point can be characterized as maximum, min-imum, or saddle. Using RSM, it is possible to calculate the coordinates of the critical point through the first derivative of the mathemat-ical function (Asmara, et al., 2017). First deriv-ative equals to zero indicates that critical points is located. They have studied corrosion rate in CO2 environments by using RSM
suc-cessfully (Mune, et al., 2008). They are all claim that RSM can reduce number of experi-ments with satisfied results.
5. CONCLUSION
There are differences of corrosion rate predicted by various corrosion models. Varia-tions of results are caused by assumpVaria-tions made by corrosion models. Particular param-eters such as H2S concentration, scale effects,
effects of wall shear stress and hydrodynamic condition of the solutions conditions will im-pact on results. ECE and FreeCorp are the models with more parameters inputs. These two models are flexible which can be applied for any environmental conditions. Other model like Cassandra gives more conservative which contribute a greater over design. Em-pirical methods combined with RSM propose improvements techniques. RSM can over-come limitation of pure empirical methods by simplifying experiments models. Selecting the best corrosion models require further inter-pretation to explain real conditions, thus mechanistic methods are more realistic. The user should also understand comparison re-garding limitation, advantages and scope of assumptions of the models to obtain appro-priate data.
6. ACKNOWLEDGMENTS
The authors are thankful to Universiti Teknologi Petronas and Universiti Malaysia Pahang for providing grant and facilities for the research.
7. AUTHORS’ NOTE
The author(s) declare(s) that there is no conflict of interest regarding the publication of this article. Authors confirmed that the data and the paper are free of plagiarism.
8. REFERENCES
Alia, F. F., Kurniawan, T., Asmara, Y. P., Ani, M. H. B., & Nandiyanto, A. B. D. (2017, October). High temperature oxidation in boiler environment of chromized steel. IOP Conference Series: Materials Science and Engineering, 257(1), 012086.
DOI: http://dx.doi.org/10.17509/ijost.v3i1.10808
p- ISSN 2528-1410 e- ISSN 2527-8045
Asma, R. N., Yuli, P. A., & Mokhtar, C. I. (2011b). Study on the effect of surface finish on corro-sion of carbon steel in CO2 environment. Journal of Applied Sciences, 11(11), 2053-2057.
Asmara, Y. P., & Ismail, M. C. (2012). Efficient design of response surface experiment for cor-rosion prediction in CO2 environments. Corcor-rosion Engineering, Science and Technology, 47(1), 10-18.
Asmara, Y. P., Juliawati, A., & Sulaiman, A. (2013). Mechanistic model of stress corrosion crack-ing (scc) of carbon steel in acidic solution with the presence of H2S. IOP Conference Series: Materials Science and Engineering, 50(1), 012072).
Asmara, Y. P., Ismail, M. F., Chui, L. G., & Halimi, J. (2016). Predicting Effects of Corrosion Ero-sion of High Strength Steel Pipelines Elbow on CO2-Acetic Acid (HAc) Solution. IOP Con-ference Series: Materials Science and Engineering, 114 (1), 012128.
Asmara, Y. P., Siregar, J. P., Kurniawan, T., and Bachtiar, D. (2017). Application of response sur-face methodology method in designing corrosion inhibitor. IOP Conference Series: Ma-terials Science and Engineering, 257(1), 012090.
Bockris, J. M., Drazic, D., & Despic, A. R. (1961). The electrode kinetics of the deposition and dissolution of iron. Electrochimica Acta, 4(2-4), 325-361.
de Waard, C., & Milliams, D. E. (1975). Carbonic acid corrosion of steel. Corrosion, 31(5), 177-181.
Eisenberg, M., Tobias, C. W., & Wilke, C. R. (1954). Ionic mass transfer and concentration po-larization at rotating electrodes. Journal of the Electrochemical Society, 101(6), 306-320.
Kurniawan, T., Fauzi, F. A. B., & Asmara, Y. P. (2016). High-temperature Oxidation of Fe-Cr Steels in Steam Condition–A Review. Indonesian Journal of Science and Technology, 1(1), 107-114.
Leong, Y., Alia, F., & Kurniawan, T. (2016). High Temperature Oxidation Behavior of T91 Steel in Dry and Humid Condition. Indonesian Journal of Science and Technology, 1(2), 232-237.
Mokhtar, I. C. (2005). Prediction CO2 corrosion with the presence of acetic acid. (Doctoral dissertation: UMIST).
Mune, M. A. M., Minka, S. R., & Mbome, I. L. (2008). Response surface methodology for opti-misation of protein concentratepreparation from cowpea [Vigna unguiculata (L.) Walp]. Food chemistry, 110(3), 735-741.
Nafday, O. A. (2004). Film Formation and CO2 Corrosion in the presence of Acetic Acid (Doctoral dissertation, Ohio University).
DOI: http://dx.doi.org/10.17509/ijost.v3i1.10808
p- ISSN 2528-1410 e- ISSN 2527-8045
Nordsvee , M., Neši , S., N org, R., & Sta gela d, A. 00 . A e ha isti odel for ar o dioxide corrosion of mild steel in the presence of protective iron carbonate films—part 1: theory and verification. Corrosion, 59(5), 443-456.
Silverman, D. C. (1988). Rotating cylinder electrode—geometry relationships for prediction of velocity-sensitive corrosion. Corrosion, 44(1), 42-49.
Silverman, D. C. (2004). The rotating cylinder electrode for examining velocity-sensitive corro-sion—a review. Corrosion, 60(11), 1003-1023.