Asia
Structural growth as a result of a strong economy and rising middle class
________________________________________________________________________________________________________________ Deutsche Bank AG/Hong Kong
This research has been prepared in association with PT Deutsche Bank Verdhana Indonesia. The opinions contained in this report are those of PT Deutsche Bank Verdhana Indonesia.
Deutsche Bank does and seeks to do business with companies covered in its research reports. Thus, investors should be aware that the firm may have a conflict of interest that could affect the objectivity of this report. Investors should consider this report as only a single factor in making their investment decision. DISCLOSURES AND ANALYST CERTIFICATIONS ARE LOCATED IN APPENDIX 1. MCI (P) 148/04/2014.
Samuel Sentana
PT Deutsche Bank Verdhana Indonesia Research Associate
(+62) 21 2964 4512 [email protected] Reggy Susanto, CFA
PT Deutsche Bank Verdhana Indonesia Research Analyst
(+62) 21 2964 4527 [email protected] Albert Saputro
PT Deutsche Bank Verdhana Indonesia Research Analyst strong structural upside in an underpenetrated market due to the emergence of
Indonesia’s middle class. Our top sector picks are Siloam International (SILO),
the largest private hospital operator, and Sarana Meditama (SAME), a mature hospital operator with strong pricing power. We initiate coverage on SILO and SAME with Buy ratings as we see hospitals as the best pure play for exposure to Indonesia’s rapidly growing healthcare industry.
Bigger pie for all driven by strong domestic economy
We are bullish on private hospital operators, as they are the primary beneficiaries of rising healthcare expenditure, which has posted a 15% CAGR during 2009-13, a multiplier of 2.5x real GDP growth. We believe there is still much room for growth in years to come, as Indonesia’s per capita spending on healthcare, of US$108, is still half that of Thailand’s and one-quarter of Malaysia’s. In addition, Indonesia’s ratio of nine hospital beds per 10,000 people is much lower than Thailand’s 21 and Malaysia’s 19. In a country of 250mn people, this suggests that there is room for 250,000 additional beds or c. 2,500 more hospitals before Indonesia reaches peer levels. Growing affluence is expected to bolster demand for private hospitals due to its superior quality and as public hospitals get overcrowded due to the start of universal health care. In addition, hospitals should benefit from the secular trend of an aging population, as over the next 10 years the number of Indonesians aged 65 years+ is projected to increase by c. 23mn, equivalent to the whole population of Australia.
Growth in beds far outstripping growth in specialists
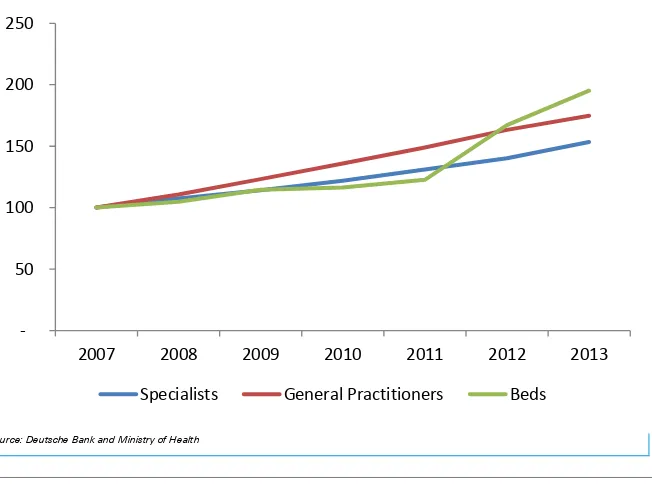
In line with the tremendous opportunity in healthcare, the number of hospital beds in Indonesia has posted a 12% CAGR from 2007-13, far outstripping the 7% CAGR in the number of specialists during that period. Thus the key challenge, in our view, is the ability to attract and retain highly trained specialists, who are the main attraction of hospitals, while maintaining reasonable compensation levels.
Broad-based expansion to drive earnings
We believe SAME and SILO’s EBITDA should register 17% and 25% p.a. growth respectively over the next five years. The former is driven by its brownfield expansion, whilst the latter is driven by its aggressive geographical expansion (+10 hospitals in three years).
Valuation is still attractive at 1.4x EV/EBITDA to growth 2015F
Page 2 Deutsche Bank AG/Hong Kong
Table Of Contents
Healthcare valuation ... 3
Company overview ... 5
SILO –Indonesia’s largest private hospital operator... 5
SAME – mature hospital player with pricing power ... 6
Key risks ... 9
Indonesia Healthcare Industry ... 11
Healthcare expenditure fuelled by the rising middle class ... 11
Healthcare sector still heavily underpenetrated ... 12
Private hospitals a proxy to the middle income class growth ... 13
Aging population creates opportunities ... 14
Defensive nature of hospitals demonstrated amid poor macro environment ... 15
Hospital landscape in Indonesia ... 16
Growth in beds far outstripping growth in specialists ... 17
Big potential for geographical expansion, but big staffing challenges ... 18
National health insurance scheme provides long-term opportunities ... 20
Medical travel: threat in the short-term, but an opportunity in the long-term .. 22
Relevant Regulations ... 23
Siloam International ... 24
Deutsche Bank AG/Hong Kong Page 3
Healthcare valuation
We initiate coverage on Siloam Hospitals (SILO) and Sarana Meditama (SAME) with Buy recommendations and target prices of Rp17,000/share and Rp3,170/share respectively. We believe the companies’ attractive growth profiles and significant expertise should position them well to benefit from the underpenetrated Indonesian healthcare industry.
At our target price, SILO’s valuation on an EV/EBITDA basis appears expensive at 42.5x and 30.9x 2015-16 EV/EBITDA vs. ASEAN peers at 21x and 18x in the same period. However, we believe the valuation is justified, especially given the strong EBITDA growth profile of about 25-27% p.a. over the next five years compared to peers at about 12-13%.
Similarly, we think that at our target price, SAME’s relatively premium valuation of 23x 2015E EV/EBITDA vs. peers at 14.9x is justified, given a relatively strong EBITDA growth profile (our forecast of 20%CAGR 2013-16).
Figure 1: Hospital regional valuation comps
Company name Current price Sales growth (%) EBITDA growth ROE (%) EBITDA Margin (%)
EV/EBITDA EV/EBITD A growth
ICY :14Y :15Y :14Y :15Y :14Y :15Y :14Y :15Y :14Y :15Y :15Y
Raffles Medical 3.8 8.1 11.1 13.2 13.2 13.7 14.2 23.4 23.8 24.1 21.8 0.9 Apollo Hospital 1,148.5 17.9 19.3 14.1 21.0 11.8 12.3 15.3 15.5 24.4 21.7 0.9 IHH Healthcare 4.8 12.4 15.8 17.9 16.1 4.2 4.9 25.2 25.2 22.6 19.4 0.9 KPJ Healthcare 3.9 11.5 13.3 30.0 13.3 10.4 10.5 11.1 11.1 16.9 15.3 0.7 Bangkok Dusit 18.3 11.3 15.4 21.9 17.1 16.8 18.0 22.6 22.9 24.4 20.6 2.8 Bangkok Chain 8.9 14.8 12.0 19.6 16.0 16.1 18.4 28.0 29.0 17.9 15.3 1.1 Bumrungrad Hospital 134.5 8.7 14.0 15.6 16.5 27.0 27.8 28.0 28.6 22.7 19.3 3.7 Ramsay Healthcare 52.8 15.3 42.5 31.6 41.4 20.2 21.6 15.0 14.9 16.8 13.4 1.0 Sonic Healthcare 18.9 12.3 6.9 21.9 6.1 13.1 13.4 18.9 18.8 12.8 11.8 1.5 Average ASEAN 34.1 11.7 14.1 21.0 15.8 14.9 15.9 23.0 23.4 20.9 18.0 1.9 Average Asia-ex China 142.8 12.4 16.7 20.6 17.8 14.8 15.7 20.8 21.1 20.3 17.6 1.5 Phoenix Healthcare 15.2 12.8 18.8 37.1 21.3 11.1 12.4 26.1 26.6 33.0 26.8 0.9 Aier Eye Hospitals 25.7 16.9 25.4 20.1 26.0 16.2 18.2 23.9 24.0 29.9 23.8 1.3 Topchoice Medical 52.0 28.4 28.4 75.1 28.3 18.5 19.4 47.4 47.3 29.7 23.6 1.3 Average China 31.0 19.3 24.2 44.1 25.2 15.3 16.7 32.4 32.6 30.9 24.7 1.1 Envision Healthcare 31.6 17.1 13.9 27.3 20.1 11.2 14.3 12.7 13.4 14.4 11.7 0.8 HCA holdings 66.0 7.7 5.1 14.1 5.3 (28.7) (47.8) 19.8 19.8 8.1 7.5 1.0 Davita Healthcare 76.1 8.0 6.4 15.8 5.9 15.4 16.4 19.0 18.9 10.2 9.4 0.6 Universal Health 98.8 8.9 7.7 8.7 9.8 15.6 16.7 18.4 18.8 9.0 8.0 1.1
Mednax 62.4 13.1 10.3 12.4 8.6 13.2 13.6 22.8 22.5 11.5 10.4 1.0
Tenet Healthcare 48.3 47.6 5.8 58.9 12.2 16.5 30.9 11.7 12.4 8.6 7.5 1.4 Community Health 48.7 45.6 8.5 68.5 11.8 8.3 11.1 15.0 15.5 7.8 6.8 3.7 Healthsouth Corp 39.1 5.1 6.2 1.2 7.4 33.3 18.3 24.7 25.0 8.7 7.9 1.0 Lifepoint Hospitals 65.9 21.9 13.3 28.3 11.3 6.6 7.9 14.2 14.0 8.2 7.0 7.3
Average US 59.7 19.4 8.6 26.1 10.3 10.1 9.0 17.6 17.8 9.6 8.5 2.0
Average 96.4 16.4 14.3 26.3 15.6 12.9 13.0 21.1 21.3 17.2 14.7 1.7
Sarana Meditama (SAME) 2765 20.3 22.7 21.5 22.9 36.5 23.8 30.0 30.1 27.8 23.1 1.8
Siloam Int (SILO) 14425 25.7 25.7 37.2 21.5 4.1 6.1 12.1 11.9 36.0 26.1 1.2
Page 4 Deutsche Bank AG/Hong Kong
Figure 2: SAME and SILO summary
2014F SAME SILO
Operations
Number of hospitals 2 18
Number of mature hospitals 2 4
Number of beds 264 2133
Number of specialist 190 1384
Number of doctors 29 343
Number of nurses 551 3108
Number of outpatient/year (th) 234 1500
Number of inpatient/year (th) 21 111.5
Bed Occupancy Ratio 68% 54%
Average Length of stay 3.1 4.3
Outpatient to inpatient conv. Rate 1% 3%
Emergency to inpatient conv. Rate 37% 41%
Financials
Revenue/outpatient (Rpth) 755 813
Revenue/inpatient (Rpmn) 10.83 18
Net Revenue (Rpbn) 405 2361
EBITDA (Rpbn) 122 397
NP (Rpbn) 57 67
Revenue growth CAGR 2014-2018 23% 22%
EBITDA growth CAGR 2014-2018 16% 28%
NP growth CAGR 2014-2018 -7% 13%
EBITDA Margin 30% 17%
Net Margin 14% 2%
Total Asset (Rpbn) 448 2724
Total Liability (Rpbn) 257 1018
Total Equity (Rpbn) 191 1706
ROE 36% 4%
Net Debt to Equity 72% 6%
Net Debt to EBITDA 1.1 0.3
Dividends 15% (subject to cash
flows and capex plan
NP <Rp150bn 10%, above 15-30%
EV/EBITDA 2015 (at current price) 22.7 36
EV/EBITDA growth 2015 (at current price) 1.7 1.2
Property Company owned Leased
Source of payment
From insurance 31% 20%
From corporate 33% 15%
From private 36% 65%
Deutsche Bank AG/Hong Kong Page 5
Company overview
SILO
–
Indonesia’s largest private hospital operator
PT. Siloam International Hospitals Tbk (SILO), is Indonesia’s largest and fastest growing private hospital operator with 18 hospitals, four of which are mature. Since the inception of its aggressive expansion program, SILO’s hospital portfolio has grown from four Java-centric hospitals to 18 nationwide hospitals of late. Going forward, the company aims to expand its portfolio to 40 hospitals across Indonesia in 2017E. Our forecast however, only assumes 28 hospitals by 2017E.
We believe that the company’s geographical expansion plan and relatively asset-light strategy should give it a competitive advantage to benefit from Indonesia’s underpenetrated healthcare market and rising healthcare spending. While the expansion plan carries big execution risks, we believe our forecast has conservatively taken this into account. Should the company be able to expand its operation per its guidance, we see potential upside to our target price, and this would also give the company a first-mover advantage in the 2nd- and 3rd-tier cities (which is very important due to the scarcity of specialist doctors and smaller market potential).
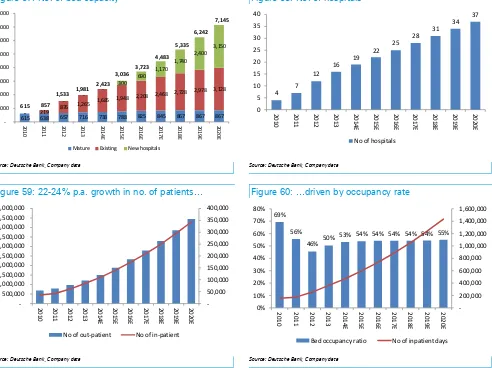
We forecast the company’s outpatient and inpatient numbers to grow by 22
-24% p.a. over the next five years, driven by bed expansion in the four existing mature hospitals, increasing occupancy in existing developing hospitals (about 13 hospitals), and we expect the company to add about three additional hospitals p.a. going forward to reach 40 hospitals by 2021. This, combined with around inflationary type pricing growth (6% p.a.), should lead to expanding EBITDA margin (gross) from 12% currently to 14% in 2020 and drive 25% p.a. EBITDA growth in 2014-2020. It is worth noting that the company recorded its EBITDA margin on a gross revenue basis (i.e., it includes 100% revenue from doctors’ services) vs. peers that quote revenue and EBITDA margin on a net basis. Roughly 27% of gross revenue is related to doctors’ services.
Figure 3: SILO’s EBITDA growth and margin
10% 11% 12% 13% 14% 15% 16% 17%
-200,000 400,000 600,000 800,000 1,000,000 1,200,000 1,400,000 1,600,000 1,800,000
EBITDA % EBITDA margin
Page 6 Deutsche Bank AG/Hong Kong
Figure 4: SILO’s number of outpatients Figure 5: SILO’s number of hospital
615 - 638 219 657 716 738 788 825 845 867 867 867
2010 2011 2012 2013 2014E 2015E 2016E 2017E 2018E 2019E 2020E
Mature Existing New hospitals
615 857
2010 2011 2012 2013 2014E 2015E 2016E 2017E 2018E 2019E 2020E
No of hospitals
Source: Deutsche Bank and Company Source: Deutsche Bank and Company
Figure 6: SILO’s number of inpatients Figure 7: SILO’s BOR
-2010 2011 2012 2013 2014E 2015E 2016E 2017E 2018E 2019E 2020E
No of out-patient No of in-patient
69%
2010 2011 2012 2013 2014E 2015E 2016E 2017E 2018E 2019E 2020E
Bed occupancy ratio No of inpatient days
Source: Deutsche Bank and Company Source: Deutsche Bank and Company
SAME
–
mature hospital player with pricing power
PT. Sarana Meditama Metropolitan Tbk (SAME) also known as Omni Hospitals is one of the most experienced private hospital providers in Indonesia with more than 40 years of experience in the business. The company now provides a full range of premier in-patient and out-patient hospital services through two hospitals – Omni Pulomas and Omni Alam Sutera. Both hospitals were recently awarded the highest accreditation certification under KARS, the Indonesian version of JCI. Going forward, we believe the company will add one more hospital in its portfolio through organic expansion or inorganic acquisition.
We believe the company is well positioned to benefit from the increasing middle income market segment and rising healthcare spending. This is especially given the company’s relatively mature hospital operation with potential expansion opportunities, which should yield a quicker and higher
return on investment. We forecast the company’s outpatients and inpatients to
grow by 8-12% p.a. over the next three years as the company continues to add
new bed capacity. We forecast the company’s operating beds to expand from
Deutsche Bank AG/Hong Kong Page 7 On top, we believe that the company should be able to grow its average
pricing (both inpatient and outpatient) by about 10-15% p.a. in the next two years, given its strong brand name in the area (i.e. strong specialist doctor support among others in medical areas such as neurosurgery, orthopaedic, cardiology, and urology). This should lead to the company’s EBITDA growing by about 16-17% p.a. over the next 4-5 years. In detail:
Figure 8: SAME’s EBITDA growth and margin
0.0%
2010 2011 2012 2013 2014E 2015E 2016E 2017E
EBITDA (Rp'bn) EBITDA margin (%)
17% EBITDA CAGR (2013-17E)
Source: Deutsche Bank and Company
Figure 9: SAME’s number of beds Figure 10: SAME’s number of outpatient and inpatient
120 145 145 145 145 168 168 168
2010 2011 2012 2013 2014E 2015E 2016E 2017E
Pulomas Alam Sutera New hospital 221 246 246
2010 2011 2012 2013 2014E 2015E 2016E 2017E
No of out-patient No of in-patient
Page 8 Deutsche Bank AG/Hong Kong
Figure 11: SAME’s BOR Figure 12: SAME’s no of inpatients
0% 10% 20% 30% 40% 50% 60% 70% 80%
2010 2011 2012 2013 2014E 2015E 2016E 2017E
Overall BoR (%)
Declining BoR in 2017 as new hospital is completed
-10,000 20,000 30,000 40,000 50,000 60,000 70,000 80,000 90,000 100,000
2010 2011 2012 2013 2014E 2015E 2016E 2017E
Pulomas Alam Sutera New hospital
Deutsche Bank AG/Hong Kong Page 9
Key risks
Shortage of specialists and nurses
In Indonesia, the key attraction of private hospitals are the specialists as, unlike in many other countries, patients can access specialists directly without consulting general practitioners beforehand. As such, about 90% of the doctors at the top private hospitals are specialists. The ability to recruit and retain qualified specialists, doctors and nurses is a big challenge for hospitals due to competition for talent and the shortage of personnel. While the annual supply of c. 7,000 new general practitioners is adequate, their recruitment and retention is dependent on the presence of highly qualified specialists, of which there is a significant shortage, growing at a rate of c. 2,000 per year. The number of hospital beds in Indonesia has posted 12% CAGR from 2007-13, far outstripping the 7% CAGR in the number of specialists during that period. Specialists are heavily concentrated in the major cities. Doctors may practise at a maximum of three hospitals or individual practice facilities. Indonesia does not currently permit employment of foreign doctors who do not have a practice license from the Ministry of Health. In addition, the current global nursing shortage has also impacted the ability to recruit and retain nurses.
Expansion delay
There could be delays in hospital expansion given the long licensing process and shortage of medical staff, although fixed operating expenses and capex may have been committed. New hospitals take years to mature and thus could lead to poor returns should occupancy rates not reach optimal levels. Expansion could put a strain on management, human resources and systems.
Competition risk from domestic and foreign hospitals
Competition is intensifying in the Indonesian healthcare sector from existing players (both government and private hospitals) and new local and foreign entrants, as well as from hospitals outside of Indonesia. This could result in aggressive pricing strategies that could put pressure on margins as well as eroding market share. A larger number of players competing for good-quality talent and prime locations will put upward pressure on costs.
Key management risk
One of SILO/SAME’s key strengths is its management’s solid industry
experience and track record. Failure to retain key personnel could adversely affect growth prospects. Rising competition also means that intense competition for qualified talent could put pressure on the ability to recruit and retain staff and have an impact on its expansion plans and cost base. Also regulations stipulate that the head of a hospital must be a medical doctor.
Macroeconomic and forex risk
Page 10 Deutsche Bank AG/Hong Kong
Acquisition risk
The acquisition of existing hospitals carries numerous risks, among others: failure to integrate into existing operations, the loss of key doctors and medical staff, potential litigation liabilities, diversion of management’s attention and failure to realize expected synergies.
Technology and IT risk
Rapid technological advances could render existing medical equipment obsolete. Hence, medical equipment needs to be upgraded frequently in order to provide services that patients demand. Doctors, nurses and medical technicians will also need to be constantly trained. In addition, the IT systems play a critical role in business operations: billing, clinical systems, diagnosis and treatment of patients, medical record and inventory management
Regulatory risk
The healthcare industry is subject to extensive government regulation, including to those relating to licensing, facility inspections, environmental permits, reimbursement policies and certain expenditures. Hospitals may be affected by changes in the government regulations relating to the mandatory allocation of class three hospital beds that must be provided. In addition, the government might require every private hospital to fully participate in the universal health care scheme.
Malpractice lawsuit and reputational risk
Hospitals may face malpractice lawsuits which may tarnish the brand and reputation of the hospital and their doctors and result in financial liabilities. Hospitals typically do not carry general malpractice insurance. Hospitals do not have complete control over specialist doctors as most are independent, hence they have limited ability to enforce uniform standards and practices.
SILO is currently party to two lawsuits which have been brought by former patients, seeking damages of Rp 226bn.
SAME’s Omni Alam Sutera outpatient visits declined slightly in 2009 due to negative publicity surrounding a defamation case against a patient.
Outbreak of infectious diseases risk
The outbreak of infectious diseases such as avian flu, SARS, Ebola, and others, may result in a lower number of patients that can be treated due to travel restrictions, quarantines and measures imposed by the government.
Payment and inventory risk
There could be delays in payments from individual patients, corporate clients, private insurers and government insurance. In addition, hospitals are required to dispatch ambulances in response to emergency calls, regardless of whether a patient is able to pay and can only transfer a patient to a government hospital once the condition has been stabilised. Hospitals also need to maintain an optimal level of inventory of drugs and medical equipment to provide services to patients.
Affiliated party and conflict of interest risk
Deutsche Bank AG/Hong Kong Page 11
Indonesia Healthcare
Industry
Healthcare expenditure fuelled by the rising middle class
We are initiating coverage on the Indonesian healthcare sector, which we believe has one of the strongest long-term structural growth profiles in Indonesia due to the rising private health expenditure of the emerging middle class in Indonesia’s growing economy.
Our top sector picks are Siloam International (SILO), the largest private hospital operator, and Sarana Meditama (SAME), a mature private hospital operator with strong pricing power.
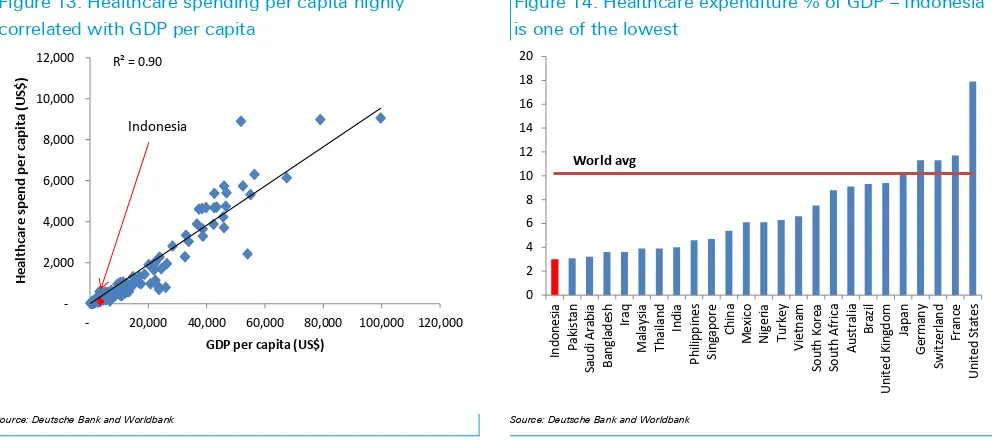
We are bullish on hospital operators as they are the primary beneficiaries of rising healthcare expenditure, which has posted 15% CAGR during 2009-13, a multiplier of 2.5x real GDP growth. Data from 179 countries from the WHO indicates a strong positive correlation between healthcare spend/capita and GDP/capita.
Indonesia’s robust GDP growth outlook should support further expansion in
domestic healthcare expenditure over the next few years. Urbanization and changing lifestyles should drive higher healthcare expenditure.
Notwithstanding the robust growth, the hospital industry remains largely underpenetrated. This is most clearly reflected in Indonesia’s healthcare expenditure which is only 3% of GDP, far lower compared to the world average of 10% and the East Asia average of 5%.
Figure 13: Healthcare spending per capita highly correlated with GDP per capita
Figure 14: Healthcare expenditure % of GDP – Indonesia is one of the lowest
Page 12 Deutsche Bank AG/Hong Kong
Figure 15: Robust growth in healthcare expenditure in Indonesia
Figure 16: …registering 15%CAGR in 2009-2013, 2.5 x the 6% CAGR GDP growth
Year
US$bn
IDRbn
%growth
2009
15.2
158,401
2010
18
188,123
18.8%
2011
20.4
212,487
13.0%
2012
23.9
249,671
17.5%
2013
26.6
277,669
11.2%
CAGR
15.1%
05 10 15 20 25 30
2009 2010 2011 2012 2013
US$bn
15%CAGR 2009-2013
Source: Deutsche Bank and Markit Source: Deutsche Bank and MArkit
Healthcare sector still heavily underpenetrated
The Indonesian healthcare sector is poised for strong growth due to its relative under-penetration. Indonesia’s penetration rates for various healthcare metrics are among the lowest in the world.
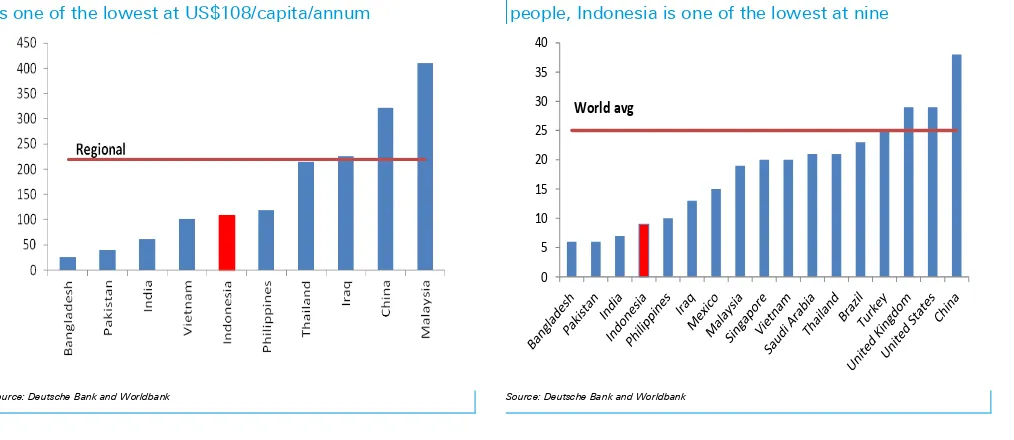
Indonesia’s per capita spending on healthcare, of US$108, is still half that of
Thailand’s US$215, one-third of China’s US$322 and one-quarter of Malaysia’s
US$410, and below the world average of US$220. There are only nine hospital beds per 10,000 people in Indonesia, which is much lower than Thailand’s 21
and Malaysia’s 19 and below the world average of 25. In a country of 250mn
people, this suggests that there is room for 250,000 additional beds or c. 2,500 more hospitals before Indonesia reaches the level of regional peers.
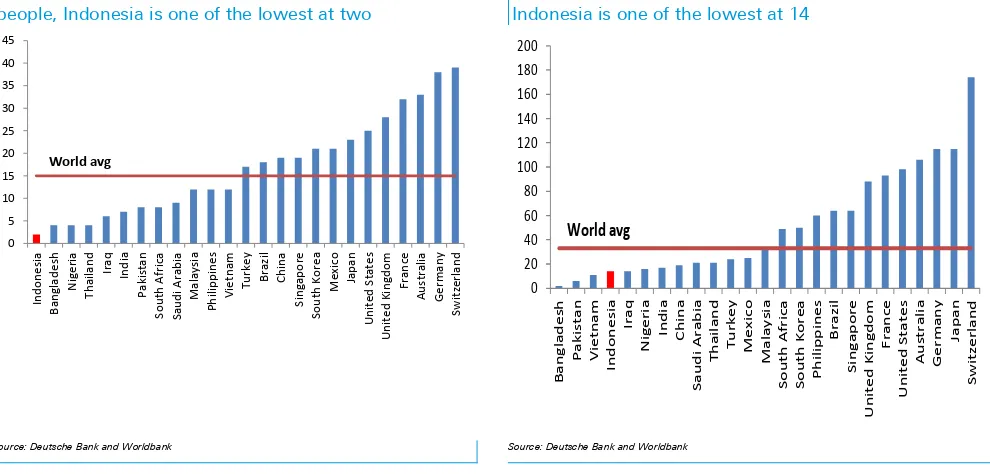
Indonesia’s number of physicians per 10,000 people, of two, is among the
lowest in the world, half that of Thailand’s four and one-sixth of Malaysia’s 12. There is also a lack of nurses, with only 14 nurses per 10,000 people, below Thailand’s 21, Malaysia’s 33, and the world average of 33.
Figure 17: Healthcare expenditure per capita, Indonesia is one of the lowest at US$108/capita/annum
Figure 18: Number of hospital beds available per 10,000 people, Indonesia is one of the lowest at nine
0
5 10
15
20 25 30 35 40
World avg
Deutsche Bank AG/Hong Kong Page 13
Figure 19: Number of physicians available per 10,000 people, Indonesia is one of the lowest at two
Figure 20: Number of nurses available per 10,000 people, Indonesia is one of the lowest at 14
0
Source: Deutsche Bank and Worldbank Source: Deutsche Bank and Worldbank
Private hospitals a proxy to the middle income class
growth
We believe private hospitals appeal to the Indonesian middle class consumers with their rising affluence, which drives the demand for higher quality health care. As wealth rises, purchasing power increases and living standards improve, consumers shift away from public hospitals with their long queues to private hospitals with their more personalised service.
Their target customers of middle class households, which we estimate have an annual disposable income of between US$5,000 and US$25,000, currently account for 63% of the total Indonesian population. According to the Euromonitor projection, this segment should continue to grow and will account for 81% of the population, or around 220 million potential customers, by 2020.
Most of the private hospitals, such as SILO and SAME, also target the upper middle income class households, which we estimate to have an annual disposable income of above US$15,000. This segment currently accounts for 14% of the total Indonesian population, a significant increase compared to only 2% a decade ago. Moreover, according to the Euromonitor projection, this segment should continue to grow and will account for 27% of the population, or around 72 million potential customers, by 2020.
Page 14 Deutsche Bank AG/Hong Kong
Figure 21: There could be 72mn people who have annual disposable income above US$15,000 by 2020
Figure 22: Translating into 27% of total households
0 2,000 4,000 6,000 8,000 10,000 12,000 14,000 16,000 18,000 20,000
2000 2001 2002 2003 2004 2005 2006 2007 2008 2009 2010 2011 2012 2013 2014F 2015F 2016F 2017F 2018F 2019F 2020F
Population in Households with an Annual Disposable Income Over US$15,000
0% 10% 20% 30% 40% 50% 60% 70% 80% 90% 100%
2000 2001 2002 2003 2004 2005 2006 2007 2008 2009 2010 2011 2012 2013F 2014F 2015F 2016F 2017F 2018F 2019F 2020F
Below US$5,000 Between US$5,000-15,000 Above US$15,000
Source: Deutsche Bank and Worldbank Source: Deutsche Bank and Worldbank
Figure 23: Penetration of single occupancy is still low Figure 24: Single rooms are 10% of total
0 2 4 6 8 10 12
Single Occupancy Multiple Occupancy Total
10%
90%
Single Occupancy Multiple Occupancy
Source: Deutsche Bank and Worldbank Source: Deutsche Bank and Worldbank
Aging population creates opportunities
We believe the healthcare sector will benefit from the secular trend of an aging population as over the next 10 years, the number of Indonesians aged 65 years+ is projected to increase by c. 23 mn, equivalent to the whole population of Australia.
The UN Statistics Agency estimates that by 2025F, the number of 65+years age population would grow to 66mn (vs. 43mn in 2014, +53%) which accounts for c.24% of the total population (vs. 17% in 2014).
We expect Indonesia’s 65+ segment to become an increasingly important
Deutsche Bank AG/Hong Kong Page 15
Figure 25: The number of people above 65+ should increase
Figure 26: 65+ citizens to 24% of population by 2025F
-20,000 40,000 60,000 80,000 100,000 120,000
2000 2005 2010 2015 2020 2025 2030 2035 2040 2045 2050
65+
0% 10% 20% 30% 40% 50% 60% 70% 80% 90% 100%
1980 1985 1990 1995 2000 2005 2010 2015 2020 2025 2030 2035 2040 2045 2050
0-14 15-64 65+
Source: Deutsche Bank and Worldbank Source: Deutsche Bank and Worldbank
Defensive nature of hospitals demonstrated amid poor
macro environment
The revenues of mature hospitals continue to show remarkable resilience, proving themselves to be even more defensive than consumer names, amid a perfect storm of GDP growth slowing down, fuel prices increasing by 44%, currency depreciating by 25% and interest rates going up by 275 bps.
Revenues at mature hospitals have grown relatively consistently by c. 10% yoy during the first three quarters of 2014, whereas revenue of retailers have on average slowed down to 13% from 20% and consumer staple companies to 13% from 21%. This, to us, demonstrates the defensive qualities of the healthcare sector in Indonesia, whereas demand for private hospital services remains relatively constant, regardless of the economic cycle volatility.
Page 16 Deutsche Bank AG/Hong Kong
Figure 27: Mature Hospitals* revenue and EBITDA margin unaffected by +44% fuel price hike in 2013
Figure 28: …whilst other defensive names declined
0%
Total Revenue (LHS) EBITDA margin (RHS)
4.9%
Consumer staples (LHS) GDP (RHS) YoY%
Source: Deutsche Bank and Bloomberg Finance LP, *based on SAME and SILO’s mature hospitals Source: Deutsche Bank and Bloomberg Finance LP
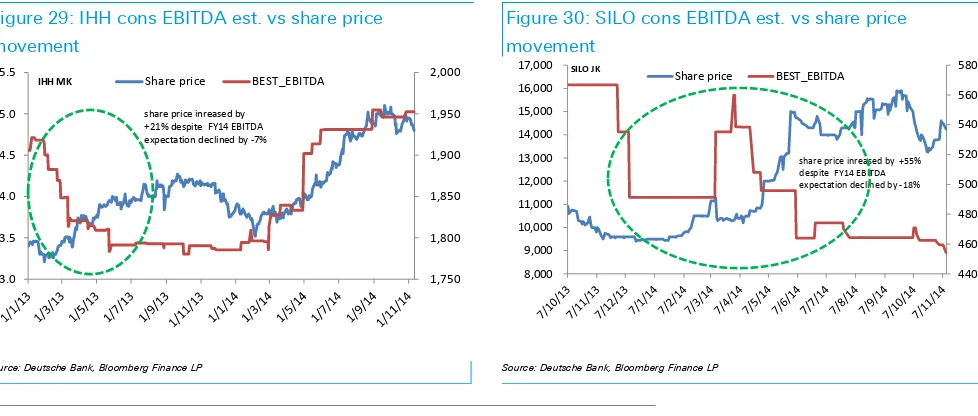
Indeed, we believe this defensive quality is also reflected in the share price reaction of hospital names towards negative earnings revisions. For instance,
consensus downgraded IHH’s FY14 EBITDA estimates by -7% but the share
price increased by +21% during the same period. Similarly, consensus
downgraded SILO’s FY14 EBITDA by -18% but the share price increased by
+55% during the same period. (See Figure 28-29)
Figure 29: IHH cons EBITDA est. vs share price movement
Figure 30: SILO cons EBITDA est. vs share price movement
share price inreased by +21% despite FY14 EBITDA expectation declined by -7%
share price inreased by +55% despite FY14 EBITDA expectation declined by -18%
Source: Deutsche Bank, Bloomberg Finance LP Source: Deutsche Bank, Bloomberg Finance LP
Hospital landscape in Indonesia
There are 2,389 hospitals in Indonesia with 67% of them being government-owned and non-profit and 33% being private hospitals. For the past five years, there has been an average of c. 170 hospitals opened per annum, 70% which are private
Deutsche Bank AG/Hong Kong Page 17 The landscape is still quite fragmented with the top 15 private hospital players
having 19% share of private hospital beds. We view this fragmentation as being an advantage for players with scale and brand recognition as the smaller players lack sufficient management capabilities and capital to expand.
SILO is the largest private hospital operator by network and number of beds. It operates 18 hospitals (only four of which are mature) with 2,133 operational beds (3.4% share of private hospital beds in Indonesia).
Mitra Keluarga Group (unlisted), which is affiliated with Kalbe Farma, is the second largest private hospital operator with 11 hospitals (10 of which are mature) with c. 1,700 operational beds (2.7% share).
Hermina (unlisted), which specialises in mother and child care, is number three with 18 hospitals and 1,500 beds (2.4% share)
Awal Bros (unlisted), the fourth largest, has eight hospitals and 1,038 beds (1.7% share). Four out of its eight hospitals are accredited by the US-based Joint Commission International, a body that surveys and certifies hospitals to assure it meets the highest international standards for health care.
We note that in Indonesia, there is a tendency for private hospital operators to be a subsidiary of a property developer group, such as the case of the Lippo Group and Ciputra Group. This is mainly due to the complementary nature of the hospital availability in their development areas as well as the land bank availability that the property developer has.
Figure 31: Private hospital landscape Figure 32: Private hospital landscape by no of beds
Number of
Source: Deutsche Bank and Ministry of Health Source: Deutsche Bank and Ministry of Health
Growth in beds far outstripping growth in specialists
Page 18 Deutsche Bank AG/Hong Kong highly sought-after medical professionals, while maintaining reasonable
compensation levels, will be the key factor in determining a hospital’s success.
In Indonesia, specialists are the main pull factor for patients as, unlike in many other countries, they can be directly accessed without consulting general practitioners beforehand. As such, about 90% of the doctors at the top private hospitals are specialists. Hence failure to attract specialists could lead to patients going to competitors or travelling abroad for treatment.
While the annual supply of c. 7,000 new general practitioners is adequate, their recruitment and retention is dependent on the presence of highly qualified specialists, of which there is a significant shortage, growing at a rate of c. 2,000 per year. Specialists are heavily concentrated in the major cities and they may practise at a maximum of three hospitals or individual practice facilities.
We note that in Indonesia, it takes a minimum of six years to become a qualified doctor and another three to six years to become a registered specialist, not to mention the high intellectual and monetary investment it requires. These significant upfront investments provide natural barriers to entry which limits the number of medical staff in Indonesia, especially in the case of specialists who tend to be main pull factor for a hospital.
Figure 33: growth in beds outstripping growth in specialists
-50 100 150 200 250
2007 2008 2009 2010 2011 2012 2013
Specialists General Practitioners Beds
Source: Deutsche Bank and Ministry of Health
Big potential for geographical expansion, but big staffing
challenges
Although areas outside of Jakarta are still heavily underpenetrated in terms of number of hospital beds, the main challenge is not building the facilities but rather to properly staff them with quality specialists and medical personnel.
Deutsche Bank AG/Hong Kong Page 19 Hence, as most of the specialists live in Jakarta (as seen by the ratio of 6 per
10,000 people being 6x higher than that of outside of Jakarta), the hospital beds naturally follow, with Jakarta having the highest number of beds per 10,000 people at 25, a level that is higher than Thailand and Malaysia.
Given all of the above factors, most private hospital groups tend to undergo extensive feasibility study before expanding into a new territory to ensure the workforce availability and favourable demographics that can provide them with adequate sustainable profitability.
Figure 34: The hospital industry is heavily concentrated in Jakarta…
Figure 35: …because the specialists are in Jakarta
-5 10 15 20 25 30
Java ex-Jakarta
East Indonesia
Sumatra Kalimantan Sulawesi Jakarta
Number of beds per 10,000
-1 2 3 4 5 6 7
East Indonesia
Kalimantan Sumatra Sulawesi Java ex-Jakarta
Jakarta
Number of specialists per 10,000
Source: Deutsche Bank and Ministry of Health Source: Deutsche Bank and Ministry of Health
Figure 36: General practitioners are concentrated in Jakarta as they also follow the specialists
Figure 37: Nurses are more spread out geographically
-5 10 15 20 25
Java ex-Jakarta
Sumatra East
Indonesia
Sulawesi Kalimantan Jakarta
Number of nurses per 10,000
Page 20 Deutsche Bank AG/Hong Kong
Figure 38: Specialists are heavily concentrated in Jakarta even after adjusting for number of beds
Figure 39: General practitioners are more spread out
-Kalimantan Sulawesi Sumatra Java ex-Jakarta
Jakarta
Number of specialists per 100 beds
-Number of doctors per 100 beds
Source: Deutsche Bank and Ministry of Health Source: Deutsche Bank and Ministry of Health
National health insurance scheme provides long-term
opportunities
We think that the national health insurance scheme will have limited impact for private hospitals in the near term, but over the longer term, we see opportunity, due to a demand shift from public to private hospitals as income levels increase and as public hospitals experience overcrowding.
Hence we believe that Indonesia will share a similar pathway to Thailand, where private hospitals are still thriving despite The public sector share of healthcare spending rising from 56% to 76% over the 13 years since universal healthcare coverage started in 2001
For Indonesia, the government kicked off the national health insurance scheme in 2014, which aims to provide health insurance coverage to all Indonesians by 2019. This program is administered by the BPJS, which is funded with an initial investment of US$2.6bn. As of October, BPJS has covered 130mn people or a 52% coverage ratio. An additional 30mn people are covered through regional program for the poor and 19mn by private insurance. Hence overall 72% of the population are covered by insurance.
Unlike the public hospitals, at the moment, private hospitals are not obligated to participate and provide treatment for everyone that is insured within the national health insurance scheme. The private hospitals have the complete freedom to choose which procedures they are willing to administer under the national health insurance scheme, hence they can ensure profitability and manageable occupancy levels.
Deutsche Bank AG/Hong Kong Page 21 Based on our channel checks, there will soon be insurance companies that
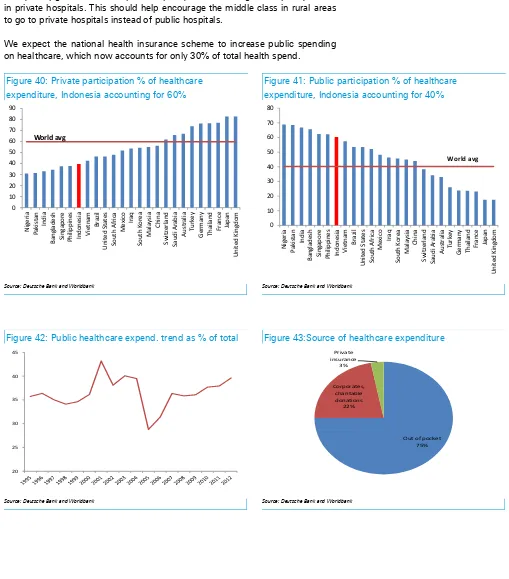
come out with products that complement the national health insurance scheme. For a fee, the insurance companies will provide the recipient with the ability to upgrade from multiple occupancy rooms to single occupancy rooms in private hospitals. This should help encourage the middle class in rural areas to go to private hospitals instead of public hospitals.
We expect the national health insurance scheme to increase public spending on healthcare, which now accounts for only 30% of total health spend.
Figure 40: Private participation % of healthcare expenditure, Indonesia accounting for 60%
Figure 41: Public participation % of healthcare expenditure, Indonesia accounting for 40%
0
Source: Deutsche Bank and Worldbank Source: Deutsche Bank and Worldbank
Figure 42: Public healthcare expend. trend as % of total Figure 43:Source of healthcare expenditure
20
Page 22 Deutsche Bank AG/Hong Kong
Figure 44: Indonesia national healthcare scheme target
Source: Deutsche Bank and SAME
Medical travel: threat in the short-term, but an opportunity
in the long-term
Affluent Indonesians spent US$650mn for medical treatment in Singapore and Malaysia (equivalent to 2.5% of total domestic healthcare spend), accounting for 50% of total medical travel spend in those two countries in 2012, based on an estimate by Frost & Sullivan.
This is mainly attributed to patients seeking the best medical service quality as the acute shortage of specialists in Indonesia often means long wait times with short face-to-face consultation times with the top domestic specialists. Hence, the perception of poor quality domestic healthcare combined with the belief that foreign-trained international doctors are superior, drives affluent Indonesians to seek treatment overseas.
International accreditation plays an important role to attract medical travellers as it acts as a signal that the hospital meets international standards.
In order to build confidence and compete with outbound medical travel, some Indonesian hospitals have striven to improve the quality of their service to meet international standards, mainly by seeking JCI (Joint Commission International) accreditation. The US-based firm surveys and certifies hospitals outside of the United States. A JCI accreditation assures patients that a hospital meets the highest international standards for the quality, safety and efficiency of health care.
The number of JCI-accredited hospitals in Indonesia has increased from one in 2007 to 19, as of October 2014. Indonesia has 19 JCI accredited hospitals, more than Malaysia (13) and the Philippines (6), though trailing Thailand (37) and Singapore (21).
We believe that over the long-term, such accreditation measures, combined with upgrades in facilities and human capital, can reverse the trend of affluent Indonesians going overseas for medical treatments and even attract inbound medical travellers due to its value-for-money proposition. The pricing of major medical procedures in Indonesia is typically lower than ASEAN peers. For instance,
Deutsche Bank AG/Hong Kong Page 23 Indeed, we find it encouraging that Bali is already attracting an increasing
number of medical travellers for various cosmetic enhancement procedures, medical check-ups, in vitro fertilisation, dental care and others.
Figure 45: Number of JCI-accredited hospitals in Indonesia has been rising
Figure 46: Outpacing Malaysia and the Philippines
0
2007 2008 2009 2010 2011 2012 2013 2014
Number of JCI accredited hospitals in Indonesia
Philippines Malaysia Indonesia Singapore India China Thailand
Number of JCI accredited hospitals in the region
Source: Deutsche Bank, JCI Source: Deutsche Bank, JCI
Figure 47: Price of medical procedures in Indonesia is typically lower compared to the regional level
USD USA Singapore Thailand Malaysia India Indonesia - High Indonesia - Mid Indonesia - Average
Heart bypass 130,000 18,500 11,000 9,000 10,000 12,500 5,000 8,750
Source: Deutsche Bank and AMA
Relevant Regulations
There are three primary laws regulating the healthcare industry in Indonesia: Law No. 44 Year 2009 on Hospitals and Health Minister Regulation No. 147/Menkes/Per/I/2010 on Hospital Licenses and Presidential Regulation No. 38 Year 2014 on the Negative Investment List, which caps foreign ownership of hospitals at 67% (70% ownership for ASEAN investors, in certain regions of Indonesia).
Hospitals must obtain an establishment licence, valid for two years and extendable for an additional year, and an operational licence, valid for five years and extendable as long as a hospital continues to meet the requirements. A hospital can also apply for a temporary operational licence valid for one year. Licences will be given subject to meeting specific requirements relating to health, environmental safety, spatial layout, assessment result and feasibility of hospital operation, infrastructure, medical equipment, human resources, and hospital administration and management.
Page 24 Deutsche Bank AG/Hong Kong equipment, facilities, infrastructure, administration and management. The head
of the hospital must be an Indonesian citizen, who is a medical person with expertise in the field of the hospital, and may not be the owner. Doctors may practise at a maximum of three hospitals or individual practice health facilities.
Deutsche Bank AG/Hong Kong Page 25
Source: Deutsche Bank estimates, company data
Expanding geographical presence, initiating with a Buy
We initiate coverage on Siloam International (SILO), Indonesia’s largest private hospital operator with 18 hospitals (four of which are mature) and 2,133 beds as of 9M14, with a Buy recommendation and Rp17,000/share price target. We believe SILO is well positioned to benefit from Indonesia’s underpenetrated healthcare market and increasing healthcare spending, given the company’s asset-light strategy and geographical expansion plan. However, we do acknowledge that while the aggressive expansion plan makes sense conceptually and could result in a very high growth profile, it carries big execution risks given the scarcity of specialists, especially in the outer islands.
Expansion and rental subsidy driving growth
We forecast EBITDA growth of 25-27% p.a. over the next five years for SILO (double the regional growth profile of 12-13%). This is mainly driven by 22% p.a. operational bed expansion. We also expect a gradual improvement in the company’s gross EBITDA margin from 12% currently to 14% by 2018 as the new hospitals start to become mature. SILO also benefits from a heavily subsidized rental rate from LPKR at a maximum 1-3% of gross operating revenue, although we acknowledge the risk that the subsidized rate may not be extended beyond the initial lease term of 15 years.
Potential upside depends on execution
In our forecasts, we try to take into account the high risks of SILO’s expansion plan and thus assume slower expansion to 40 hospitals by only 2021, vs. the
company’s plan of 2017. We expect the incremental hospitals to reach a
relatively mature stage in six to seven years vs. the company’s target of four
years. Our sensitivity analysis suggests 40% upside potential to our price target upon better execution.
DCF-based valuation of Rp17,000/share
Our TP is based on a DCF methodology with a WACC of 10.8%. At 1.2x EV/EBITDA growth 2015 and an EBITDA CAGR of 29% in 2015-18F, we believe SILO is still relatively attractive. Our price target implies 42.5x and 30.9x 2015-16E EV/EBITDA with 1.4x EV/EBITDA growth in 2015. Risks: expansion, recruitment and retention of specialists, rental rate, related-party transactions, financing availability, and weaker Rp.
Rating
Healing the nation; initiating with Buy
Samuel Sentana Price target - 12mth (IDR) 17,000 52-week range (IDR) 15,900 - 9,400 Jakarta Comp. Index 5,048.67
Price/price relative
Jakarta Comp. Index (Rebased)
Performance (%) 1m 3m 12m
Absolute 4.0 2.5 51.1
Jakarta Comp. Index 2.8 -2.3 17.4
Page 26 Deutsche Bank AG/Hong Kong
Model updated:05 November 2014 Running the numbers
Asia Indonesia Health Care
Siloam International
Reuters: SILO.JK Bloomberg: SILO IJ
Buy
Price (13 Nov 14) IDR 14,350
Target Price IDR 17,000
52 Week range IDR 9,400 - 15,900
Market Cap (bn) IDRm 16,590
USDm 1,359 Company Profile
Siloam International is the largest private hospital group in Indonesia. The company currently operates 13 hospitals which are all strategically located within Lippo Group
Sales growth (LHS) ROE (RHS)
Solvency
Net debt/equity (LHS) Net interest cover (RHS)
Samuel Sentana
+62 21 2964 4512 [email protected]
Fiscal year end 31-Dec 2012 2013 2014E 2015E 2016E Enterprise value (IDRbn) na 11,086 16,330 16,317 16,366
Valuation Metrics
Total shareholders' equity 245 1,639 1,706 1,762 1,841
Net debt -98 -456 -288 -301 -253
Deutsche Bank AG/Hong Kong Page 27
Investment thesis
Outlook
We initiate coverage on SILO with a Buy recommendation and a target price of Rp17,000/share. We believe that the company’s geographical expansion plan and relatively asset-light strategy should give it a competitive advantage to benefit from Indonesia’s underpenetrated healthcare market and rising healthcare spending. While the expansion plan carries big execution risks, we believe our forecast has conservatively taken this into account. Should the company be able to expand its operation as per its guidance, we see potential upside to our target price, and it would also give the company a first-mover advantage into the second- and third-tier cities (which is very important given the scarcity of specialist doctors and smaller market potential).
Asset-light strategy allows for aggressive expansion and rental subsidy. We believe the company’s business model (building rental from LPKR and FIRST REIT) should allow the company to aggressively expand its hospital operation (expanded from four hospitals in 2010 to 18 currently). This should provide support for 25-27% p.a. EBITDA growth over the next five years. We note that the company’s current ROE appears low at 3-4% as it has not fully deployed the cash proceeds from the IPO and some of its recent hospital investments are still in the development stage, which leads to a lower-than-industry EBITDA margin (some are still generating negative EBITDA due to low utilization).
Furthermore, the structure also permits the company to obtain a rental subsidy from the parent company, paying only a maximum of 3% of gross operating revenue for the first 15 years of operation vs. the average rental rate paid by LPKR to FIRST REIT for mature hospitals of about 18-20% of gross operating revenue.
However, we do highlight the risk that the subsidized rental rate may not be extended upon renewal of the sub-lease.
EBITDA margin expansion driven by maturing hospitals. As SILO’s new hospitals reach a mature stage, we expect the company’s gross EBITDA margin to expand from 12% currently to 14% by 2020 and net from 16% to 19% in the same period (please note that SILO accounts its gross revenue as including the doctors fee, which is around 27% of total revenue). We estimate that it takes six to seven years for a new hospital to reach a relatively mature stage vs. the company’s guidance of four years.
Attractive reward scheme assures retention of doctors. The
company’s Siloam Doctor Partnership Development Program (SDPDP)
Page 28 Deutsche Bank AG/Hong Kong We do, however, acknowledge the execution risks, especially given
the scarcity of specialist doctors and the company’s relatively short track record of building new hospitals and ramping them up to a mature stage. Out of the 18 hospitals in operation, only four have reached a mature stage, of which two were built by the company (namely Siloam Hospital Lippo Village in 1996, in partnership with Gleneagles, and Cikarang in 2002).
Furthermore, we highlight that the company has been under-delivering in terms of the occupancy ramp-up for new hospitals. This is reflected by the overall occupancy rate of the hospitals that were completed in 2011, which is still at about 45-50% after three years of operation.
Valuation
Our target price of Rp17,000/share reflects 42.5x and 30.9x 2015-16 EV/EBITDA with 1.4x EV/EBITDA growth in 2015. This is derived from a DCF methodology with a WACC of 10.8% and a terminal growth rate of 6%. The company currently trades on 34.5x and 25.1x 2015-16 EV/EBITDA with 1.2x EV/EBITDA growth in 2015.
Risks
Below are the key risks for SILO:
Subsidized rental. Given its strategic scheme with LPKR, SILO has been able to obtain a low (1-3%) rental yield, helping it continue its expansion. The agreement is slated to last for 15 years and is extendable for another 15 years. We believe the rate is heavily subsidized by LPKR as the average rental rate paid by LPKR to FIRST REIT for mature hospitals is at c. 18-20% of gross operating revenue.
However, we believe the rental rate is not guaranteed to be extended,
which could impact SILO’s future profitability. Rental now accounts for 3%
of sales and 10% of opex. Every 10% increase in rental costs cuts EBITDA by 2%, ceteris paribus. 14 out of the 18 hospitals are leased from affiliated parties.
Highly dependent upon the parent company’s balance sheet. This is
because 87% of the company’s existing funding comes from a related
-party loan (i.e., from LPKR). We believe the trend will continue going forward as SILO tries to benefit from LPKR’s good access to the debt market and lower cost of funds.
However, we highlight that the relatively slow property market vs. the boom period in 2010 through mid-2013, higher interest rates (albeit starting to come down), and the Central Bank’s tightening type of regulation for the property market have led to rising working capital requirements. Any disruptions in LPKR’s ability to raise financing could result in a delay in SILO’s expansion.
Deutsche Bank AG/Hong Kong Page 29
especially if the company’s expansion guidance of achieving 40
hospitals by 2017 is realized and LPKR has any difficulty in raising further debt financing.
Overpaying for acquisitions. We believe that the company’s plan to reach 40 hospitals by 2017F is difficult to achieve without inorganic acquisitions. This is evidenced by the fact that of the company’s 18 hospitals in operation, about half were acquisitions. Therefore, we highlight the risk of the company overpaying for potential acquisitions.
Overexpansion risk. SILO’s aggressive expansion plan (40 hospitals by 2017F) might lead to an unfavorable financial situation should its expansion generate lower-than-projected returns. This may disrupt SILO’s ability to maintain/expand its operations.
We have tried to take this into account in our forecasts, as we expect the company to reach 40 hospitals only by 2021 and 10k operating beds by 2025. Furthermore, we have assumed a period of six to seven years for the new hospitals to reach a relatively mature stage vs. the company’s guidance of four to five years.
Malpractice lawsuit risk. SILO is currently party to two lawsuits brought by former patients, seeking damages of Rp 226bn.
Affiliated party and conflict of interest risk. There may be conflicts of interest as there are several overlapping directors and commissioners at SILO and other related parties. As such, circumstances may arise
wherein SILO’s management may face conflicts of interests while
fulfilling its fiduciary duties to shareholders. SILO and its controlling shareholders may have overlapping objectives, which could be a disadvantage to the company. Management’s policy is that all affiliated party transactions are to be conducted on an arm’s length basis under standard market terms and conditions.
There is also a risk of SILO acquiring stakes in related party assets/companies (i.e. companies that are also owned by the Lippo Group) at unfavorable prices. Under Indonesian Capital Market regulations, not all affiliated transactions are classified as conflict of interest transactions, and thus they may not necessarily need minority shareholder approval. These transactions may involve conflicts of interest that could be detrimental to minority shareholders. Therefore, failure to manage potential conflicts of interest could negatively affect SILO’s reputation and hence its ability to raise further capital.
SILO’s expansion plans are to a large extent being dictated by the expansion plans of its parent company (LPKR) and strategic partners (First REIT and MPU), which may focus on property development income from new hospitals vis-à-vis the sale of hospitals to its REIT and enhancing the attractiveness of its integrated property development projects, leading to overexpansion and opening hospitals at a far more rapid rate than would be prudent given the current low levels of occupancy. 14 of the 18 hospitals operated are leased from these parties.
Page 30 Deutsche Bank AG/Hong Kong
Valuation
Reasonable valuation given growth
We initiate coverage on SILO with a Buy recommendation and a
Rp17,000/share price target, as we believe that the company’s relatively asset
-light strategy, affiliation with a leading property developer (LPKR), geographical expansion (potentially giving it a first-mover advantage), and relatively good access to capital (via related-party loans from parent company LPKR) should position SILO well to take advantage of Indonesia’s underpenetrated healthcare market.
The company’s valuation on an EV/EBITDA basis appears expensive at 36x and
26x 2015-16 EV/EBITDA vs. ASEAN peers at 21x and 18x in the same period. However, we do believe that the premium valuation is justified, especially given the strong EBITDA growth profile of about 25-27% p.a. over the next five years compared to peers at about 12-13%.
Figure 48: Hospital regional valuation comps
Company name Current price Sales growth (%) EBITDA growth ROE (%) EBITDA Margin (%)
EV/EBITDA EV/EBITDA growth
LCY :14Y :15Y :14Y :15Y :14Y :15Y :14Y :15Y :14Y :15Y :15Y
Raffles Medical 3.8 8.1 11.1 13.2 13.2 13.7 14.2 23.4 23.8 24.1 21.8 0.9 Apollo Hospital 1,148.5 17.9 19.3 14.1 21.0 11.8 12.3 15.3 15.5 24.4 21.7 0.9 IHH Healthcare 4.8 12.4 15.8 17.9 16.1 4.2 4.9 25.2 25.2 22.6 19.4 0.9 KPJ Healthcare 3.9 11.5 13.3 30.0 13.3 10.4 10.5 11.1 11.1 16.9 15.3 0.7 Bangkok Dusit 18.3 11.3 15.4 21.9 17.1 16.8 18.0 22.6 22.9 24.4 20.6 2.8 Bangkok Chain 8.9 14.8 12.0 19.6 16.0 16.1 18.4 28.0 29.0 17.9 15.3 1.1 Bumrungrad Hospital 134.5 8.7 14.0 15.6 16.5 27.0 27.8 28.0 28.6 22.7 19.3 3.7 Ramsay Healthcare 52.8 15.3 42.5 31.6 41.4 20.2 21.6 15.0 14.9 16.8 13.4 1.0 Sonic Healthcare 18.9 12.3 6.9 21.9 6.1 13.1 13.4 18.9 18.8 12.8 11.8 1.5 Average ASEAN 34.1 11.7 14.1 21.0 15.8 14.9 15.9 23.0 23.4 20.9 18.0 1.9 Average Asia-ex China 142.8 12.4 16.7 20.6 17.8 14.8 15.7 20.8 21.1 20.3 17.6 1.5 Phoenix Healthcare 15.2 12.8 18.8 37.1 21.3 11.1 12.4 26.1 26.6 33.0 26.8 0.9 Aier Eye Hospitals 25.7 16.9 25.4 20.1 26.0 16.2 18.2 23.9 24.0 29.9 23.8 1.3 Topchoice Medical 52.0 28.4 28.4 75.1 28.3 18.5 19.4 47.4 47.3 29.7 23.6 1.3 Average China 31.0 19.3 24.2 44.1 25.2 15.3 16.7 32.4 32.6 30.9 24.7 1.1 Envision Healthcare 31.6 17.1 13.9 27.3 20.1 11.2 14.3 12.7 13.4 14.4 11.7 0.8 HCA holdings 66.0 7.7 5.1 14.1 5.3 (28.7) (47.8) 19.8 19.8 8.1 7.5 1.0 Davita Healthcare 76.1 8.0 6.4 15.8 5.9 15.4 16.4 19.0 18.9 10.2 9.4 0.6 Universal Health 98.8 8.9 7.7 8.7 9.8 15.6 16.7 18.4 18.8 9.0 8.0 1.1
Mednax 62.4 13.1 10.3 12.4 8.6 13.2 13.6 22.8 22.5 11.5 10.4 1.0
Tenet Healthcare 48.3 47.6 5.8 58.9 12.2 16.5 30.9 11.7 12.4 8.6 7.5 1.4 Community Health 48.7 45.6 8.5 68.5 11.8 8.3 11.1 15.0 15.5 7.8 6.8 3.7 Healthsouth Corp 39.1 5.1 6.2 1.2 7.4 33.3 18.3 24.7 25.0 8.7 7.9 1.0 Lifepoint Hospitals 65.9 21.9 13.3 28.3 11.3 6.6 7.9 14.2 14.0 8.2 7.0 7.3
Average US 59.7 19.4 8.6 26.1 10.3 10.1 9.0 17.6 17.8 9.6 8.5 2.0
Average 96.4 16.4 14.3 26.3 15.6 12.9 13.0 21.1 21.3 17.2 14.7 1.7 Sarana Meditama (SAME) 2765 20.3 22.7 21.5 22.9 36.5 23.8 30.0 30.1 27.8 23.1 1.8
Siloam Int (SILO) 14425 25.7 25.7 37.2 21.5 4.1 6.1 12.1 11.9 36.0 26.1 1.2
Deutsche Bank AG/Hong Kong Page 31 Our target price of Rp17,000/share implies 42.5x and 30.9x EV/EBITDA
2015-16E with 1.5x EV/EBITDA growth in 2015. While this represents a big premium vs. regional peers on EV/EBITDA multiples, we believe it is roughly in line after
adjusting for SILO’s much stronger EBITDA growth profile.
We believe several catalysts could warrant an upward re-rating for the stock, including 1) brownfield expansion in existing mature hospitals and ramp-up of new hospitals, which should lead to 22-24% p.a. growth in the number of outpatient and inpatients, 2) EBITDA margin expansion from the current 13% (gross) to 16% in five years, and 3) strong execution of the expansion strategy (we expect the company to grow the number of hospitals from 18 currently to 40 by 2021, which is more conservative than the company’s guidance of 2017).
SILO
–
DCF valuation (Rp17,000/share)
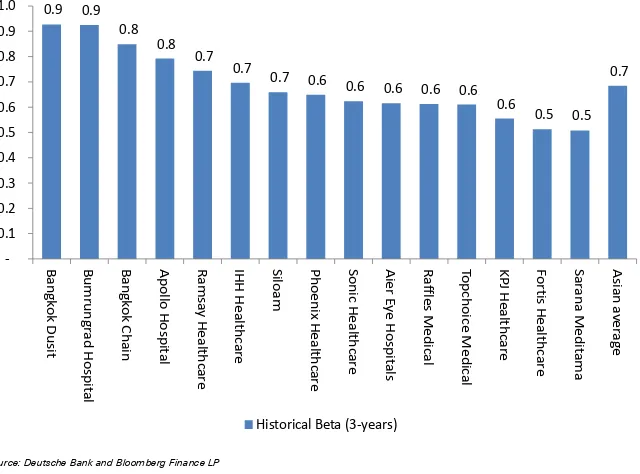
Based on our DCF methodology, we arrive at a valuation of Rp17,000/share. This is based on our weighted average cost of capital (WACC) of 10.8%, which we derive using a risk-free rate of 7%, a market risk premium of 7.5%, and a beta of 0.7x (to reflect the less cyclical nature of the business as well as the underpenetration of the Indonesian healthcare market). We have assumed the
company’s long-term number of hospitals at 40, with close to 10k operating
beds, and 6% terminal value, reflecting long-term Indonesian inflation.
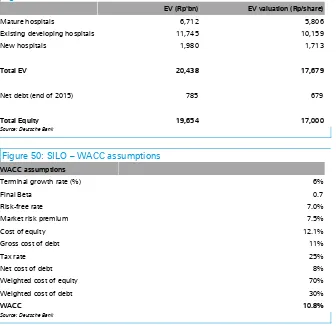
Figure 49: SILO – DCF valuation
EV (Rp'bn) EV valuation (Rp/share)
Mature hospitals 6,712 5,806
Existing developing hospitals 11,745 10,159
New hospitals 1,980 1,713
Total EV 20,438 17,679
Net debt (end of 2015) 785 679
Total Equity 19,654 17,000
Source: Deutsche Bank
Figure 50: SILO – WACC assumptions
WACC assumptions
Terminal growth rate (%) 6%
Final Beta 0.7
Risk-free rate 7.0%
Market risk premium 7.5%
Cost of equity 12.1%
Gross cost of debt 11%
Tax rate 25%
Net cost of debt 8%
Weighted cost of equity 70%
Weighted cost of debt 30%
WACC 10.8%
Page 32 Deutsche Bank AG/Hong Kong
Figure 51: Lower beta reflects stable hospital operation
0.9 0.9
Source: Deutsche Bank and Bloomberg Finance LP
While we believe a DCF-based methodology is appropriate to derive the
company’s fair value due to its many developing hospitals (14 out 18), which
takes years to mature, we acknowledge that this is sensitive to our long-term growth and WACC assumptions. We therefore provide a sensitivity analysis:
WACC sensitivity. Every one percentage point change in our WACC assumptions would result in a 25-39% change in our DCF valuation. The sensitivity appears very big, given a lot of value is attributed to the company’s future expansion and the fact that it takes at least five years to reach mature stage.
Figure 52: SILO – WACC sensitivity
WACC sensitivity -2% 1% Base case (10.8%) +1% +2%
DCF TP 35,209 23,641 17,000 12,735 9,792
Implied 2015 EV/EBITDA 87.9 59.0 42.5 31.8 24.5
Implied 2016 EV/EBITDA 63.9 42.9 30.9 23.1 17.7
Implied 2015 EV/EBITDA growth 3.0 2.0 1.4 1.1 0.8
Source: Deutsche Bank
Long-term growth assumptions. We base our terminal growth on the
Deutsche Bank AG/Hong Kong Page 33
Figure 53: SILO – Long-term growth sensitivity
Long Term Growth sensitivity -2% 1% Base case (6%) +1% +2%
DCF TP 11,616 13,844 17,000 21,816 30,063 Implied 2015 EV/EBITDA 29.0 34.6 42.5 54.5 75.1 Implied 2016 EV/EBITDA 21.1 25.1 30.9 39.6 54.6 Implied 2015 EV/EBITDA growth 1.0 1.1 1.4 1.9 2.6
Source: Deutsche Bank
Furthermore, our DCF-based target price assumes that the lease contracts from LPKR, FIRST REIT, MPU, and other parties are extended beyond the existing 15-year contract without any change in the rental rate structure. Therefore, we highlight the risks of non-extension or higher rental rates, which
would affect the company’s longer-term profitability (especially as we believe
the current maximum rental rate of 3% of gross operating revenue appears very low vs. what FIRST REIT is charging LPKR for the building rental).
SILO’s implied valuation at current and target price
In Figure 54, we show the implied EV/EBITDA and EV/EBITDA growth at the current price and target price. We also understand that the company is paying rent to the parent company, MPU, and FIRST REIT; therefore, we also present the implied EV/EBITDAR valuation.
Figure 54: SILO – Implied valuation
At price target
Rp17,000/shr
At current price Rp14,300/shr
EV/EBITDA (2015) 42.5 36.0
EV/EBITDA (2016) 30.9 26.1
EV/EBITDA (2017) 24.0 20.3
EV/EBITDAR (2015) 34.2 29.0
EV/EBITDAR (2016) 25.6 21.7
EV/EBITDAR (2017) 20.0 17.0
EV/EBITDA growth 2015 1.4 1.2
EV/EBITDA growth 2016 1.3 1.1
EV/EBITDA growth 2017 1.1 0.9
Source: Deutsche Bank
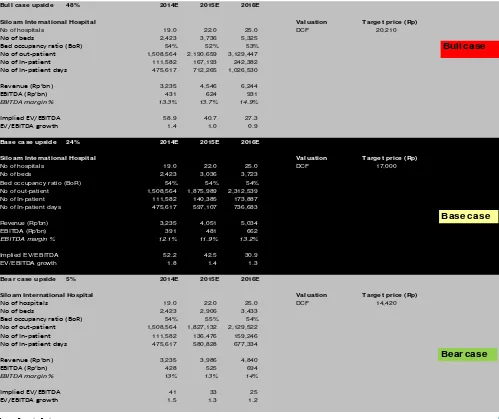
Bull, base, and bear case DCF scenarios
We have built relatively more conservative assumptions in our forecast vs. the company’s guidance. We therefore believe that, should the company be able to pull through the expansion and occupancy ramp-up according to its guidance, we see 19% potential upside to our target price (which we reflect in our bull-case scenario). Our underlying assumptions in different scenarios are as follows:
Page 34 Deutsche Bank AG/Hong Kong this leads overall EBITDA margin (gross) to grow from 13% currently
to 19% by 2020.
Base case (Rp17,000/share). This is our current assumption, in which we assume the company will reach 40 hospitals only by 2021 and 10k beds by 2024. We have assumed that it takes six to seven years for the new hospitals to reach maturity. Furthermore, we assume only 6% pricing growth p.a. (roughly in line with inflation), taking into account the fact that the new hospitals are located in 2nd- and 3rd-tier cities (which we assume have a slower occupancy ramp-up). This should lead overall EBITDA margin (gross) to grow from 13% currently to 16% by 2020.
Deutsche Bank AG/Hong Kong Page 35
Figure 55: SILO – Bull, base, and bear case scenario analysis
Bull case upside 48% 2014E 2015E 2016E
Siloam International Hospital Valuation Target price (Rp)
No of hospitals 19.0 22.0 25.0 DCF 20,210
No of beds 2,423 3,736 5,325
Bed occupancy ratio (BoR) 54% 52% 53%
No of out-patient 1,508,564 2,190,659 3,129,447
No of In-patient 111,582 167,193 242,382
No of In-patient days 475,617 712,265 1,026,530
Revenue (Rp'bn) 3,235 4,546 6,244
EBITDA (Rp'bn) 431 624 931
EBITDA margin % 13.3% 13.7% 14.9%
Implied EV/EBITDA 58.9 40.7 27.3
EV/EBITDA growth 1.4 1.0 0.9
Base case upside 24% 2014E 2015E 2016E
Siloam International Hospital Valuation Target price (Rp)
No of hospitals 19.0 22.0 25.0 DCF 17,000 No of beds 2,423 3,036 3,723
Bed occupancy ratio (BoR) 54% 54% 54%
No of out-patient 1,508,564 1,875,989 2,312,539 No of In-patient 111,582 140,385 173,887 No of In-patient days 475,617 597,107 736,683
Revenue (Rp'bn) 3,235 4,051 5,034 EBITDA (Rp'bn) 391 481 662
EBITDA margin % 12.1% 11.9% 13.2%
Implied EV/EBITDA 52.2 42.5 30.9 EV/EBITDA growth 1.8 1.4 1.3
Bear case upside 5% 2014E 2015E 2016E
Siloam International Hospital Valuation Target price (Rp)
No of hospitals 19.0 22.0 25.0 DCF 14,420
No of beds 2,423 2,906 3,433
Bed occupancy ratio (BoR) 54% 55% 54%
No of out-patient 1,508,564 1,827,132 2,129,522
No of In-patient 111,582 136,476 159,246
No of In-patient days 475,617 580,828 677,334
Revenue (Rp'bn) 3,235 3,986 4,840
EBITDA (Rp'bn) 428 525 694
EBITDA margin % 13% 13% 14%
Implied EV/EBITDA 41 33 25
EV/EBITDA growth 1.5 1.3 1.2
Bull case
Bear case Base case