The impact of logging residue on soil GHG fluxes in a drained peatland
forest
Päivi Mäkiranta 1,2*, Raija Laiho 1, Timo Penttilä 2, Kari Minkkinen 1
1)
Department of Forest Sciences, P.O.Box 27, FIN-00014, University of Helsinki, Finland. Email:
2)
Finnish Forest Research Institute, Jokiniemenkuja 1 01370 Vantaa, Finland.
*corresponding author, tel. +358-50-3001776, fax. +358-9-19158100, email: [email protected]
Abstract
Northern peatlands contain substantial reservoirs of carbon (C). Forestry activities endanger the C storages in some of these areas. While the initial impacts of forestry drainage on peatland
greenhouse gas (GHG) balance have been studied, the impacts of other silvicultural practices, e.g. logging residue (LR) retention or removal, are not known. We measured the CH4, N2O and CO2
fluxes between peat soil and atmosphere with and without decomposing LR over three (2002-2004) seasons (May-Oct) following clearfelling in a drained peatland forest, along with the mass loss of LR. Seasonal average CO2 efflux from plots with LR (3070 g CO2 m–2 season–1) was twice as high
as that from plots without LR (1447 g CO2 m–2 season–1). Less than 40 % of this difference was
accounted for by the decay of logging residues (530 g CO2 m–2 season–1), so the majority of the
increased CO2 efflux was caused by increased soil organic matter decomposition under the LR.
Furthermore LR increased soil N2O fluxes over 3-fold (seasonal average 0.70 g m-2), compared to
plots without LR (0.19 g m-2), while no change in CH4 emissions was observed. Our results indicate
that LR retention in clearfelled peatland sites may significantly increase GHG emissions and C release from the soil organic matter C storage. This would make the harvesting of LR for biofuel more beneficial, in the form of avoided emissions. Further investigations of the sources of CO2
under logging residues are, however, needed to confirm this finding.
Keywords: Drained peatland, clearfelling, logging residue, GHG, N2O, soil respiration,
heterotrophic respiration, priming
1. Introduction
Northern peatlands contain substantial reservoirs of carbon (C) and nitrogen (N) in their peat soil and are therefore important in the global C and N cycles (Gorham, 1991; Khalil, 1999; Turunen et al., 2002). Accumulation of organic matter (OM) is due to high water table level and associated anoxia, which cause accumulation of partially decomposed OM as peat. In these anoxic conditions decomposition is slow and results in the formation and release of methane (CH4) to the atmosphere.
Drainage of these wet soils has been commonly used to stimulate the productivity of the peatland forest in many northern countries (Paavilainen and Päivänen, 1995). Within these countries drained peatland forests have become a large land use category, where also forest management practises are carried out with ever growing intensity (Tomppo and Hentonen, 1996). Knowledge on the effects of management practises such as clearfellings on greenhouse gas (GHG) fluxes in drained peatland forests is still very limited (Nieminen, 1998; Huttunen et al., 2003; Saari, 2009; Mäkiranta et al., 2010). For example, the impacts of logging residue (LR) on soil GHG effluxes are still unknown. To our knowledge the decomposition rate of LR and the effects of LR on soil CO2, CH4 and N2O
fluxes on peatlands have not been estimated previously. Better understanding of the effects of management practices on site GHG fluxes ensures that the most sustainable practices can be selected and the greenhouse impact of forestry activities can be minimized.
Clearfelling is a common practice used for timber harvesting worldwide. Traditional clearfelling in Finland involves cutting all trees, removing commercial stem wood and leaving logging residues on the site. Lately, the increasing demand for production of bioenergy has led to a new forest
management practice, in which also LR is harvested. The greenhouse impact of LR removal and energy use is usually determined from the life cycle perspective (e.g. Savolainen et al., 1994; Kirkinen et al., 2008). In such analyses it has been commonly assumed that the decomposition of LR at a forest site is an emission source equal to that of burning the LR. Recently, it has been suggested that the decomposition rate of LR left in the site could be much smaller than anticipated earlier, resulting that LR forms a slowly decomposing C stock at the harvest site (Repo et al., 2011). This would make LR burning for energy a less favourable option. Decomposition rates of LR have, however, been little studied, and there are no empirical studies for example on the effects of
climatic conditions on their decomposition rates. Furthermore, present studies have not considered the possible effects of LR on soil GHG effluxes.
When left on site LR alters soil moisture and temperature conditions (Roberts et al., 2005), both of which are major drivers of soil OM decomposition (Lloyd and Taylor, 1994; Davidson et al., 1998). Furthermore, LR may provide soil microbes with additional nutrients and energy in the form of fresh OM. This may increase microbial activity under the logging residue piles (Fontaine et al., 2004, 2007) and, consequently, show up as increased rate of peat decomposition. The changes in substrate supply and soil conditions may further result in a release of extra nitrogen (N) as nitrate (NO3-) in soil solution. In poorly aerated peat soils, especially, this fertilisation with nitrate may lead to increased N2O effluxes through nitrification-denitrification cycles.
We measured CO2, N2O and CH4, fluxes on peat soil with and without decomposing LR, and the
mass loss of LR, after clearfelling in a drained peatland forest. Our aim was to quantify both the initial post harvest C loss from LR and the effect of LR on soil GHG effluxes. We hypothesised that (1) LR would decompose faster in a southern site with higher temperature sum compared to that of a northern site, (2) LR would affect soil organic matter decomposition rate, i.e., the effect of LR on CO2 effluxes would be different than that estimated based on the mass loss rate of LR alone (3) the
flux of N2O from plots with LR would be higher than without them and (4) LR would not affect
2. Materials and methods
2.1 Site and tree stand
The study site was located in a drained peatland forest in Padasjoki, Vesijako Research Forest, south-boreal Finland (61º 22´ N, 25º 07´ E). The peatland studied was originally a treed mire with an ombrotrophic centre and a minerotrophic lagg. The site was first drained by ditching in 1915 and ditch maintenance operations were carried out in 1933 and 1954. On average, the site represents oligotrophic nutrient status as indicated by the vegetation and the level of total N in surface peat (Table 1). Peat depth in the area varied from 100 to over 300 cm. The tree stand present prior to the clearfelling had evolved through seed tree cutting in 1945–1950. It consisted mostly of Scots pine (Pinus sylvestris; 81% of volume) with admixtures of Norway spruce (Picea abies; 10%) and downy birch (Betula pubescens; 9%). In winter 2001–2002 an area of approximately 0.5 ha was clearfelled, in the middle of the peatland.
The tree stand was measured in the autumn of 2001 prior to clearfelling, and tree species and DBH (diameter at 1.3m height, mm) were recorded for all trees and tree height for sample trees that were selected to represent the entire range of DBH distribution, by tree species. The stem volumes and other stand parameters were then computed based on the tree volume functions by Laasasenaho (1982). Total tree stand biomass, and its distribution into stem wood (commercial and
non-commercial) and stumps, branches (all including bark), foliage, and coarse roots were obtained by applying Marklund's (1988) tree-wise biomass functions, based on tree DBH and height, to the tree data. The biomass of branches, stumps and coarse roots for birch were estimated by applying the functions for pine. The tree stand biomass was dominated by stem biomass (64%) while coarse roots (16%), stumps (6%), branches (11%), and foliage (3%) each contained lesser proportions (Table 2). Above ground logging residues (branches, foliage and non-merchantable stem tops (4% of total) thus contained 18% of the total tree stand biomass (Table 2).
To test the impact of climate on LR decomposition, the LR mass loss experiment was also carried out at a more northern clearfelled site in Kivalo Research forest (66°21' N, 26°37'E, 180 m.asl.). The site was originally a treed minerotrophic fen. It was first drained in 1933 and is now classified as Vaccinium myrtillus type forest, thus showing a slightly higher nutrient status than the Vesijako site. The peat layer is thin, 30–90 cm. For a closer description of the site, see Minkkinen et al. (2007). Climatic conditions for Vesijako and Kivalo sites are given in table 3.
2.2 Logging residue decomposition experiment
The decomposition rate of LR following clearfelling was estimated using the litter bag method. Ten sets of large mesh bags containing either one entire branch or tree top with intact needles (average dry mass of 1350g), were buried in 10 different logging residue piles in May 2002 in both sites. The dry mass contents were determined from an extra set of sample branches and tree tops that were weighed for fresh mass in the field and oven dried until constant mass in laboratory. The average dry mass content by site, separately for branches and tree tops, was applied to estimate the initial dry mass for each sample branch or tree top. The mesh size of the nylon bags was 1 mm x 1 mm to allow small mesofauna, typical of the sites (Silvan et al., 2000), to enter the bags.
LR mass loss was measured from subsets of bags recovered approximately 0.5, 1, 2, 4 and 6 years after the beginning of the experiment (Fig. 1). The mass loss was expected to be caused mainly by microbial degradation of logging residues and consequent CO2 efflux from microbial respiration,
but to some extent also by leaching of DOC and release of small OM particles from logging
Two types of decay functions were tested to the litter bag data. The exponential decay function (Olson, 1963), which is widely used to calculate the decomposition rate constants for litter decomposition, poorly fitted to our data. Instead, the asymptotic function (Eq. 1), also used by Latter et al.( 1998) to describe the long term course of litter decomposition, showed a better fit and was used for estimating LR decomposition over time.
t BR A
Mt (1)
In Equation 1, Mt (%) is the mass remaining at time t, A is the asymptote of the curve, R is the rate of decomposition, B is regression coefficient and t is time in years.
2.3 GHG efflux measurements 2.3.1 Plots without logging residues
To study the soil GHG effluxes a systematic grid of 15 gas sampling subsites was established in Vesijako site June 2001, a year before the actual measurements took place (Mäkiranta et al., 2010). The soil respiration measurement plots in surfaces without LR were prepared to differentiate the soil respiration components. Thus, in each subsite, three plots were established, to represent 1) heterotrophic peat soil respiration (RPEAT), 2) heterotrophic peat soil respiration and root-derived
respiration (RPEAT+ROOT) and 3) total soil respiration including heterotrophic respiration from peat
and aboveground litter along with root-derived respiration (RTOT). The RTOT plots were first
established on 3 subsites and later (year 2004) on each subsite. Altogether, measurements were thus done in 45 plots.
Aboveground parts of the ground vegetation were removed from all plots, and they were kept free of vegetation by regular clippings. From the RPEAT and RPEAT+ROOT plots all newly deposited litter
was removed and litter nets served to prevent further accumulation of litter. One year prior to the start of GHG measurements the RPEAT plots were trenched to exclude root derived respiration. As
most of the roots in drained peatlands are situated in the topmost peat layers (Laiho and Finér, 1996), we assumed that by trenching to 30 cm depth and removing aboveground parts of GV, root respiration and regrowth of new roots into the RPEAT plots could be eliminated.
Soil CO2 efflux was measured using a closed-chamber system with air circulating in a loop between
the chamber and an external infrared gas analyser (EGM-4 CO2 analyser + modified SRC-1 soil
respiration chamber (NSF-11, Pumpanen et al., 2004), PP-Systems Ltd.) equipped with a water vapour equilibrator. A metallic chamber (diameter 31.5 cm, height 16.9 cm) equipped with a fan was placed on the sample plot for a measurement period of 81 seconds. At the plots with litter nets the net was removed prior to measurement. The analyser automatically monitors CO2 concentration
increase within the chamber headspace at 1.6-second intervals and calculates an average every 4.8-seconds. Soil CO2 efflux is thus based on the linear increase of CO2 concentration in the chamber
headspace over time. The efflux was corrected for atmospheric pressure and air temperature. The weekly measurements lasted from June 2002 through September 2004 (Fig. 2). Only the
measurements during periods free of ground frost were included in the analyses.
Methane (CH4) and nitrous oxide (N2O) fluxes were measured using static vented chambers, from
undisturbed, vegetated sample plots situated in every other subsite (total of 8 plots) in the clearfelled area. Round aluminium collars with a diameter of 31.5 cm were used to delimit the permanent sample plots. A 30 cm high metallic chamber (V=23.3 dm3) was placed on the collar for an incubation period of 35 minutes. Gas samples were drawn to syringes from the chamber in 5, 15, 25 and 35 minutes after chamber closure.
flame ionisation (for CH4) and electron capture (for N2O) detectors. Samples were manually
injected to the GC through a 2 ml loop. Helium was used as the carrier gas. The GC was equipped with a 1.8 m 1/8 inch Hayesep Q column (mesh size 80/100), self-packed with 75cc phase. Oven temperature was 50 °C during the runs, and risen to 120 °C between sample series to remove
moisture from the columns. After the column, the gas flow was divided with a splitter and led to the detectors with 5 m 1/8 inch pre-columns.
Fluxes were calculated from the linear change of the gas concentration in time (estimated by linear regression). All data were used, regardless of goodness of fit of the regression. Because of good drainage at the site, no ebullition events were observed, so the data represents diffusive or plant mediated gas flux. The fluxes of CH4 and N2O were measured every 2–3 weeks from May 2002 to
September 2004 (Fig. 2).
The detection limit (bottomline noise × 5) of the GC was 0.01 ppm for N2O and 0.22 ppm for CH4.
The detection limits for fluxes were estimated as follows: A random sample of gas concentration 4-set (n=500*4) was generated based on random variation of 10 measured standard samples. Fluxes were calculated from these 4-sets and the 95% confidence interval of the fluxes indicate the detection limits, ±0.5 mg CH4 m-2 d-1 and ±0.03 mg N2O m-2 d-1. However, before 2003 the
accuracy of N2O analysis was very poor, due to various problems with the GC. Therefore all N2O
data before 2003 were deleted from further analyses.
2.3.2 Plots with logging residues
To determine the GHG fluxes from logging residue piles (RTOT+LR), sample plots with fresh logging
residue (LR) placed on top of the soil surface were established in every other gas sampling subsite; this resulted in a total of seven RTOT+LR plots. An aluminium collar of 56×56 cm was permanently
inserted to a depth of 15 cm to properly seal the collar with the soil. Aboveground parts of the vascular plants were removed from the plots, and they were kept free of vascular vegetation by regular clippings. Mosses were not removed. In the spring 2002 known mass of fresh LR containing both branches and needles was added into the RTOT+LR plots on top of the moss surface. The dry
mass of this LR inside the plots was calculated based on samples collected at the same time. These additional samples were weighed for fresh mass in the field and oven dried until they had constant mass in laboratory. The calculated average LR dry mass addition was 1270+81g per plot which equals to 4050 g LR dry mass per m2.
For the CO2 efflux measurements a metallic chamber (60 × 60 × 31 cm) equipped with a
battery-operated fan and a portable infra-red gas analyzer (EGM-2, 3 and 4, PP Systems, UK) was used. To ensure an air-tight sealing of the measurement system the chamber was placed on the water groove on top of the collar. Each measurement lasted 90 to 180 seconds and CO2 concentration in the
chamber headspace and chamber headspace temperature was recorded at 15-second intervals. CO2
efflux was then calculated from the linear increase of CO2 concentration in the chamber headspace
over time. The efflux was corrected for atmospheric pressure and air temperature. The CO2 efflux
measurements were done biweekly during the snow free seasons from June 2002 through September 2004 (Fig. 2).
CH4 and N2O samples were taken from RTOT+LR plots using the same chambers as for CO2.
2.4 Soil temperature and water level depth (WL)
During every measurement event, soil temperature at 5 cm below ground and water level depth (WL, cm from soil surface; from perforated tubes) were measured next to each plot. These manual measurements were used to formulate the relationship between environmental variables and CO2
efflux.
Continuous (2-hour intervals) soil temperature data at 5 cm depth was obtained since May 2002 with temperature sensors (BetaTherm 2K3A1, BetaTherm Sensors, Ireland) wired to a data logger (Campbell CR10X, Campbell Scientific, Inc., USA). Soil temperature data was linearly interpolated to obtain hourly values. Gaps in soil temperatures, due to some failures in data logging, were filled using linear regressions between the soil temperatures on the study site and a similar near-by stand. In the rare cases when such data were not available, gap filling was done using air temperature data from the nearest weather station (Finnish Meteorological Institute, Lammi Iso-Evo) and regressions between air and soil temperatures from the study site. For continuous WL data, the WL
measurements from all gas sampling subsites at each measurement event were averaged and missing values between the measurements were filled using linear interpolation. These datasets were then used in simulations of the seasonal CO2 effluxes (Fig. 2).
2.5 Calculations 2.5.1 CO2 effluxes
We constructed nonlinear regression models to reconstruct the continuous CO2 effluxes separately
for each soil respiration treatment plot (RPEAT, RPEAT+ROOT, RTOT) and for RTOT+LR. Modeling was
performed using SYSTAT 10 software package.
The modelling of CO2 effluxes follows the logic that the main drivers that determine respiration in
peatlands are soil temperature (TS) and water level depth (WL). Mäkiranta et al. (2008) proposed
that an Arrhennius type of function by Lloyd and Taylor (1994) best described the temperature dependence of respiration in drained peatlands, thus it was used. Water level was added to the temperature function as a scalar dependent to describe the linear effect of water level on CO2
effluxes.
depicting the temperature sensitivity of respiration, Tref is a reference temperature, set at 10 °C, T0 is
the temperature minimum at which respiration ends, set at –46.02 °C (Lloyd and Taylor, 1994). TS
is the soil temperature (°C) at 5 cm depth measured at the plot concurrently with the CO2 efflux
measurements. WL is the water level depth from the peat surface (m) measured concurrently with CO2 efflux measurements and parameter c describes the change in CO2 efflux related to changes in
WL independently of temperature.
Some interannual variation in CO2 effluxes remained unidentified, and thus to estimate unbiased
effluxes for each year the model parameterization was done for each year separately. In addition to that, some spatial variation (between plots),which could have been caused by uneven size
distribution of added residuals in the replicates, remained in RTOT+LR. When RTOT+LR plots were
Simulations were carried out with an hourly time step to reconstruct the diurnal cycles of CO2
fluxes within the simulation periods during years 2002–2004. The continuous T and WL data was used as driving variables. Estimates of summer season (May –Oct) CO2 effluxes for each year were
calculated by summing up the simulated hourly values.
The CO2 efflux from logging residue decomposition (RLR) inside the RTOT_LR collars was estimated
by using the dry mass of the LR in the RTOT+LR plots and seasonal (May-Oct) LR mass loss rates
calculated by using the asymptotic curve (Eq. 1) fitted to the Vesijako data (Fig. 1, Table 5). These seasonal LR mass loss estimates were converted to CO2 efflux by assuming that 50% of the dry
mass loss was CO2-C as follows,
RLR = LR mass loss * 0.50* 3.664 (3)
For estimating the proportions of the different respiration components (aboveground litter respiration (RLITTER) and root respiraton (RROOT)), the seasonal (May –Oct) CO2 effluxes were
calculated using simulated, treatment-specific CO2 effluxes as follows,
ROOT PEAT TOT
LITTER R R
R (4)
PEAT ROOT
PEAT
ROOT R R
R (5)
2.5.2 CH4 and N2O fluxes
Variation in of CH4 and N2O fluxes did not correlate with any environmental variables. Therefore
the seasonal N2O and CH4 fluxes were integrated from the data of momentary fluxes after linear
interpolation of subsequent observations. Annual fluxes were calculated for year 2003, when fluxes were also measured during the winter (Fig. 2).
3. Results
3.1. Decomposition of logging residue
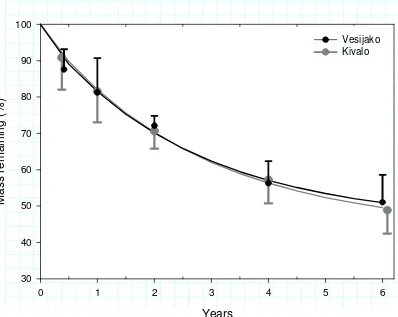
Against our first hypothesis, no statistically significant differences in decomposition rates of logging residue (LR) were found between the Vesijako and Kivalo sites despite their climatic differences (Fig. 1, Table 3). On both sites approximately half of the LR mass was lost during the six-year incubation period (Fig. 1). During the first four years, decomposition proceeded rapidly, after which a clear decline was observed in the decomposition rate on both sites (Fig. 1).
3.2. CO2 effluxes
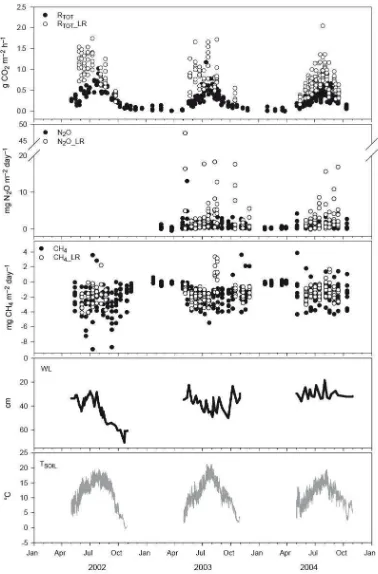
Logging residue increased total soil respiration remarkably (Fig. 2). The measured instantaneous CO2 effluxes on plots with LR (RTOT+LR) were more than doubled compared to that of the plots
without LR (RTOT) (Fig. 2). The simulated seasonal (May-Oct) soil respiration from RTOT+LR plots
was approximately twice as high as that from RTOT plots (Table 6). Less than 40% of this difference
was accounted for by the decomposition of LR (RLR) (Table 6). This supports our second
hypothesis: LR affected soil organic matter decomposition under the logging residues.
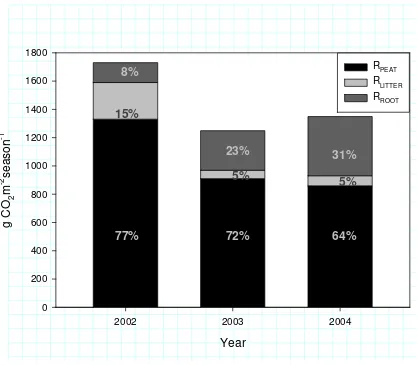
Major part of the total soil respiration (RTOT) originated from the heterotrophic peat soil respiration
(RPEAT) (Fig. 3). The quantity of seasonal RPEAT strongly decreased during the first two study years,
probably because of the decrease in the most easily decomposable material, i.e. the newest above and below ground litter, in the plot. Proportion of RLITTER from RTOT was low and declined during
clearfelling (Fig. 3). Regeneration of ground vegetation increased RROOT, from year to year,
resulting that during the third year following clearfelling RROOT contributed 30% of the RTOT (Fig.
3).
3.3 N2O and CH4 effluxes
Logging residue increased N2O fluxes over 3-fold, compared to plots without LR. Temporal
variation in N2O emissions was great throughout the measurement period. There was a very distinct
peak in N2O emissions in the beginning of May, 2003, both in LR and non-LR plots. This was a
time when air and soil temperatures were in a rapid rise after winter (Fig. 2).
Seasonal (May-Oct) N2O emissions in LR plots were 0.81 g m-2 in 2003 and 0.58 g m-2 in 2004
while in plots without residues they were 0.21 g m-2 and 0.17 g m-2, respectively. Annual fluxes for year 2003 from non-LR plots were 0.28 g m-2, while from LR plots the emissions were 1.57 g m-2, i.e. over five times higher. The distinct difference between the treatments supports our third hypothesis; LR increased soil N2O emissions.
The clearfelled site was a sink for atmospheric methane. Plots without LR remained methane sinks throughout the study period, whereas in plots with LR small emissions were detected twice in August 2003 (Fig. 2). Integrated (MayOct) seasonal fluxes without LR varied between years from -0.29 to -0.46 g CH4 m-2, and with LR from -0.20 to -0.36 g CH4 m-2. Thus, on average, seasonal
(May-Oct) methane consumption was a bit smaller under LR, but this difference was not statistically significant. Annual flux estimate for year 2003 was -0.43 g CH4 m-2 a-1 for both
treatments.
4. Discussion
We found that in the first three years following clearfelling, logging residue (LR) promoted soil organic matter decomposition in a forestry drained peatland. The CO2 efflux from plots with LR
was higher than the sum of CO2 efflux from LR-free plots and CO2 efflux from LR mass loss,
estimated independently. Furthermore, LR caused over 3-fold increase in N2O fluxes. Our findings
indicate that LR significantly increases post harvest soil GHG effluxes in peatland sites. These impacts have important implications when the GHG impacts of logging residue retention on-site and removal from the site for energy use are compared.
4.1 Logging residue decomposition rate
4.2 Effect of logging residues on soil CO2 effluxes
There are many possible reasons for the increased soil CO2 efflux under the logging residue.
Retention of logging residues alters the soil environmental conditions by conserving soil moisture (Smethurst and Nambiar, 1990; Roberts et al., 2005) and by lowering soil temperature (Roberts et al., 2005). If not covered with LR, surface soil is exposed to direct solar radiation and extreme temperatures following clearfelling (Londo et al., 1999). This results in drying of the soil surface which may restrict peat decomposition (Mäkiranta et al., 2010). Similar increase in soil respiration on plots with logging residue has been demonstrated in mineral soil conditions by Edwards and Ross-Todd (1983).
Increased CO2 efflux from plots with logging residue (LR) may also be due to priming effect, i.e.,
the decomposition of peat underlying LR could be enhanced by the input of fresh organic matter and/or DOC from the LR. Laboratory studies have recently demonstrated the existence and importance of priming in soil organic matter decomposition (Fontaine et al., 2004, 2007). This priming effect seems to be especially relevant if old soil organic matter, which itself consists of recalcitrant compounds with low energy content, is exposed to excessive amounts of fresh organic matter (Fontaine et al., 2004). This is because, in the natural state, energy from old recalcitrant compounds cannot sustain microbial activity. Delivery of fresh organic matter can provide microbes with a source of energy that enables them to decompose these recalcitrant compounds with their enzymes.
In drained peatland sites the peat has accumulated over the millennia of peatland formation. After drainage and many years of exposition to aeration surface peat can be rather resistant to further decomposition as the readily utilizable substrate hasalready been consumed (Bridgham and
Richardson, 1992; Hogg et al., 1992). Correspondingly, in aged drained peatland sites, water level fluctuations, which directly regulate the volume of the oxic peat layer (Lähde, 1969; Silins and Rothwell, 1999) and should thus control the OM decomposition rate, have only a minor effect on soil respiration rates (Minkkinen et al., 2007; Mäkiranta et al., 2008). The high respiration rates that we measured from the plots with LR, however, indicate that this inactivity in decomposition is not irreversible; fresh organic matter may promote decomposition in this otherwise resistant C pool. It could be argued that part of the high CO2 efflux from RTOT+LR plots could be due to the increased
decomposition of mosses in RTOT+LR plots compared to that of the RTOT plots, as in RTOT+LR plots
mosses were left intact whereas in RTOT plots mosses were removed. When covered by the LR the
majority of mosses died. For estimating the magnitude of this potential supplement to the CO2
efflux rate, caused by moss decomposition, we determined the dry mass of the moss layer (140 g m
-2
) from samples collected from the uncut forest next to the study site (control site, Mäkiranta et al., 2010) and calculated the moss decomposition rates using the results of Laiho et al. (2008) from a similar site. This estimation indicated that mosses could only have increased RTOT+LR effluxes by
ca.30 g CO2 m-2 season-1,thus, they would not alone explain the high efflux from RTOT+LR plots.
Alternatively it could be argued that the high observed CO2 emissions in RTOT+LR plots could have
been caused by altered RLITTER or RROOT in RTOT+LR plots. Our results, however, showed that after
clearfelling soil respiration was dominated by the heterotrophic peat soil respiration (RPEAT). The
overall proportion of RROOT from RTOT was low and even thought it increased during the
measurement period this increase was mainly due to recovery of ground vegetation (Mäkiranta et al., 2010), which has most of its roots in 0-20 cm peat layer (Murphy et al., 2009). Thus, the 15 cm collar in RTOT+LR plots most probably restricted root regrowth to RTOT+LR plots and therefore it is
likely that the high CO2 emissions from RTOT+LR plots could not be caused by increased RROOT.
The proportion of heterotrophic respiration from the decomposition of fresh above ground litter (RLITTER) was small and declined during the measurement period as the aboveground tree litter input
that the high CO2 emissions in the RTOT+LR plots could not be caused by increased rates of RLITTER
alone, but that such a high increase in CO2 emissions in RTOT+LR plots required increased rates of
RPEAT, as well.
It is in principle possible that LR in the CO2 sample plots and inside the mesh bags decomposed at
different rates. The bags were in heaps that were higher than those inside the gas measurement collars. This may lead to differences in moisture conditions and microbial community
compositions; however, it is unlikely that such differences would have been so major as to significantly affect our results.
Finally, whether the reason for the increased CO2 emissions from the RTOT+LR plots was favourable
moisture conditions, priming, decomposition of dying mosses, or all these factors together, we conclude that the effect of logging residues on the CO2 effluxes was much higher than the results of
the LR decomposition experiment would have suggested. This indicates that logging residue retention increased CO2 evolution from the site. Furthermore our results suggest that LR retention
increased especially the decomposition of soil organic matter, i.e. peat (RPEAT). A previous study
from the same site showed only minor changes in RPEAT following clearfelling (Mäkiranta et al.,
2010). Together with the discussion in this study the results suggest that the effect of clearfelling on peat C storage strongly depends on whether the LR is left on the site or removed.
4.2 Effect of logging residue on N2O and CH4 emissions
N2O emissions were much higher under LR than without LR, suggesting that increased release of N
to the peat soil because of logging residues enhanced N2O production in the soil. N2O is formed in
soils mainly by two pathways: from nitrification of ammonium (NH4+) to nitrate (NO3-) and from
denitrification of NO3- to molecular nitrogen (N2). N availability is one of the main factors affecting
the rates of nitrification and denitrification, and thereby N2O production in soil (Firestone and
Davidson, 1989). Although peat soils are naturally N-rich soils, N in peat is largely bound in organic compounds, while N2O production requires inorganic nitrogen. Thus N2O emissions from
nutrient-poor forestry drained peatlands are known to be generally very small despite their huge nitrogen pool in peat (Pihlatie et al., 2009; Ojanen et al., 2010).
One source of inorganic nitrogen could be the release of N from logging residues. It has, however, been shown in mineral soil forests that nitrogen was not released from logging residues during the first three years (Palviainen et al., 2004), and during the first two years the N content in pine needles actually increased. Despite of this, increased N concentrations in soil solutions under organic horizon were observed (Piirainen, 2002), suggesting that the source of N was the
mineralisation of the humus under the logging residue, rather than the logging residues themselves. The stabilising effect of logging residues on soil moisture and temperature may, in addition to affecting decomposition of soil OM, favour mineralization and nitrification processes in the organic layer (Rosén and Lundmark-Thelin, 1987). Nitrification processes produce nitrite and nitrate (and N2O), which can then be denitrified to N2O. Although we did not identify the source of the
inorganic N, we observed greatly increased emissions of N2O under logging residues. The removal
of the tree stand and the following reduction in the ground vegetation biomass further enables the high N2O emissions, as the inorganic N is not utilised by vegetation but remains in the soil (Silvan,
2004).
It has been suggested that peat CN-ratio could be used to predict N2O fluxes from peatlands: fluxes
be induced by logging residues. How long this effect would remain, is still unknown; the recovering vegetation is likely to capture any excessive inorganic N later on.
Soil moisture affects both nitrification and denitrification rates in forest soils. In peat soils especially, where soil moisture is extremely variable, these reactions are tightly coupled; nitrification, which demands oxygen, takes place in aerobic microsites of the soil, and
denitrification occurs in the anaerobic microsites. While nitrification activity is the key process, the emitted N2O was mainly procuced by denitrification in European forest soils (Ambus et al., 2006).
In upland soils moisture is typically below the optimum for denitrification and increased moisture can lead to increased N2O emissions. The same may be true for the surface layers of drained peat
soils. Changes in soil moisture are more dynamic in peat soils - even small precipitation events may create anaerobic microforms (Askaer et al., 2011) enabling the formation of N2O. Logging residues
most probably decreases evapotranspiration from soil creating thus more moist conditions in top soil. This increase could create anaerobic microsites in peat thus increasing denitrification and N2O
efflux.
Methane emissions did not change much under LR. Obviously, any changes that may take place in the oxidation of CH4 because of changed moisture or temperature conditions are not significant
enough to be reflected in the emissions.
4.3 Initial effect of logging residue to the soil GHG emissions following clearfelling
Our results indicate that logging residue may affect ecosystem GHG effluxes more than the estimate of the bare LR decomposition rate would suggest. In the energy use perspective the decomposition of logging residues at a forest site is usually seen as an alternative emission source to the burning of the residues for energy (e.g. Savolainen et al., 1994; Kirkinen et al., 2008). Here we calculated the initial effect of logging residue on the soil GHG efflux following clearfelling and compared the results to the CO2 emissions from the bare logging residue decomposition. This was done for year
2003 as for that annual N2O data was available. The proportion of wintertime CO2 fluxes in drained
peatlands was estimated to be on average 16% (Mäkiranta et al., 2007).
The logging residues on the site were not evenly spread but were clustered in small piles; this is the case also in practice, when the felled trees are pruned at the site with harvesters. We assumed that the amount of logging residue in the collar (Average dry mass of LR 1270g per collar, which equals 4050g m-2) would represent the average amount of residues in the piles. If the total amount of logging residues from branches and foliage (1830g m-2 spread evenly to the site, Table 2) would be in such piles they would cover 45% of the area. The logging residue induced soil emissions of CO2
((1530 g CO2 m-2 season-1 *1.16) *0.45) and N2O (380 g CO2 eq m-2 a-1 * 0.45) were 970 g CO2 eq
m-2 a-1 higher, compared to the situation that residues would have been collected and taken away from the site. This amount is nearly three times higher than the estimate obtained by using the decay rate from the bag experiment (380 g CO2 m–2a–1). Furthermore this LR induced soil emission was
almost one third of the calculated total CO2-C bound in the logging residues (3360 g CO2 m-2) and
with the same order of magnitude with the estimated LR CO2-C storage 10 years after clearfelling
(1570 g CO2 m-2, Eq. 1).
These calculations indicate that logging residues left at the clearfelled peatland have the potential to increase soil GHG-fluxes to the levels that might cause higher greenhouse impact compared to that when logging residues are harvested and burned for energy. This would make the harvesting of LR for biofuel more beneficial, in the form of avoided emissions. Further investigations on longevity of the effect of LR on GHG emissions, as well as on the sources of CO2 under logging residues are
Acknowledgements
We sincerely thank Sirpa Rantanen and numerous Master’s students for their assistance with the field measurements. We also express our gratitude to the reviewers, whose important contributions did much to help improve our manuscript. This study was a part of the research programmes “Pools and Fluxes of Carbon in Finnish Forests and Their Socio-Economic Implications” at the Finnish Forest Research Institute and “Greenhouse Impact of the Use of Peat and Peatlands in Finland”, funded by the Ministry of Agriculture and Forestry, the Ministry of Trade and Industry and the Ministry of the Environment. This study also benefited from the financial support of the Finnish Cultural Foundation and the Finnish Cultural Foundation South Savo Regional Fund.
References
Ambus, P., Zechmeister-Boltenstern, S., Butterbach-Bahl, K., 2006. Sources of nitrous oxide emitted from European forest soils. Biogeosciences 3, 135–145.
Askaer, L., Elberling, B., Glud, R.N., Kühl, M., Lauritsen, F.R., Joensen, H.P., 2010. Soil
heterogeneity effects on O2 distribution and CH4 emissions from wetlands: In situ and mesocosm
studies with planar O2 optodes and membrane inlet mass spectrometry. Soil Biology &
Biochemistry 42, 2254-2265.
Bridgham, S.D., Richardson, C.J., 1992. Mechanisms controlling soil respiration (CO2 and CH4) in
southern peatlands. Soil Biology and Biochemistry 20, 1089-1099.
Davidson, E.A., Belk, E., Boone, R.D., 1998. Soil water content and temperature as independent or confounded factors controlling soil respiration in a temperate mixed hardwood forest. Global Change Biology 4, 217–227.
Edwards, N.T., Ross-Todd, B.M., 1983. Soil carbon dynamics in a mixed deciduous forest
following clear-cutting with and without residue removal. Soil Science Society of America Journal 47, 1014–1021.
Firestone, M.K., Davidson, E.A., 1989. Microbiological basis of NO and N2O production and
consumption in soil, in: Andreae, M.O., Schimel, D.S. (Eds.), Exchange of Trace Gases between Terrestrial Ecosystems and the Atmosphere. Wiley, Chichester, pp. 7–21.
Fontaine, S., Bardoux, G., Abbadie, L., Mariotti, A., 2004. Carbon input to soil may decrease soil carbon content. Ecology Letters 7, 314–320.
Fontaine, S., Barot, S., Barre, P., Bdioui, N., Mary, B., Rumpel, C., 2007. Stability of organic carbon in deep soil layers controlled by fresh carbon supply. Nature 450, 277-280.
Gorham, E., 1991. Northern peatlands: role in the carbon cycle and probable responses to climatic warming. Ecological Applications 1, 182–195.
Hogg, E.H., Lieffers, V.J., Wein, R.W., 1992. Potential carbon losses from peat profiles: effects of temperature, drought cycles, and fire. Ecological Applications 2, 298–306.
Huttunen, J., Nykänen, H., Martikainen, P.J., Nieminen, M., 2003. Fluxes of nitrous oxide and methane from drained peatlands following forest clear-felling in southern Finland. Plant and Soil 255, 457–462.
Khalil, M. A. K., 1999. Non-CO2 greenhouse gases in the atmosphere. Annu. Rev. Energy Environ.
24, 645–661.
Kirkinen, J., Palosuo,T., Holmgren, K., Savolainen, I., 2008. Greenhouse impact due to the use of combustible fuels: Life cycle viewpoint and relative radiative forcing commitment. Environmental Management 42, 458 – 469.
Klemedtsson, L., von Arnold, K., Weslien, P., Gundersen, P., 2005. Soil CN ratio as a scalar parameter to predict nitrous oxide emissions. Global Change Biology 11, 1142–1147.
Laasasenaho, J., 1982. Taper curve and volume functions for pine, spruce and birch. Commun. Inst. For. Fenn. 108, 1–74.
Lähde, E., 1969. Biological activity in some natural and drained peat soils with special reference to oxidation–reduction conditions. Acta Forestalia Fennica 94, 1–69.
Laiho, R., Finer, L., 1996. Changes in root biomass after water–level drawdown on pine mires in southern Finland. Scandinavian Journal of Forest Research 11, 251–260.
Laiho, R., Minkkinen, K., Anttila, J., Váv ová, P., Penttilä, T., 2008. Dynamics of litterfall and decomposition in peatland forests: Towards reliable carbon balance estimation? In: Vymazal, J., (Eds.), Wastewater treatment, plant dynamics and management in constructed and natural wetlands. Springer Science + Business Media, Dordrecht, pp. 53-64.
Latter, P.M., Howson, G., Howard, D.M., Scott, W.A., 1998. Long-term study of litter decomposition on a Pennine peat bog: which regression? Oecologia 113, 94–103.
Lloyd, J., Taylor, J.A., 1994. On the temperature dependence of soil respiration. Functional Ecology 8, 315–323.
Londo, A.J., Messina, M.G., Schoenholtz, S.H., 1999. Forest harvesting affects on soil temperature, moisture and respiration in bottomland hardwood forest. Soil Science Society of America Journal 63, 637–644.
Mäkiranta, P., Hytönen, J., Aro, L., Maljanen, M., Pihlatie, M., Potila, H., Shurpali, N.J., Laine, J., Lohila, A., Martikainen, P.J., Minkkinen, K., 2007. Soil greenhouse gas emissions from afforested organic soil croplands and cutaway peatlands. Boreal Environment Research 12, 159-175.
Mäkiranta, P., Minkkinen,K., Hytönen, J., Laine,J., 2008. Factors causing temporal and spatial variation in heterotrophic and rhizospheric components of soil respiration in afforested organic soil croplands in Finland. Soil Biology and Biochemistry 40, 1592–1600.
Mäkiranta, P., Riutta, T., Penttilä, T., Minkkinen, K., 2010. Dynamics of net ecosystem CO2
exchange and heterotrophic soil respiration following clearfelling in a drained peatland forest. Agricultural and Forest Meteorology 150, 1491-1612.
Marklund, L.G., 1988. Biomassfunktioner för tall, gran och brjörk i Sverige. Report 45. Department of Forest Survey, Swedish University of Agricultural Sciences, 73 pp. (in Swedish).
Minkkinen, K., Laine, J., Shurpali, N.J., Mäkiranta, P., Alm, J., Penttilä, T., 2007. Heterotrophic soil respiration in forestry–drained peatlands. Boreal Environment Research 12, 115–126.
Murphy, M., Laiho, R., Moore, T., 2009. Effects of water table drawdown on root production and aboveground biomass in a boreal bog. Ecosystems 12, 1268–1282.
Nieminen, M., 1998. Changes in nitrogen cycling following the clearcutting of drained peatland forests in southern Finland. Boreal Environment Research 3, 9–21.
Ojanen, P., Minkkinen, K., Alm, J., Penttilä, T., 2010. Soil–atmosphere CO2, CH4 and N2O fluxes
Olson, J.S., 1963. Energy storage and the balance of producers and the decomposers in ecological systems. Ecology 14, 322–331.
Paavilainen, E., Päivänen, J., 1995. Peatland forestry – ecology and principles. Ecological Studies 111. Springer, Berlin, Heidelberg, New York.
Palviainen, M., Finer, L., Kurka, A-M., Mannerkoski, H., Piirainen, S., Starr, M., 2004.
Decomposition and nutrient release from logging residues after clear-cutting of mixed boreal forest. Plant and Soil 263, 53–67.
Pihlatie, M.K., Kiese. R., Bruggeman, N., Butterbach-Bahl, K., Kieloaho, A.J., Laurila, T., Lohila, A., Mammarella, I., Minkkinen, K., Penttilä, T., Schönborn, J., Vesala, T., 2010. Greenhouse gas fluxes in a drained peatland forest during spring frost-thaw event. Biogeosciences 7, 1715–1727. Piirainen, S., 2002. Nutrient fluxes through a boreal coniferous forest and the effects of clear-cutting. The Finnish Forest Research Institute, Research Papers 859, 50 p.
Pumpanen, J., Kolari, P., Ilvesniemi, H., Minkkinen, K., Vesala, T., Niinistö, S., Lohila, A., Larmola, T., Morero, M., Pihlatie, M., Janssens, I., Yuste, J.C., Günzweig, J.M., Reth, S., Subke, J.A., Savage, K., Kutsch, W., Østreng, G., Ziegler, W., Anthony, P., Lindroth, A., Hari, P., 2004. Comparison of different chamber techniques for measuring soil CO2 efflux. Agricultural and Forest
Meteorology 123, 159–176.
Repo, A., Tuomi, M., Liski, J., 2011. Indirect carbon dioxide emissions from producing bioenergy from forest harvest residues. GCB Bioenergy 3, 107-115.
Roberts, S.D., Harrington, C.A., Terry, T.A., 2005. Harvest residue and competing vegetation affect soil moisture, soil temperature, N availability, and Douglas-fir seedling growth. Forest Ecology and Management 205, 333–350.
Rosén, K., Lundmark-Thelin, A., 1987. Increased nitrogen leaching under piles of slash – A consequence of modern forest harvesting techniques. Scandinavian Journal of Forest Research 2, 21–29.
Saari, P., Saarnio, S., Kukkonen, J.V.K., Akkanen, J., Heinonen, J., Saari, V., Alm, J., 2009. DOC and N2O dynamics in upland and peatland forest soils after clear-cutting and soil preparation.
Biogeochemistry 94, 217-231.
Savolainen, I., Hillebrand, K., Nousiainen, I., Sinisalo, J., 1994. Comparison of radiative forcing impacts of the use of wood, peat, and fossil fuels. Fifth Global Warming Science and Policy International Conference, 1994, San Francisco, Calif.,USA. World Resource Review 6, 248–262. Schmidt, S.K., Lipson, D.A., 2004. Microbial growth under the snow: implications for nutrient and allelochemical availability in temperate soils. Plant and Soil 259, 1–7.
Silins, U., Rothwell, R.L., 1999. Spatial patterns of aerobic limit depth and oxygen diffusion rate at two peatlands drained for forestry in Alberta. Canadian Journal of Forest Research 29, 53–61. Smethurst, P.J., Nambiar, E.K.S., 1990. Effects of slash and litter management on uxes of nitrogen and tree growth in a young Pinus radiata plantation. Canadian Journal of Forest Research 20, 1498– 1507.
Silvan, N., 2004. Nutrient retention in a restored peatland buffer. Ph.D. thesis.University of Helsinki Department of Forest Ecology Publications 32, 1–112.
Smethurst, P.J., Nambiar, E.K.S., 1990. Effects of slash and litter management on fluxes of nitrogen and tree growth in a young Pinus radiata plantation. Canadian Journal of Forest Research 20, 1498-1507.
Tomppo, E., Hentonen, H., 1996. Suomen metsävärat 1989-94 ja niiden muutokset vuodesta 1951 lähtien. METLA. Metsätilastotiedote 354. 18p.
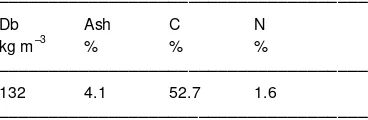
Table 1. Peat 0–20 cm characteristics. Db = bulk density.
–––––––––––––––––––––––––––––––––––––
Db Ash C N kg m–3 % % %
–––––––––––––––––––––––––––––––––––––
132 4.1 52.7 1.6
–––––––––––––––––––––––––––––––––––––
Table 2. Tree stand stem volume and biomass in Vesijako site.
–––––––––––––––––––––––––––––––––––––––––––––––––––––––––––––––––––––––––––––––––––––––––––––––––––– Year St emwood volume (m3 ha–1) Biomass by component (kg m–2)
pine spruce birch all root s >1 cm st umps st ems branches foliage all –––––––––––––––––––––––––––––––––––––––––––––––––––––––––––––––––––––––––––––––––––––––––––––––––––– t ree st and 2001* 141 23 40 203 2.180 0.800 8.430 1.390 0.440 13.240 logging residues 2.180 0.800 0.530 1.390 0.440 5.340 ––––––––––––––––––––––––––––––––––––––––––––––––––––––––––––––––––––––––––––––––––––––––––––––––––––
* befor e clearf elling
Table 3. Weather conditions at the sites during the measurement years and in the 1961–90 period. T_air is air temperature 2 m above ground and T_soil soil temperature 5 cm below ground.
______________________________________________________________________________________________________
Sit e Years T_air T_air T_air Precipit at ion T_soil T_soil T_soil mean mean sum (year/ wint er) mean mean sum annual summer (d.d. > 5°C) (mm) annual summer (d.d. > 0 °C)
______________________________________________________________________________________________________
Vesijako 2002 3.8 10.8 1336 5.3 10.2 1875 2003 3.8 11.2 1254 5.2 10.0 1836 2004 4.0 11.7 1300 5.7 10.7 1960 1961–1990 3.4 11.2 1239 601/ 228
Kivalo 2002 0.4 9.4 1150 4.5 8.9 1710 2003 1.4 9.6 1043 4.6 8.9 1721 2004 1.5 9.3 976 4.5 8.7 1675 1961–1990 –0.2 8.5 865 538/ 199
______________________________________________________________________________________________________
Table 4. Parameter values, their asymptotic standard errors (A.S.E.), number of observations and r2 value for LR mass loss (Eq. 1) in Vesijako and Kivalo sites.
____________________________________________________ Sit e Paramet er A.S.E. n r2 ____________________________________________________ Vesijako A 45.6 3.92 60 0.89
B 52.5 3.61 R 0.68 0.05
Kivalo A 43.3 4.35 60 0.89 B 55.7 4.00
R 0.70 0.05
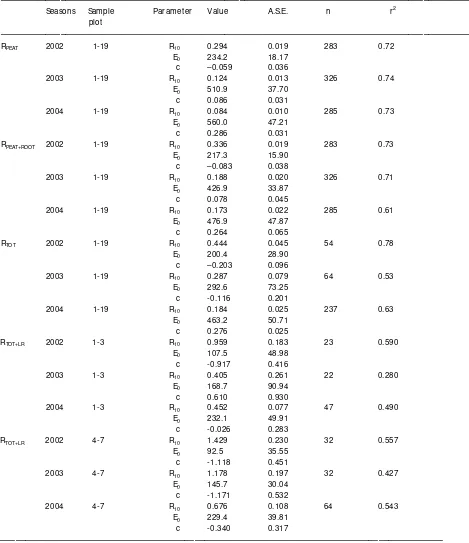
Table 5. Parameter values, their asymptotic standard errors (A.S.E.), number of observations and r2 value for heterotrophic peat soil respiration (RPEAT), heterotrophic peat soil respiration and
root-derived respiration (RPEAT+ROOT) and total soil respiration including heterotrophic respiration form
peat and aboveground litter along with root-derived respiration (RTOT) and for CO2 efflux from
decaying logging residues placed on top of the soil surface
(
RTOT+LR).Table 6. The simulated seasonal (May–Oct) CO2 emissions (g CO2 m–2 season–1) from sample plots
with logging residue (RTOT+LR), without logging residue (RTOT), and bare logging residue (LR)
decay in the RTOT_LR sample plot (RLR, Eq. 3). Included are also the calculated seasonal logging
residue induced soil CO2, N2O and total GHG effluxes (N2O effluxes are converted into CO2
equivalents (100-year GWP multiplier 298, IPCC 2007))
____________________________________________________________________________________________ Seasonal CO2 effluxes LR induced soil effluxes in CO2equivalent s
Season RTOT+LR RTOT RLR
CO2 N2O GHG
–––––––––––––––––––––––––––––––––––––––––––––––––––––––––––––––––––––––––––––––––––––
2002 3510 1720 820 970
2003 3250 1260 460 1530 180 1710
2004 2450 1355 315 780 120 900
____________________________________________________________________________________________
Figure 1. Logging residue mass loss (%) following clearfelling based on LR bag results for both Vesijako and Kivalo sites. Measured data are presented as means + S.D. Lines are the asymptotic curves for mass remaining (%) of LR (Eq. 1) fitted to the measured data.
Years
0 1 2 3 4 5 6
M
as
s
r
em
a
ini
n
g
(
%
)
30 40 50 60 70 80 90 100
Figure 2. Measured CO2, N2O and CH4 effluxes from plots without and with logging residues (LR)
along with the continuous soil temperature (TSOIL) and water level (WL) data (daily min and max)
from the Vesijako site. N2O data is missing from 2002 because of problems with gas
Figure 3. The simulated seasonal (May- Oct) CO2 emissions (g CO2 m–2 season–1) from different
soil respiration components; heterotrophic peat soil respiration (RPEAT), heterotrophic respiration
from above ground litter decomposition (RLITTER, Eq. 4) and root derived respiration (RROOT, Eq. 5),
and their proportion from total soil respiration following clear felling in February 2002.
Year
2002 2003 2004
g
C
O 2
m
-2 s
e
a
s
o
n
-1
0 200 400 600 800 1000 1200 1400 1600 1800
RPEAT RLITTER
RROOT
77% 72% 64%
15%
8%
5%
23%
5%