Russell Jurney
Agile Data Science by Russell Jurney
Copyright © 2014 Data Syndrome LLC. All rights reserved. Printed in the United States of America.
Published by O’Reilly Media, Inc., 1005 Gravenstein Highway North, Sebastopol, CA 95472.
O’Reilly books may be purchased for educational, business, or sales promotional use. Online editions are also available for most titles (http://my.safaribooksonline.com). For more information, contact our corporate/ institutional sales department: 800-998-9938 or [email protected].
Editors: Mike Loukides and Mary Treseler Production Editor: Nicole Shelby
Copyeditor: Rachel Monaghan Proofreader: Linley Dolby
Cover Designer: Karen Montgomery Interior Designer: David Futato Illustrator: Kara Ebrahim
October 2013: First Edition Revision History for the First Edition: 2013-10-11: First release
See http://oreilly.com/catalog/errata.csp?isbn=9781449326265 for release details.
Nutshell Handbook, the Nutshell Handbook logo, and the O’Reilly logo are registered trademarks of O’Reilly Media, Inc. Agile Data Science and related trade dress are trademarks of O’Reilly Media, Inc.
Many of the designations used by manufacturers and sellers to distinguish their products are claimed as trademarks. Where those designations appear in this book, and O’Reilly Media, Inc., was aware of a trade‐ mark claim, the designations have been printed in caps or initial caps.
While every precaution has been taken in the preparation of this book, the publisher and author assume no responsibility for errors or omissions, or for damages resulting from the use of the information contained herein.
Table of Contents
Preface. . . vii
Part I. Setup
1. Theory. . . 3
Agile Big Data 3
Big Words Defined 4
Agile Big Data Teams 5
Recognizing the Opportunity and Problem 6
Adapting to Change 8
Agile Big Data Process 11
Code Review and Pair Programming 12
Agile Environments: Engineering Productivity 13
Collaboration Space 14
Private Space 14
Personal Space 14
Realizing Ideas with Large-Format Printing 15
2. Data. . . 17
Email 17
Working with Raw Data 18
Raw Email 18
Structured Versus Semistructured Data 18
SQL 20
NoSQL 24
Serialization 24
Extracting and Exposing Features in Evolving Schemas 25
Data Pipelines 26
Data Perspectives 27
Instrumentation 81
Google Analytics 81
Mortar Data 82
Properties of Successful Emails 150
Better Predictions with Naive Bayes 150
P(Reply | From & To) 150
P(Reply | Token) 151
Making Predictions in Real Time 153
Logging Events 156
Conclusion 157
Index. . . 159
Preface
I wrote this book to get over a failed project and to ensure that others do not repeat my mistakes. In this book, I draw from and reflect upon my experience building analytics applications at two Hadoop shops.
Agile Data Science has three goals: to provide a how-to guide for building analytics applications with big data using Hadoop; to help teams collaborate on big data projects in an agile manner; and to give structure to the practice of applying Agile Big Data analytics in a way that advances the field.
Who This Book Is For
Agile Data Science is a course to help big data beginners and budding data scientists to become productive members of data science and analytics teams. It aims to help engi‐ neers, analysts, and data scientists work with big data in an agile way using Hadoop. It introduces an agile methodology well suited for big data.
This book is targeted at programmers with some exposure to developing software and working with data. Designers and product managers might particularly enjoy Chapters
1, 2, and 5, which would serve as an introduction to the agile process without an excessive focus on running code.
Agile Data Science assumes you are working in a *nix environment. Examples for Win‐ dows users aren’t available, but are possible via Cygwin. A user-contributed Linux Va‐
grant image with all the prerequisites installed is available here. You can quickly boot a
Linux machine in VirtualBox using this tool.
How This Book Is Organized
This book is organized into two sections. Part I introduces the data- and toolset we will use in the tutorials in Part II. Part I is intentionally brief, taking only enough time to
introduce the tools. We go more in-depth into their use in Part II, so don’t worry if you’re a little overwhelmed in Part I. The chapters that compose Part I are as follows:
Chapter 1, Theory
Introduces the Agile Big Data methodology.
Chapter 2, Data
Describes the dataset used in this book, and the mechanics of a simple prediction.
Chapter 3, Agile Tools
Introduces our toolset, and helps you get it up and running on your own machine.
Chapter 4, To the Cloud!
Walks you through scaling the tools in Chapter 3 to petabyte scale using the cloud.
Part II is a tutorial in which we build an analytics application using Agile Big Data. It is a notebook-style guide to building an analytics application. We climb the data-value pyramid one level at a time, applying agile principles as we go. I’ll demonstrate a way of building value step by step in small, agile iterations. Part II comprises the following chapters:
Chapter 5, Collecting and Displaying Records
Helps you download your inbox and then connect or “plumb” emails through to a web application.
Chapter 6, Visualizing Data with Charts
Steps you through how to navigate your data by preparing simple charts in a web application.
Chapter 7, Exploring Data with Reports
Teaches you how to extract entities from your data and link between them to create interactive reports.
Chapter 8, Making Predictions
Helps you use what you’ve done so far to infer the response rate to emails.
Chapter 9, Driving Actions
Explains how to extend your predictions into a real-time ensemble classifier to help make emails that will be replied to.
Conventions Used in This Book
The following typographical conventions are used in this book:
Italic
Indicates new terms, URLs, email addresses, filenames, and file extensions.
Constant width
Used for program listings, as well as within paragraphs to refer to program elements such as variable or function names, databases, data types, environment variables, statements, and keywords.
Constant width bold
Shows commands or other text that should be typed literally by the user.
Constant width italic
Shows text that should be replaced with user-supplied values or by values deter‐ mined by context.
This icon signifies a tip, suggestion, or general note.
This icon indicates a warning or caution.
Using Code Examples
Supplemental material (code examples, exercises, etc.) is available for download at
https://github.com/rjurney/Agile_Data_Code.
This book is here to help you get your job done. In general, if example code is offered with this book, you may use it in your programs and documentation. You do not need to contact us for permission unless you’re reproducing a significant portion of the code. For example, writing a program that uses several chunks of code from this book does not require permission. Selling or distributing a CD-ROM of examples from O’Reilly books does require permission. Answering a question by citing this book and quoting example code does not require permission. Incorporating a significant amount of ex‐ ample code from this book into your product’s documentation does require permission.
We appreciate, but do not require, attribution. An attribution usually includes the title,
author, publisher, and ISBN. For example: “Agile Data Science by Russell Jurney (O’Reil‐
ly). Copyright 2014 Data Syndrome LLC, 978-1-449-32626-5.”
If you feel your use of code examples falls outside fair use or the permission given above, feel free to contact us at [email protected].
Safari® Books Online
Safari Books Online (www.safaribooksonline.com) is an
on-demand digital library that delivers expert content in both book and
video form from the world’s leading authors in technology and busi‐ ness.
Technology professionals, software developers, web designers, and business and crea‐ tive professionals use Safari Books Online as their primary resource for research, prob‐ lem solving, learning, and certification training.
Safari Books Online offers a range of product mixes and pricing programs for organi‐
zations, government agencies, and individuals. Subscribers have access to thousands of books, training videos, and prepublication manuscripts in one fully searchable database from publishers like O’Reilly Media, Prentice Hall Professional, Addison-Wesley Pro‐ fessional, Microsoft Press, Sams, Que, Peachpit Press, Focal Press, Cisco Press, John Wiley & Sons, Syngress, Morgan Kaufmann, IBM Redbooks, Packt, Adobe Press, FT Press, Apress, Manning, New Riders, McGraw-Hill, Jones & Bartlett, Course Technol‐
ogy, and dozens more. For more information about Safari Books Online, please visit us
online.
How to Contact Us
Please address comments and questions concerning this book to the publisher:
O’Reilly Media, Inc.
1005 Gravenstein Highway North Sebastopol, CA 95472
800-998-9938 (in the United States or Canada) 707-829-0515 (international or local)
707-829-0104 (fax)
We have a web page for this book, where we list errata, examples, and any additional information. You can access this page at http://oreil.ly/agile-data-science.
To comment or ask technical questions about this book, send email to bookques
For more information about our books, courses, conferences, and news, see our website at http://www.oreilly.com.
Find us on Facebook: http://facebook.com/oreilly
Follow us on Twitter: http://twitter.com/oreillymedia
Watch us on YouTube: http://www.youtube.com/oreillymedia
PART I
CHAPTER 1
Theory
We are uncovering better ways of developing software by doing it and helping others do it. Through this work we have come to value:
Individuals and interactions over processes and tools
Working software over comprehensive documentation
Customer collaboration over contract negotiation
Responding to change over following a plan
That is, while there is value in the items on the right, we value the items on the left more. —The Agile Manifesto
Agile Big Data
Agile Big Data is a development methodology that copes with the unpredictable realities of creating analytics applications from data at scale. It is a guide for operating the Hadoop data refinery to harness the power of big data.
Warehouse-scale computing has given us enormous storage and compute resources to solve new kinds of problems involving storing and processing unprecedented amounts of data. There is great interest in bringing new tools to bear on formerly intractable problems, to derive entirely new products from raw data, to refine raw data into prof‐ itable insight, and to productize and productionize insight in new kinds of analytics applications. These tools are processor cores and disk spindles, paired with visualization, statistics, and machine learning. This is data science.
At the same time, during the last 20 years, the World Wide Web has emerged as the dominant medium for information exchange. During this time, software engineering has been transformed by the “agile” revolution in how applications are conceived, built, and maintained. These new processes bring in more projects and products on time and
under budget, and enable small teams or single actors to develop entire applications
spanning broad domains. This is agile software development.
But there’s a problem. Working with real data in the wild, doing data science, and per‐ forming serious research takes time—longer than an agile cycle (on the order of months). It takes more time than is available in many organizations for a project sprint, meaning today’s applied researcher is more than pressed for time. Data science is stuck
on the old-school software schedule known as the waterfall method.
Our problem and our opportunity come at the intersection of these two trends: how can we incorporate data science, which is applied research and requires exhaustive effort on an unpredictable timeline, into the agile application? How can analytics applications do better than the waterfall method that we’ve long left behind? How can we craft ap‐ plications for unknown, evolving data models?
This book attempts to synthesize two fields, agile development and big data science, to meld research and engineering into a productive relationship. To achieve this, it presents a lightweight toolset that can cope with the uncertain, shifting sea of raw data. The book goes on to show you how to iteratively build value using this stack, to get back to agility and mine data to turn it to dollars.
Agile Big Data aims to put you back in the driver’s seat, ensuring that your applied research produces useful products that meet the needs of real users.
Big Words Defined
Scalability, NoSQL, cloud computing, big data—these are all controversial terms. Here, they are defined as they pertain to Agile Big Data:
Scalability
This is the simplicity with which you can grow or shrink some operation in response to demand. In Agile Big Data, it means software tools and techniques that grow sublinearly in terms of cost and complexity as load and complexity in an application grow linearly. We use the same tools for data, large and small, and we embrace a methodology that lets us build once, rather than re-engineer continuously.
NoSQL
Short for “Not only SQL,” this means escaping the bounds imposed by storing structured data in monolithic relational databases. It means going beyond tools that were optimized for Online Transaction Processing (OLTP) and extended to Online Analytic Processing (OLAP) to use a broader set of tools that are better suited to viewing data in terms of analytic structures and algorithms. It means escaping the bounds of a single machine with expensive storage and starting out with concurrent systems that will grow linearly as users and load increase. It means not hitting a wall as soon as our database gets bogged down, and then struggling to tune, shard, and mitigate problems continuously.
The NoSQL tools we’ll be using are Hadoop, a highly parallel batch-processing
system, and MongoDB, a distributed document store.
Cloud computing
Computing on the cloud means employing infrastructure as a service from pro‐ viders like Amazon Web Services to compose applications at the level of data center as computer. As application developers, we use cloud computing to avoid getting bogged down in the details of infrastructure while building applications that scale.
Big data
There is a market around the belief that enormous value will be extracted from the ever-increasing pile of transaction logs being aggregated by the mission-critical systems of today and tomorrow; that’s Big Data. Big Data systems use local storage, commodity server hardware, and free and open source software to cheaply process data at a scale where it becomes feasible to work with atomic records that are vol‐ uminously logged and processed.
Eric Tschetter, cofounder and lead architect at Metamarkets, says this about NoSQL in practice:
“I define NoSQL as the movement towards use-case specialized stor‐ age and query layer combinations. The RDBMS is a highly generic weapon that can be utilized to solve any data storage and query need up to a certain amount of load. I see NoSQL as a move toward other types of storage architectures that are optimized for a specific use-case and can offer benefits in areas like operational complexity by making assumptions about said use cases.”
Agile Big Data Teams
Products are built by teams of people, and agile methods focus on people over process, so Agile Big Data starts with a team.
Data science is a broad discipline, spanning analysis, design, development, business, and research. The roles of Agile Big Data team members, defined in a spectrum from
customer to operations, look something like Figure 1-1:
Figure 1-1. The roles in an Agile Big Data team
These roles can be defined as:
• Customers use your product, click your buttons and links, or ignore you com‐ pletely. Your job is to create value for them repeatedly. Their interest determines the success of your product.
• Business development signs early customers, either firsthand or through the cre‐ ation of landing pages and promotion. Delivers traction from product in market. • Marketers talk to customers to determine which markets to pursue. They deter‐
mine the starting perspective from which an Agile Big Data product begins. • Product managers take in the perspectives of each role, synthesizing them to build
consensus about the vision and direction of the product.
• Userexperience designers are responsible for fitting the design around the data to match the perspective of the customer. This role is critical, as the output of statistical models can be difficult to interpret by “normal” users who have no concept of the semantics of the model’s output (i.e., how can something be 75% true?).
• Interaction designers design interactions around data models so users find their value.
• Web developers create the web applications that deliver data to a web browser. • Engineers build the systems that deliver data to applications.
• Data scientists explore and transform data in novel ways to create and publish new features and combine data from diverse sources to create new value. Data scientists make visualizations with researchers, engineers, web developers, and designers to expose raw, intermediate, and refined data early and often.
• Applied researchers solve the heavy problems that data scientists uncover and that stand in the way of delivering value. These problems take intense focus and time and require novel methods from statistics and machine learning.
• Platform engineers solve problems in the distributed infrastructure that enable Agile Big Data at scale to proceed without undue pain. Platform engineers handle work tickets for immediate blocking bugs and implement long-term plans and projects to maintain and improve usability for researchers, data scientists, and en‐ gineers.
• Operations/DevOps professionals ensure smooth setup and operation of pro‐ duction data infrastructure. They automate deployment and take pages when things go wrong.
Recognizing the Opportunity and Problem
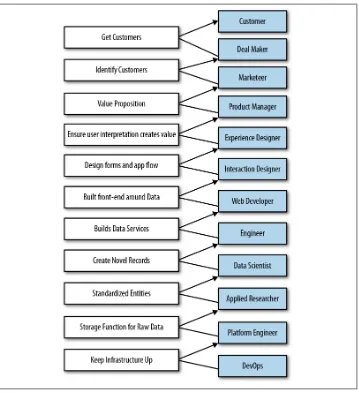
The broad skillset needed to build data products presents both an opportunity and a problem. If these skills can be brought to bear by experts in each role working as a team
on a rich dataset, problems can be decomposed into parts and directly attacked. Data science is then an efficient assembly line, as illustrated in Figure 1-2.
However, as team size increases to satisfy the need for expertise in these diverse areas, communication overhead quickly dominates. A researcher who is eight persons away from customers is unlikely to solve relevant problems and more likely to solve arcane problems. Likewise, team meetings of a dozen individuals are unlikely to be productive. We might split this team into multiple departments and establish contracts of delivery between them, but then we lose both agility and cohesion. Waiting on the output of research, we invent specifications and soon we find ourselves back in the waterfall method.
Figure 1-2. Expert contributor workflow
And yet we know that agility and a cohesive vision and consensus about a product are essential to our success in building products. The worst product problem is one team working on more than one vision. How are we to reconcile the increased span of ex‐ pertise and the disjoint timelines of applied research, data science, software develop‐ ment, and design?
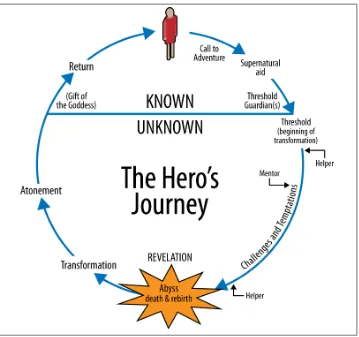
Adapting to Change
To remain agile, we must embrace and adapt to these new conditions. We must adopt changes in line with lean methodologies to stay productive.
Several changes in particular make a return to agility possible:
• Choosing generalists over specialists • Preferring small teams over large teams
• Using high-level tools and platforms: cloud computing, distributed systems, and platforms as a service (PaaS)
• Continuous and iterative sharing of intermediate work, even when that work may be incomplete
In Agile Big Data, a small team of generalists uses scalable, high-level tools and cloud computing to iteratively refine data into increasingly higher states of value. We embrace a software stack leveraging cloud computing, distributed systems, and platforms as a service. Then we use this stack to iteratively publish the intermediate results of even our most in-depth research to snowball value from simple records to predictions and actions that create value and let us capture some of it to turn data into dollars. Let’s examine each item in detail.
Harnessing the power of generalists
In Agile Big Data we value generalists over specialists, as shown in Figure 1-3.
Figure 1-3. Broad roles in an Agile Big Data team
In other words, we measure the breadth of teammates’ skills as much as the depth of their knowledge and their talent in any one area. Examples of good Agile Big Data team members include:
• Designers who deliver working CSS
• Web developers who build entire applications and understand user interface and experience
• Data scientists capable of both research and building web services and applications • Researchers who check in working source code, explain results, and share inter‐
mediate data
• Product managers able to understand the nuances in all areas
Design in particular is a critical role on the Agile Big Data team. Design does not end with appearance or experience. Design encompasses all aspects of the product, from architecture, distribution, and user experience to work environment.
In the documentary The Lost Interview, Steve Jobs said this about design: “Designing a product is keeping five thousand things in your brain and fitting them all together in new and different ways to get what you want. And every day you discover something new that is a new problem or a new opportunity to fit these things together a little differently. And it’s that process that is the magic.”
Leveraging agile platforms
In Agile Big Data, we use the easiest-to-use, most approachable distributed systems, along with cloud computing and platforms as a service, to minimize infrastructure costs and maximize productivity. The simplicity of our stack helps enable a return to agility. We’ll use this stack to compose scalable systems in as few steps as possible. This lets us move fast and consume all available data without running into scalability problems that
cause us to discard data or remake our application in flight. That is to say, we only build
it once.
Sharing intermediate results
Finally, to address the very real differences in timelines between researchers and data
scientists and the rest of the team, we adopt a sort of data collage as our mechanism of
mending these disjointed scales. In other words, we piece our app together from the abundance of views, visualizations, and properties that form the “menu” for our appli‐ cation.
Researchers and data scientists, who work on longer timelines than agile sprints typically allow, generate data daily—albeit not in a “publishable” state. In Agile Big Data, there is no unpublishable state. The rest of the team must see weekly, if not daily (or more often), updates in the state of the data. This kind of engagement with researchers is essential to unifying the team and enabling product management.
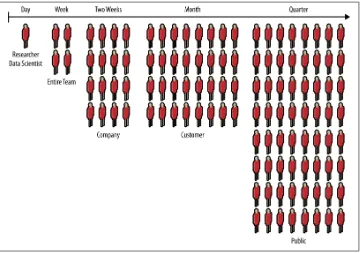
That means publishing intermediate results—incomplete data, the scraps of analysis. These “clues” keep the team united, and as these results become interactive, everyone becomes informed as to the true nature of the data, the progress of the research, and how to combine clues into features of value. Development and design must proceed from this shared reality. The audience for these continuous releases can start small and
grow as they become presentable (as shown in Figure 1-4), but customers must be
included quickly.
Figure 1-4. Growing audience from conception to launch
Agile Big Data Process
The Agile Big Data process embraces the iterative nature of data science and the effi‐ ciency our tools enable to build and extract increasing levels of structure and value from our data.
Given the spectrum of skills within a data product team, the possibilities are endless. With the team spanning so many disciplines, building web products is inherently col‐ laborative. To collaborate, teams need direction: every team member passionately and stubbornly pursuing a common goal. To get that direction, you require consensus.
Building and maintaining consensus while collaborating is the hardest part of building software. The principal risk in software product teams is building to different blueprints. Clashing visions result in incohesive holes that sink products.
Applications are sometimes mocked before they are built: product managers conduct
market research, while designers iterate mocks with feedback from prospective users. These mocks serve as a common blueprint for the team.
Real-world requirements shift as we learn from our users and conditions change, even when the data is static. So our blueprints must change with time. Agile methods were
created to facilitate implementation of evolving requirements, and to replace mockups with real working systems as soon as possible.
Typical web products—those driven by forms backed by predictable, constrained trans‐ action data in relational databases—have fundamentally different properties than prod‐ ucts featuring mined data. In CRUD applications, data is relatively consistent. The models are predictable SQL tables or documents, and changing them is a product de‐ cision. The data’s “opinion” is irrelevant, and the product team is free to impose its will on the model to match the business logic of the application.
In interactive products driven by mined data, none of that holds. Real data is dirty. Mining always involves dirt. If the data isn’t dirty, it wouldn’t be data mining. Even carefully extracted and refined mined information can be fuzzy and unpredictable. Presenting it on the consumer Internet requires long labor and great care.
In data products, the data is ruthlessly opinionated. Whatever we wish the data to say, it is unconcerned with our own opinions. It says what it says. This means the waterfall model has no application. It also means that mocks are an insufficient blueprint to establish consensus in software teams.
Mocks of data products are a specification of the application without its essential char‐ acter, the true value of the information being presented. Mocks as blueprints make assumptions about complex data models they have no reasonable basis for. When spec‐ ifying lists of recommendations, mocks often mislead. When mocks specify full-blown interactions, they do more than that: they suppress reality and promote assumption. And yet we know that good design and user experience are about minimizing assump‐ tion. What are we to do?
The goal of agile product development is to identify the essential character of an appli‐ cation and to build that up first before adding features. This imparts agility to the project, making it more likely to satisfy its real, essential requirements as they evolve. In data products, that essential character will surprise you. If it doesn’t, you are either doing it wrong, or your data isn’t very interesting. Information has context, and when that con‐ text is interactive, insight is not predictable.
Code Review and Pair Programming
To avoid systemic errors, data scientists share their code with the rest of the team on a regular basis, so code review is important. It is easy to fix errors in parsing that hide
systemic errors in algorithms. Pair programming, where pairs of data hackers go over
code line by line, checking its output and explaining the semantics, can help detect these errors.
Rows of cubicles like cells of a hive. Overbooked conference rooms camped and decamped. Microsoft Outlook a modern punchcard. Monolithic insanity. A sea of cubes. Deadlines interrupted by oscillating cacophonies of rumors shouted, spread like waves uninterrupted by naked desks. Headphone budgets. Not working, close together. Decibel induced telecommuting. The open plan. Competing monstrosities seeking productivity but not finding it. —Poem by author
Agile Environments: Engineering Productivity
Generalists require more uninterrupted concentration and quiet than do specialists. That is because the context of their work is broader, and therefore their immersion is deeper. Their environment must suit this need.
Invest in two to three times the space of a typical cube farm, or you are wasting your people. In this setup, some people don’t need desks, which drives costs down.
We can do better. We should do better. It costs more, but it is inexpensive.
In Agile Big Data, we recognize team members as creative workers, not office workers. We therefore structure our environment more like a studio than an office. At the same time, we recognize that employing advanced mathematics on data to build products requires quiet contemplation and intense focus. So we incorporate elements of the li‐ brary as well.
Many enterprises limit their productivity enhancement of employees to the acquisition of skills. However, about 86% of productivity problems reside in the work environment of organizations. The work environment has effect on the performance of employees. The type of work environment in which employees operate determines the way in which such enterprises prosper.
—Akinyele Samuel Taiwo
It is much higher cost to employ people than it is to maintain and operate a building, hence spending money on improving the work environment is the most cost effective way of improving productivity because of small percentage increase in productivity of 0.1% to 2% can have dramatic effects on the profitability of the company.
—Derek Clements-Croome and Li Baizhan
Creative workers need three kinds of spaces to collaborate and build together. From open to closed, they are: collaboration space, personal space, and private space.
Collaboration Space
Collaboration space is where ideas are hatched. Situated along main thoroughfares and between departments, collaborative spaces are bright, open, comfortable, and inviting. They have no walls. They are flexible and reconfigurable. They are ever-changing, always being rearranged, and full of bean bags, pillows, and comfortable chairs. Collaboration space is where you feel the energy of your company: laughter, big conversations, excited voices talking over one another. Invest in and showcase these areas. Real, not plastic, plants keep sound from carrying—and they make air!
Private Space
Private space is where deadlines get met. Enclosed and soundproof, private spaces are libraries. There is no talking. Private space minimizes distractions: think dim light and white noise. There are bean bags, couches, and chairs, but ergonomics demand proper workstations too. These spaces might include separate sit/stand desks with docking stations behind (bead) curtains with 30-inch customized LCDs.
Personal Space
Personal space is where people call home. In between collaboration and private space in its degree of openness, personal space should be personalized by each individual to suit his or her needs (e.g., shared office or open desks, half or whole cube). Personal space should come with a menu and a budget. Themes and plant life should be encour‐ aged. This is where some people will spend most of their time. On the other hand, given adequate collaborative and private space, a notebook, and a mobile device, some people don’t need personal space at all.
Above all, the goal of the agile environment is to create immersion in data through the physical environment: printouts, posters, books, whiteboard, and more, as shown in
Figure 1-5.
Figure 1-5. Data immersion through collage
Realizing Ideas with Large-Format Printing
Easy access to large-format printing is a requirement for the agile environment. Visu‐ alization in material form encourages sharing, collage, expressiveness, and creativity.
The HP DesignJet 111 is a 24-inch-wide large format printer that costs less than $1,000. Continuous ink delivery systems are available for less than $100 that bring the opera‐ tional cost of large-format printing—for instance, 24 × 36 inch posters—to less than one dollar per poster.
At this price point, there is no excuse not to give a data team easy access to several large-format printers for both plain-paper proofs and glossy prints. It is very easy to get people excited about data across departments when they can see concrete proof of the progress of the data science team.
CHAPTER 2
Data
This chapter introduces the dataset we will work on in the rest of the book: your own email inbox. It will also cover the kinds of tools we’ll be using, and our reasoning for doing so. Finally, it will outline multiple perspectives we’ll use in analyzing data for you to think about moving forward.
The book starts with data because in Agile Big Data, our process starts with the data.
If you do not have a Gmail account, you will need to create one (at http://mail.google.com) and populate it with some email messages in order to complete the exercises in this chapter.
Email is a fundamental part of the Internet. More than that, it is foundational, forming the basis for authentication for the Web and social networks. In addition to being abun‐ dant and well understood, email is complex, is rich in signal, and yields interesting information when mined.
We will be using your own email inbox as the dataset for the application we’ll develop in order to make the examples relevant. By downloading your Gmail inbox and then using it in the examples, we will immediately face a “big” or actually, a “medium” data problem—processing the data on your local machine is just barely feasible. Working with data too large to fit in RAM this way requires that we use scalable tools, which is helpful as a learning device. By using your own email inbox, we’ll enable insights into your own little world, helping you see which techniques are effective! This is cultivating
data intuition, a major theme in Agile Big Data.
In this book, we use the same tools that you would use at petabyte scale, but in local mode on your own machine. This is more than an efficient way to process data; our
choice of tools ensures that we only have to build it once, and it will scale up. This imparts simplicity on everything that we do and enables agility.
Working with Raw Data
Raw Email
Email’s format is rigorously defined in IETF RFC-5322 (Request For Comments by the Internet Engineering Taskforce). To view a raw email in Gmail, select a message and
then select the “show original” option in the top-right drop-down menu (Figure 2-1).
Figure 2-1. Gmail “show original” option
A raw email looks like this:
From: Russell Jurney <[email protected]> Mime-Version: 1.0 (1.0)
Date: Mon, 28 Nov 2011 14:57:38 -0800 Delivered-To: [email protected]
Message-ID: <4484555894252760987@unknownmsgid> Subject: Re: Lawn
To: William Jurney <******@hotmail.com> Content-Type: text/plain; charset=ISO-8859-1
Dad, get a sack of Rye grass seed and plant it over there now. It will build up a nice turf over the winter, then die off when it warms up. Making for good topsoil you can plant regular grass in.
Will keep the weeds from taking over.
Russell Jurney datasyndrome.com
This is called semistructured data.
Structured Versus Semistructured Data
Wikipedia defines semistructured data as:A form of structured data that does not conform with the formal structure of tables and data models associated with relational databases but nonetheless contains tags or other markers to separate semantic elements and enforce hierarchies of records and fields within the data.
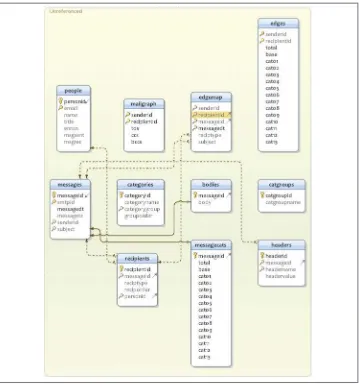
This is in contrast to relational, structured data, which breaks data up into rigorously defined schemas before analytics begin for more efficient querying therafter. A struc‐ tured view of email is demonstrated in the Berkeley Enron dataset by Andrew Fiore and Jeff Heer, shown in Figure 2-2.
Figure 2-2. Enron email schema
SQL
To query a relational, structured schema, we typically use declarative programming languages like SQL. In SQL, we specify what we want, rather than what to do. This is different than declarative programming. In SQL, we specify the desired output rather than a set of operations on our data. A SQL query against the Enron relational email dataset to retrieve a single email in its entirety looks like this:
select m.smtpid as id, m.messagedt as date, s.email as sender,
(select GROUP_CONCAT(CONCAT(r.reciptype, ':', p.email) SEPARATOR ' ') from recipients r where m.messageid=511;
| <25772535.1075839951307.JavaMail.evans@thyme> | 2002-02-02 12:56:33 | [email protected] |
to:[email protected] cc:[email protected] cc:[email protected] cc:[email protected]
cc:[email protected] cc:[email protected] cc:[email protected] cc:[email protected]
cc:[email protected] cc:[email protected] bcc:[email protected] bcc:[email protected]
bcc:[email protected] bcc:[email protected] bcc:[email protected] bcc:[email protected]
bcc:[email protected] bcc:[email protected] bcc:[email protected] | Schedule Crawler:
HourAhead Failure | Start Date: 2/2/02; HourAhead hour: 11; HourAhead schedule download failed. Manual intervention required. |
Note how complex this query is to retrieve a basic record. We join three tables and use
a subquery, the special MySQL function GROUP_CONCAT as well as CONCAT and SUBSTR.
Relational data almost discourages us from viewing data in its original form by requiring us to think in terms of the relational schema and not the data itself in its original, denormalized form. This complexity affects our entire analysis, putting us in “SQL land” instead of document reality.
Also note that defining the preceding tables is complex in and of itself:
CREATE TABLE bodies (
messageid int(10) unsigned NOT NULL default '0',
body text,
PRIMARY KEY (messageid) ) TYPE=MyISAM;
CREATE TABLE categories (
categoryid int(10) unsigned NOT NULL auto_increment, categoryname varchar(255) default NULL,
categorygroup int(10) unsigned default NULL, grouporder int(10) unsigned default NULL, PRIMARY KEY (categoryid),
KEY categories_categorygroup (categorygroup) ) TYPE=MyISAM;
CREATE TABLE catgroups (
catgroupid int(10) unsigned NOT NULL default '0', catgroupname varchar(255) default NULL,
PRIMARY KEY (catgroupid) ) TYPE=MyISAM;
CREATE TABLE edgemap (
senderid int(10) unsigned default NULL, recipientid int(10) unsigned default NULL, messageid int(10) unsigned default NULL, messagedt timestamp(14) NOT NULL,
reciptype enum('bcc','cc','to') default NULL, subject varchar(255) default NULL,
KEY senderid (senderid,recipientid),
senderid int(10) unsigned default NULL, recipientid int(10) unsigned default NULL, total int(10) unsigned NOT NULL default '0', base int(10) unsigned NOT NULL default '0', cat01 int(10) unsigned NOT NULL default '0', cat02 int(10) unsigned NOT NULL default '0', cat03 int(10) unsigned NOT NULL default '0', cat04 int(10) unsigned NOT NULL default '0', cat05 int(10) unsigned NOT NULL default '0', cat06 int(10) unsigned NOT NULL default '0', cat07 int(10) unsigned NOT NULL default '0', cat08 int(10) unsigned NOT NULL default '0', cat09 int(10) unsigned NOT NULL default '0', cat10 int(10) unsigned NOT NULL default '0', cat11 int(10) unsigned NOT NULL default '0', cat12 int(10) unsigned NOT NULL default '0', cat13 int(10) unsigned NOT NULL default '0', UNIQUE KEY senderid (senderid,recipientid)
) TYPE=MyISAM;
CREATE TABLE headers (
headerid int(10) unsigned NOT NULL auto_increment, messageid int(10) unsigned default NULL,
headername varchar(255) default NULL, headervalue text,
PRIMARY KEY (headerid),
KEY headers_headername (headername), KEY headers_messageid (messageid) ) TYPE=MyISAM;
CREATE TABLE messages (
messageid int(10) unsigned NOT NULL auto_increment, smtpid varchar(255) default NULL,
messagedt timestamp(14) NOT NULL, messagetz varchar(20) default NULL, senderid int(10) unsigned default NULL, subject varchar(255) default NULL, PRIMARY KEY (messageid),
UNIQUE KEY smtpid (smtpid), KEY messages_senderid (senderid), KEY messages_subject (subject) ) TYPE=MyISAM;
CREATE TABLE people (
personid int(10) unsigned NOT NULL auto_increment, email varchar(255) default NULL,
name varchar(255) default NULL, title varchar(255) default NULL, enron tinyint(3) unsigned default NULL, msgsent int(10) unsigned default NULL, msgrec int(10) unsigned default NULL, PRIMARY KEY (personid),
UNIQUE KEY email (email) ) TYPE=MyISAM;
--CREATE TABLE recipients (
recipientid int(10) unsigned NOT NULL auto_increment, messageid int(10) unsigned default NULL,
reciptype enum('bcc','cc','to') default NULL, reciporder int(10) unsigned default NULL, personid int(10) unsigned default NULL, PRIMARY KEY (recipientid),
KEY messageid (messageid) ) TYPE=MyISAM;
By contrast, in Agile Big Data we use dataflow languages to define the form of our data in code, and then we publish it directly to a document store without ever formally specifying a schema! This is optimized for our process: doing data science, where we’re
deriving new information from existing data. There is no benefit to externally specifying schemas in this context—it is pure overhead. After all, we don’t know what we’ll wind up with until it’s ready! Data science will always surprise.
However, relational structure does have benefits. We can see what time users send emails
very easily with a simple select/group by/order query:
select senderid as id,
hour(messagedt) as sent_hour, count(*)
which results in this simple table:
+---+---+---+
Relational databases split data up into tables according to its structure and precompute indexes for operating between these tables. Indexes enable these systems to be respon‐ sive on a single computer. Declarative programming is used to query this structure.
This kind of declarative programming is ideally suited to consuming and querying structured data in aggregate to produce simple charts and figures. When we know what we want, we can efficiently tell the SQL engine what that is, and it will compute the relations for us. We don’t have to worry about the details of the query’s execution.
NoSQL
In contrast to SQL, when building analytics applications we often don’t know the query we want to run. Much experimentation and iteration is required to arrive at the solution to any given problem. Data is often unavailable in a relational format. Data in the wild is not normalized; it is fuzzy and dirty. Extracting structure is a lengthy process that we perform iteratively as we process data for different features.
For these reasons, in Agile Big Data we primarily employ imperative languages against distributed systems. Imperative languages like Pig Latin describe steps to manipulate data in pipelines. Rather than precompute indexes against structure we don’t yet have, we use many processing cores in parallel to read individual records. Hadoop and work queues make this possible.
In addition to mapping well to technologies like Hadoop, which enables us to easily scale our processing, imperative languages put the focus of our tools where most of the work in building analytics applications is: in one or two hard-won, key steps where we do clever things that deliver most of the value of our application.
Compared to writing SQL queries, arriving at these clever operations is a lengthy and often exhaustive process, as we employ techniques from statistics, machine learning, and social network analysis. Thus, imperative programming fits the task.
To summarize, when schemas are rigorous, and SQL is our lone tool, our perspective comes to be dominated by tools optimized for consumption, rather than mining data. Rigorously defined schemas get in the way. Our ability to connect intuitively with the data is inhibited. Working with semistructured data, on the other hand, enables us to focus on the data directly, manipulating it iteratively to extract value and to transform it to a product form. In Agile Big Data, we embrace NoSQL for what it enables us to do.
Serialization
Although we can work with semistructured data as pure text, it is still helpful to impose some kind of structure to the raw records using a schema. Serialization systems give us this functionality. Available serialization systems include the following:
Thrift: http://thrift.apache.org/
Protobuf: http://code.google.com/p/protobuf/
Avro: http://avro.apache.org/
Although it is the least mature of these options, we’ll choose Avro. Avro allows complex data structures, it includes a schema with each file, and it has support in Apache Pig. Installing Avro is easy, and it requires no external service to run.
We’ll define a single, simple Avro schema for an email document as defined in RFC-5322. It is well and good to define a schema up front, but in practice, much pro‐ cessing will be required to extract all the entities in that schema. So our initial schema might look very simple, like this:
{
We might extract only a thread_id as a unique identifier, and then store the entire raw
email string in a field on its own. If a unique identifier is not easy to extract from raw records, we can generate a UUID (universally unique identifier) and add it as a field.
Our job as we process data, then, is to add fields to our schema as we extract them, all the while retaining the raw data in its own field if we can. We can always go back to the mother source.
Extracting and Exposing Features in Evolving Schemas
As Pete Warden notes in his talk “Embracing the Chaos of Data”, most freely available
data is crude and unstructured. It is the availability of huge volumes of such ugly data, and not carefully cleaned and normalized tables, that makes it “big data.” Therein lies the opportunity in mining crude data into refined information, and using that infor‐ mation to drive new kinds of actions.
Extracted features from unstructured data get cleaned only in the harsh light of day, as users consume them and complain; if you can’t ship your features as you extract them, you’re in a state of free fall. The hardest part of building data products is pegging entity and feature extraction to products smaller than your ultimate vision. This is why sche‐ mas must start as blobs of unstructured text and evolve into structured data only as features are extracted.
Features must be exposed in some product form as they are created, or they will never achieve a product-ready state. Derived data that lives in the basement of your product is unlikely to shape up. It is better to create entity pages to bring entities up to a
“consumer-grade” form, to incrementally improve these entities, and to progressively combine them than to try to expose myriad derived data in a grand vision from the get-go.
While mining data into well-structured information, using that information to expose new facts and make predictions that enable actions offers enormous potential for value creation. Data is brutal and unforgiving, and failing to mind its true nature will dash the dreams of the most ambitious product manager.
As we’ll see throughout the book, schemas evolve and improve, and so do features that expose them. When they evolve concurrently, we are truly agile.
Data Pipelines
We’ll be working with semistructured data in data pipelines to extract and display its different features. The advantage of working with data in this way is that we don’t invest time in extracting structure unless it is of interest and use to us. Thus, in the principles of KISS (Keep It Simple, Stupid!) and YAGNI (You Ain’t Gonna Need It), we defer this overhead until the time of need. Our toolset helps make this more efficient, as we’ll see in Chapter 3.
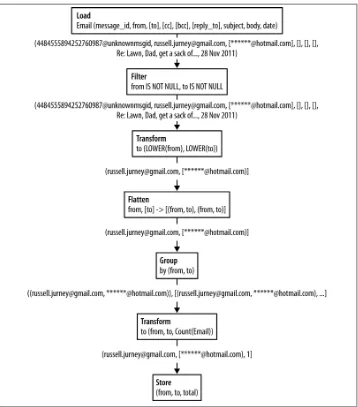
Figure 2-3 shows a data pipeline to calculate the number of emails sent between two email addresses.
Figure 2-3. Simple dataflow to count the number of emails sent between two email ad‐ dresses
While this dataflow may look complex now if you’re used to SQL, you’ll quickly get used to working this way and such a simple flow will become second nature.
Data Perspectives
To start, it is helpful to highlight different ways of looking at email. In Agile Big Data, we employ varied perspectives to inspect and mine data in multiple ways because it is
easy to get stuck thinking about data in one or two ways that you find productive. Next, we’ll discuss the different perspectives on email data we’ll be using throughout the book.
Networks
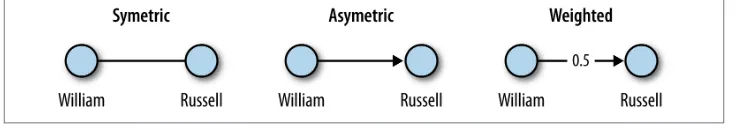
A social network is a group of persons (egos) and the connections or links between them. These connections may be directed, as in “Bob knows Sara.” Or they may be undirected: “Bob and Sara are friends.” Connections may also have a connection strength, or weight. “Bob knows Sara well,” (on a scale of 0 to 1) or “Bob and Sara are married” (on a scale of 0 to 1).
The sender and recipients of an email via the from, to, cc, and bcc fields can be used to
create a social network. For instance, this email defines two entities, russell.ju
[email protected] and ******@hotmail.com.
From: Russell Jurney <[email protected]> To: ******* Jurney <******@hotmail.com>
The message itself implies a link between them. We can represent this as a simple social
network, as shown in Figure 2-4.
Figure 2-4. Social network dyad
Figure 2-5 depicts a more complex social network.
Figure 2-5. Social network
Figure 2-6 shows a social network of some 200 megabytes of emails from Enron.
Figure 2-6. Enron corpus viewer, by Jeffrey Heer and Andrew Fiore
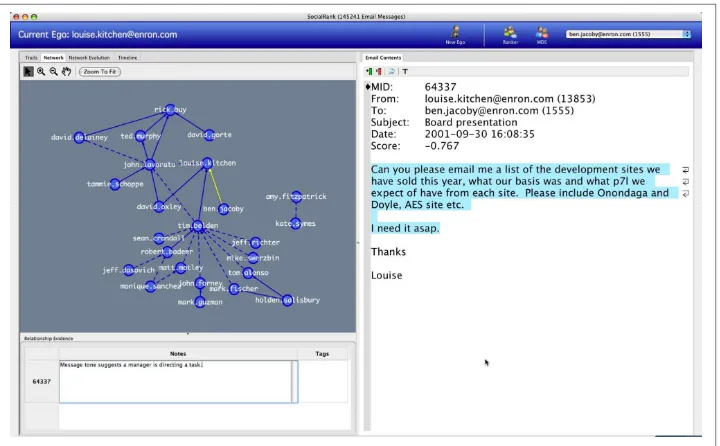
Social network analysis, or SNA, is the scientific study and analysis of social networks. By modeling our inbox as a social network, we can draw on the methods of SNA (like PageRank) to reach a deeper understanding of the data and of our interpersonal net‐
work. Figure 2-7 shows such an analysis applied to the Enron network.
Figure 2-7. Enron SocialRank, by Jaime Montemayor, Chris Diehl, Mike Pekala, and David Patrone
Time Series
A time series is a sequence of data points ordered by a timestamp recorded with each value. Time series allow us to see changes and trends in data over time. All emails have
timestamps, so we can represent a series of emails as a time series, as Figure 2-8 dem‐
onstrates.
Date: Mon, 28 Nov 2011 14:57:38 -0800
Looking at several other emails, we can plot the raw data in a time series.
Figure 2-8. Raw time series
Since we aren’t looking at another value associated with the time series, we can see the
data more clearly by bucketing it by day (see Figure 2-9). This will tell us how many
emails were sent between these two addresses per day.
Figure 2-9. Grouped time series
Time series analysis might tell us when we most often receive email from a particular person or even what that person’s work schedule is.
Natural Language
The meat of an email is its text content. Despite the addition of MIME for multimedia attachments, email is still primarily text.
Subject: Re: Lawn
Content-Type: text/plain; charset=ISO-8859-1
Dad, get a sack of Rye grass seed and plant it over there now. It will build up a nice turf over the winter, then die off when it warms up. Making for good topsoil you can plant regular grass in.
Will keep the weeds from taking over.
Russell Jurney twitter.com/rjurney [email protected] datasyndrome.com
We might analyze the body of the email by counting its word frequency. Once we remove
noncoding common stopwords (like of and it), this looks like Figure 2-10.
Figure 2-10. Email body word frequency
We might use this word frequency to infer that the topics of the email are plant and
grass, as these are the most common words. Processing natural language in this way helps us to extract properties from semistructured data to make it more structured. This enables us to incorporate these structured properties into our analysis.
A fun way to show word frequency is via a wordle, illustrated in Figure 2-11.
Figure 2-11. Email body wordle
Probability
In probability theory, we model seemingly random processes by counting the occur‐ rence and co-occurence of different properties in our data to create probability distri‐ butions. We can then employ these probability distributions to make suggestions and to classify entities into different categories.
We can use probability distributions to make predictions. For instance, we might create a probability distribution for our sent emails using the from, to, and cc fields. Given that
our email address, [email protected], appears in the from field, and another
email address appears in the to field, what is the chance that another email will appear
cc‘d?
In this case, our raw data is the to, from, and cc fields from each email:
From: Russell Jurney <[email protected]> To: ****** Jurney <******@hotmail.com>
Cc: Ruth Jurney <****@hotmail.com>
First, we count the pairs of from email addresses with to email addresses. This is called the co-occurrence of these two properties. Let’s highlight one pair in particular, those
emails between O’Reilly editor Mike Loukides and me (Table 2-1).
Table 2-1. Totals for to, from pairs
From To Count
[email protected] ****[email protected] 10
[email protected] [email protected] 10
[email protected] yoga*****@gmail.com 11
[email protected] [email protected] 14
[email protected] *****@hotmail.com 15
[email protected] [email protected] 28
[email protected] [email protected] 44
Dividing these values by the total number of emails gives us a probability distribution characterizing the odds that any given email from our email address will be to any given email (Table 2-2).
Table 2-2. P(to|from): probability of to, given from
From To Probability
[email protected] ****[email protected] 0.0359
[email protected] [email protected] 0.0359
[email protected] yoga*****@gmail.com 0.0395
[email protected] [email protected] 0.0503
[email protected] *****@hotmail.com 0.0539
[email protected] [email protected] 0.1007
[email protected] [email protected] 0.1582
Finally, we list the probabilities for a pair recipients co-occurring, given that the first
address appears in an email (Table 2-3).
Table 2-3. P(cc|from ∩ to): probability of cc, given from and to
From To Cc Probability
[email protected] [email protected] [email protected] 0.0357
[email protected] [email protected] [email protected] 0.25
[email protected] [email protected] [email protected] 0.25
[email protected] [email protected] [email protected] 0.1
[email protected] [email protected] [email protected] 0.2
We can then use this data to show who else is likely to appear in an email, given a single address. This data can be used to drive features like Gmail’s suggested recipients feature,
as shown in Figure 2-12.
Figure 2-12. Gmail suggested recipients
We’ll see later how we can use Bayesian inference to make reasonable suggestions for
recipients, even when Table 2-3 is incomplete.
Conclusion
As we’ve seen, viewing semistructured data according to different algorithms, struc‐ tures, and perspectives informs feature development more than normalizing and view‐ ing it in structured tables does. We’ll be using the perspectives defined in this chapter to create features throughout the book, as we climb the data-value pyramid. In the next chapter, you’ll learn how to specify schemas in our analytic stores using Apache Pig directly.
CHAPTER 3
Agile Tools
This chapter will briefly introduce our software stack. This stack is optimized for our process. By the end of this chapter, you’ll be collecting, storing, processing, publishing, and decorating data. Our stack enables one person to do all of this, to go “full stack.” We’ll cover a lot, and quickly, but don’t worry: I will continue to demonstrate this soft‐ ware stack in Chapters 5 through 10. You need only understand the basics now; you will get more comfortable later.
We begin with instructions for running our stack in local mode on your own machine. In the next chapter, you’ll learn how to scale this same stack in the cloud via Amazon Web Services. Let’s get started.
Code examples for this chapter are available at https://github.com/rjurney/
Agile_Data_Code/tree/master/ch03. Clone the repository and follow along!
git clone https://github.com/rujrney/Agile_Data_Code.git
Scalability = Simplicity
As NoSQL tools like Hadoop, MongoDB, data science, and big data have developed, much focus has been placed on the plumbing of analytics applications. This book teaches you to build applications that use such infrastructure. We will take this plumbing for granted and build applications that depend on it. Thus, this book devotes only two chapters to infrastructure: one on introducing our development tools, and the other on scaling them up in the cloud to match our data’s scale.
In choosing our tools, we seek linear scalability, but above all, we seek simplicity. While the concurrent systems required to drive a modern analytics application at any kind of scale are complex, we still need to be able to focus on the task at hand: processing data to create value for the user. When our tools are too complex, we start to focus on the tools themselves, and not on our data, our users, and new applications to help them.
An effective stack enables collaboration by teams that include diverse sets of skills such as design and application development, statistics, machine learning, and distributed systems.
The stack outlined in this book is not definitive. It has been selected as an example of the kind of end-to-end setup you should expect as a developer or should aim for as a platform engineer in order to rapid‐ ly and effectively build analytics applications. The takeaway should be an example stack you can use to jumpstart your application, and a standard to which you should hold other stacks.
Agile Big Data Processing
The first step to building analytics applications is to plumb your application from end to end: from collecting raw data to displaying something on the user’s screen (see
Figure 3-1). This is important, because complexity can increase fast, and you need user feedback plugged into the process from the start, lest you start iterating without feedback (also known as the death spiral).
Figure 3-1. Flow of data processing in Agile Big Data
The components of our stack are thus:
• Events are the things logs represent. An event is an occurrence that happens and is logged along with its features and timestamps.
Events come in many forms—logs from servers, sensors, financial transactions, or actions our users take in our own application. To facilitate data exchange among different tools and languages, events are serialized in a common, agreed-upon for‐ mat.
• Collectors are event aggregators. They collect events from numerous sources and log them in aggregate to bulk storage, or queue them for action by sub-real-time workers.
• Bulk storage is a filesystem capable of parallel access by many concurrent processes. We’ll be using S3 in place of the Hadoop Distributed FileSystem (HDFS) for this purpose. HDFS sets the standard for bulk storage, and without it, big data would not exist. There would be no cheap place to store vast amounts of data where it can
be accessed with high I/O throughput for the kind of processing we do in Agile Big Data.
• Distributed document stores are multinode stores using document format. In Agile Big Data, we use them to publish data for consumption by web applications and other services. We’ll be using MongoDB as our distributed document store.
• A minimalist web application server enables us to plumb our data as JSON through
to the client for visualization, with minimal overhead. We use Python/Flask. Other examples are Ruby/Sinatra or Node.js.
• A modern browser or mobile application enables us to present our data as an in‐
teractive experience for our users, who provide data through interaction and events describing those actions. In this book, we focus on web applications.
This list may look daunting, but in practice, these tools are easy to set up and match the crunch points in data science. This setup scales easily and is optimized for analytic processing.
Setting Up a Virtual Environment for Python
In this book, we use Python 2.7, which may or may not be the version you normally use.
For this reason, we’ll be using a virtual environment (venv). To set up venv, install the
virtualenv package.
With pip:
pip install virtualenv
With easy_install:
easy_install virtualenv
I have already created a venv environment in GitHub. Activate it via:
source venv/bin/activate
If, for some reason, the included venv does not work, then set up your virtual environ‐ ment as follows:
virtualenv -p `which python2.7` venv --distribute source venv/bin/activate
Now you can run pip install -r requirements.txt to install all required packages,
and they will build under the venv/ directory.
To exit your virtual environment:
deactivate
Serializing Events with Avro
In our stack, we use a serialization system called Avro (see Figure 3-2). Avro allows us
to access our data in a common format across languages and tools.
Figure 3-2. Serializing events
Avro for Python
Installation
To install Avro for Python, you must first build and install the snappy compression
library, available at http://code.google.com/p/snappy/. Using a package manager to do so
is recommended. Then install python-snappy via easy_install, pip, or from the source at https://github.com/andrix/python-snappy. With python-snappy installed, Avro for Python should install without problems.
To install the Python Avro client from source:
[bash]$ git clone https://github.com/apache/avro.git [bash]$ cd avro/lang/py
[bash]$ python setup.py install
To install using pip or easy_install:
pip install avro
easy_install avro
Testing
Try writing and reading a simple schema to verify that our data works (see Example 3-1):
[bash]$ python
Example 3-1. Writing avros in python (ch03/python/test_avro.py)
# Derived from the helpful example at
http://www.harshj.com/2010/04/25/writing-and-reading-avro-data-files-using-python/
from avro import schema, datafile, io
import pprint
OUTFILE_NAME = '/tmp/messages.avro' SCHEMA_STR = """{
"type": "record", "name": "Message", "fields" : [
{"name": "message_id", "type": "int"},
{"name": "topic", "type": "string"}, {"name": "user_id", "type": "int"} ]
}"""
SCHEMA = schema.parse(SCHEMA_STR) # Create a 'record' (datum) writer rec_writer = io.DatumWriter(SCHEMA)
# Create a 'data file' (avro file) writer df_writer = datafile.DataFileWriter( open(OUTFILE_NAME, 'wb'),
rec_writer,
writers_schema = SCHEMA )
df_writer.append( {"message_id": 11, "topic": "Hello galaxy", "user_id": 1} ) df_writer.append( {"message_id": 12, "topic": "Jim is silly!", "user_id": 1} ) df_writer.append( {"message_id": 23, "topic": "I like apples.", "user_id": 2} ) df_writer.close()
Verify that the messages are present:
[bash]$ ls -lah /tmp/messages.avro
-rw-r--r-- 1 rjurney wheel 263B Jan 23 17:30 /tmp/messages.avro
Now verify that we can read records back (Example 3-2).
Example 3-2. Reading avros in Python (ch03/python/test_avro.py)
from avro import schema, datafile, io
import pprint
# Test reading avros
rec_reader = io.DatumReader()
# Create a 'data file' (avro file) reader df_reader = datafile.DataFileReader( open(OUTFILE_NAME),
rec_reader )
# Read all records stored inside pp = pprint.PrettyPrinter()
for record in df_reader: pp.pprint(record)
The output should look like this:
{u'message_id': 11, u'topic': u'Hello galaxy', u'user_id': 1} {u'message_id': 12, u'topic': u'Jim is silly!', u'user_id': 1} {u'message_id': 23, u'topic': u'I like apples.', u'user_id': 2}
Collecting Data
We’ll be collecting your own email via IMAP, as shown in Figure 3-3, and storing it to
disk with Avro (Figure 3-3). Email conforms to a well-known schema defined in
RFC-2822. We’ll use a simple utility to encapsulate the complexity of this operation. If an error or a slow Internet connection prevents you from downloading your entire inbox, that’s OK. You only need a few megabytes of data to work the examples, although more data makes the examples richer and more rewarding.
Figure 3-3. Collecting data via IMAP
Example 3-3. Avro schema for email (ch03/gmail/email.avro.schema)
{
"type":"record", "name":"Email", "fields":[