103
SHIFT SECTOR ANALYSIS OF ECONOMY
IN MAMMINASATA REGION
Fadhila Ratu Pratiwi1, Moh Khusaini2, Susilo3 123
Faculty of Economics and Business, Brawijaya University, Malang Email: [email protected]
Abstract
Mamminasata region which is located in South Sulawesi Province consists of Makassar City, Maros District, Gowa District and Takalar District. The districts have sourced leading sectors which can contribute to each area. This study aims to determine whether the leading sector have a shift sector in the Mamminasata region by using shift share tools analysis to find competitive sector. This study uses secondary GDP (Gross Domestic Product) data from Central Bureau of Statistics South Sulawesi Province in 2006 and 2013. Based on the results, Makassar City does not have a shift sector and the trade sector is not a competitive sector. Maros District has a shift from agriculture to industry but this sector is a competitive sector. Gowa District does not have a shift sector in agriculture sector and this sector is not competitive sector. It differs from Takalar District which does not have a shift sector in agriculture sector and fishery sector is competitive.
Keywords: shift sector, competitive sector, shift share
1. INTRODUCTION
Mamminasata region was formed by decree of the Governor of South Sulawesi Province in 2003 consist of Makassar City, Maros District, Gowa District, and Takalar District. Each region has leading sector who give contribution to increase local revenue.
Todaro (2000) says that the process of economic growth has a close connection with structural changes and high sector. Some changes in the main components of these structures are gradually shifting agriculture activity to the non-agriculture sector and industry sector to the services sector.
Based on comparative quantitative empirical studies whose include a number of developing countries, it can be observed several phenomena that appear through in the process structural shift. In general, it can be said that the common transformation was signed by the change and the shift from activity in the primary production sector (agriculture, mining) to the secondary production sector (manufacture industry, construction) and the tertiary sector (services). The level of productivity is different according to the sector. Similarly, there is differences in the rate growth rapid between the sectors activity of activity related (Djojohadikusumo, 1994;92).
In general, the process of change of economic structure was marked by (1) the declining in the share of the primary sector (agriculture); (2) increasing share of the secondary sector (industry); and (3) the share of the tertiary sector (service) more or less constant, but its contribution will increase along with economy growth. For analyzing the structure changes in the economy, then the main theory which commonly referenced is the theory of structural transformation. The structural transformation of production was showed that in line with the increased income per capita, the country’s economy will shift from the original rely on the agriculture sector which was decreased when the moment Gross National Product (GNP)/ per capita increase (Kuncoro, 2007 in Arham 2014).
Samuleson in Tarigan (2005) with Turnpike economy theory was emphasized that a region needs to know which sector has a great potential to be developed rapidly because the sector has nature potential and a competitive advantage.
chance and role of government) (Porter, 1990 in Daryanto, 2010).
According to Bank Indonesia, Gross Domestic Regional Product (GDRP) is one of the most important thing to determine the economy condition in an area. Therefore the government needs to know whether the sector which has the highest value GDRP is the dominant sector that has not had sector a shift in the region and to know which sector has a competitive or competitiveness value.
Based on the explanation above, this research has a purpose to determine the sector that shifts considered in Mamminasata region and to determine a competitive sector.
2. RESEARCH METHOD
Shift-share analysis is a descriptive analysis by simple methods used to calculate the level of competitiveness in a region. Shift-share analysis is an analysis tool to determine changes and sector shift in the industrial in the regional or local economy. Shift-share analysis can described the performance of sectors in a region compared to the national economy. When a region to make progress according to their situation in the national economy, it will be found that there is a shifting with the result of regional economy development. In addition, the rate growth sectors in the region will be compared to the rate growth of the national economy along with sectors. Then analysis of the deviations when they occur as a result of those compared. If the deviation is positive, it is called the competitive advantage of a sector in the region (Soepono, 1993;44).
Shift-share analysis is a useful technique to analyze changes in the economy structure region compared to the national economy. The purpose is to determine the performance or productivity of the economy region compared with a large region (regional/national).
This analysis assumes that changes in income, production, or labor in the region can be divided in three component regional growth component, proportional or industrial mix growth component, and regional share growth component (Daryanto, Arief, and Hafizrianda, Yundy 2010:25).
There is three variables decomposition become component of deviation ∆Yi , is regional growth component (RG), proportional or industrial mix growth component (PG), and
regional share growth component (RSG). The equation becomes:
∆Yi= PRij+ PPij+ PPWij (1)
or detail can be declared
Y′ij − Yij = ∆Yij(Ra − 1) + Yij(Ri − Ra) +
Yij(ri − Ri) (2)
Where:
∆Yi = changes in income subsector-i in
region -j
Yij = GDRP subsector -i in district/city in basis year analysis
Y′ij = GDRP subsector-i in district/city in
end year analysis
Yi = GDRP subsector-i in all region research at basis year analysis
Y′i = GDRP subsector-i in all region research at end year analysis
Y.. = GDRP all subsector-i at basis year analysis
Y′.. = GDRP all subsector -i at basis year analysis
Ra = Y′. ./Y..
Ri = Y′i/Yi
ri = Y′ij/Yij
The conclusion that can be obtained:
1. Regional Growth (RG) which has positive value means that the region is growing faster than the average growth province. Meanwhile, the negative sign gives an indication that a regional growth is slower than the average province growth. 2. Proportional Growth (PG) which has
positive value gives an indication that sector-i (regional) is rapid sector, the sector is growing faster than the economy growth in totality and negative values indicate that the sector is slow.
3. Regional share growth (RSG) indicates competitiveness which has a sector-i in a region compared to the same sector in the region of comparison (the region one or two level above, or used a national scope).
3. RESEARCH RESULT
Mamminasata region. According to Table 1 shows that trade sector in 2006 and 2013 continued to increase to 6,366,69 million rupiahs consisting of contributing restaurant and hotel. Meanwhile, the sector is the lowest contribution to the mining sector with declining contributions.
Table 1. Gross Domestic Regional Product Makassar City in the year 2006 and 2013
(Million rupiahs)
Economy Sector Year 2006 2013
Agriculture 101,03 105,13
Mining 1,32 0,54
Industry 2,622,98 3,927,94
Electricity 220,64 406,71
Construction 888,13 1,799,09
Trade 3,219,69 6,366,69
Transport 1,805,08 4,032,65
Finance 1,155,81 2,776,90
Services 1,330,13 1,911,58
Source: BPS Prov.Sulawesi Selatan 2007&2014
Result of shift share analysis for Makassar city in Table 2 shows that the sector was not shifted, it can be seen from the total value of trade sector is 3,147.0 but the RSG column or Regional Share Growth the value trade sector is negative -139.4. It means that this sector, not competitiveness although this sector continues to develop in number due to the needs of society in this sector increased. This sector has characteristic seasonally on the specific time, the sector has experience increase such as a hotel in the holiday season or when there is a big event that is held by Makassar City.
According to Table 2 regional growth (RG) turned out to be a sector that has been the fastest growth in Makassar City. The trade sector has the highest value RG of the whole sector that is 2,105.4; then the industry sector is 1,715.2 and the transportation is 1,180.4.
For the proportional growth (PG) the industry sector and the service sector has a negative value indicates that the sector is not the leading sector in the Makassar City.
The sector has been competitive or competitiveness value indicated at RSG column in Table 2 is the transport sector with a value 61.6 and the service sector value is 51.8. The transport sector one of which is a sea transportation activities include freight
transport and passengers operation at sea and seafront using ship operated by the shipping company. The cruise activity is divided to the ocean, the archipelago, between the island, the boat for local society (BPS Makassar City, 2013). Besides, service sector has an important role in Makassar city because society needs quite a lot so that this sector employs many labors.
Table 2. Shift Share Analysis Makassar City In the year 2006 and 2013
Source: BPS, processed in 2016
The located Makassar City as a gateway to eastern Indonesia has made transportation and the telecommunication sector with the value GDRP 4,032,65 rupiahs and in third place the GDRP capable competitive and got supported by the government in promoting this sector. The support is to improve facilities transportation on sea, air, and land. The higher mobility of people who use sea transport for crossing between islands because the cost is cheaper. The economic development of the port at Soekarno-Hatta in Makassar gives serves to various types of boat and activity related to shipping commodity.
Beside that airport of Makassar City since 2008 has been repaired the facilities to become international airport make this airport as one of the airport with the route many passed or transit by passengers who will travel to the eastern part of Indonesia or the western part of Indonesia. The government should repair facilities in order to support the comfort of passengers using the airport facility.
3.2. Shift Share Analysis in Maros District
the sector which has the lower contribution is electricity with a contribution 13,56 million rupiahs in 2013.
Table 3. Gross Domestic Regional Product Maros District in 2006 and 2013
(Million rupiahs)
Economy sector Year 2006 2013
Agriculture 383,05 513,12
Mining 14,12 23,05
Industry 198,25 388,16
Electricity 7,07 13,56
Construction 13,86 32,09
Trade 72,86 127,32
Transport 48,69 85,46
Finance 52,35 98,00
Services 126,32 175,16
Source: BPS Prov.Sulawesi Selatan 2007&2014
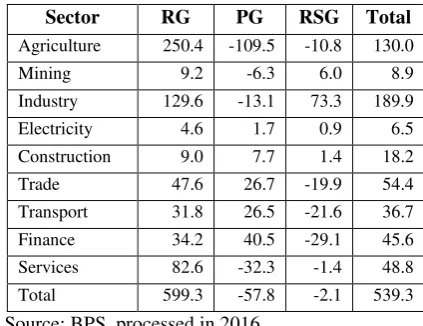
The result of shift share analysis for Maros District in Table 4 shows that sector shift from agriculture sector to industry. This can be seen from the total value industrial sector that is 189.9 while the total value of agriculture sector is 130.0 has shifted for agricultural land converted to residential needs society about the residence.
According to Table 4 regional growth (RG) turned out to be sector that has the fastest growth in Maros District compared with an average growth of South Sulawesi province is the agriculture sector which has the highest value from all sector is 250.4 then the industry sector 129.6 and the service sector 82.6 For proportional growth (PG), although the agriculture sector growing the fastest but based on the result of shift share analysis that sector is not rapid sector. This situation reflected in the value component PG negative is -109.5.
According to Table 4, Maros District has competitiveness or competitive can be seen in the value column (RSG) or regional share growth there is four sector is the industry sector as 73.3; the mining and quarrying sector as 6.0; the construction sector as 1.42 and the electricity sector is 0.9.
In this case, the industry sector has a higher value between these four sectors than the competitive capability with others sector. The most competitive is industry a sector, it has been supported by availability of land a sizeable
for the development of industrial area, this time, industrial area that is generally integrated with Makassar Industrial Area (MIA).
Table 4. Shift Share Analysis Maros District in 2006 and 2013
Sector RG PG RSG Total
Agriculture 250.4 -109.5 -10.8 130.0
Mining 9.2 -6.3 6.0 8.9
Industry 129.6 -13.1 73.3 189.9
Electricity 4.6 1.7 0.9 6.5
Construction 9.0 7.7 1.4 18.2
Trade 47.6 26.7 -19.9 54.4
Transport 31.8 26.5 -21.6 36.7
Finance 34.2 40.5 -29.1 45.6
Services 82.6 -32.3 -1.4 48.8
Total 599.3 -57.8 -2.1 539.3
Source: BPS, processed in 2016
Meanwhile, the construction sector has a positive value meaning that the sector is competitive because of the developing construction as the department store as shop place and more increasing residential buildings.
3.3. Shift Share Analysis in Gowa District
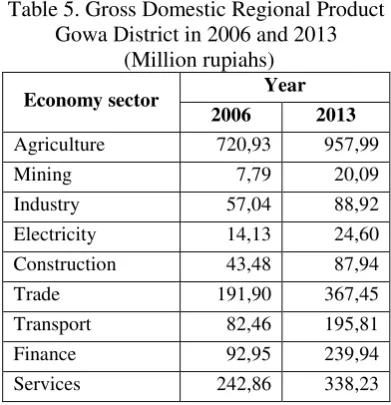
Contribute GDRP to Gowa District according to Table 5 showed that the agriculture sector in 2006 and 2013 constantly increasing is Rp957,99 million. Meanwhile, the lowest sector contribution that the mining sector is Rp 20,90 million.
The result of shift share analysis for Gowa District on Table 6 shows that it is not shift sector. In this case, it could be seen the total value for agriculture sector is 237.0 but RSG column or regional shift growth value of the agriculture sector is negative (-28.2). It means that this sector is not competitive because agriculture land declines for the residence construction. Besides, the using technology tools for agriculture sector is needed to accelerate process their production.
Table 5. Gross Domestic Regional Product Gowa District in 2006 and 2013
(Million rupiahs)
Economy sector Year 2006 2013
Agriculture 720,93 957,99
Mining 7,79 20,09
Industry 57,04 88,92
Electricity 14,13 24,60
Construction 43,48 87,94
Trade 191,90 367,45
Transport 82,46 195,81
Finance 92,95 239,94
Services 242,86 338,23
Source: BPS Prov.Sulawesi Selatan 2007&2014 For proportional growth (PG) although the agriculture sector grows rapidly, but based on the result shift share indicates that the sector is not a rapid sector. This is reflected in the value of the PG that is negative -206.1. Besides that the service sector negative -62.1 but most sector proportional growth is positive.
Table 6. Shift Share Analysis Gowa District in 2006 and 2013 Gowa District, sector that has competitiveness contained in the transportation and telecommunication sector is 14.4; the finance sector, real estate is 14.1 then the mining and quarrying sector are 10.7. In this case, the three sectors can be competitive with other sectors and become an economic movement.
The transportation and telecommunication sector has the highest value because using communication tools is increasing as the use of telephone. Furthermore, finance sector has increased for the acceleration of social and economy activity of society in Gowa District whose borderline Makassar City.
3.4. Shift Share Analysis in Takalar District The Takalar district is region which has a contribution is the mining sector.
Result of shift share analysis for Takalar District on Table 8 shows no shift in the sector. It can be seen from the total value for the agriculture sector is 201.9
In the RSG column or regional share growth value the agriculture sector is 76.8. It means that the sector is competitive with other sectors by region comparison. Meanwhile the service sector with a positive value is 21.6 as the second sector which shows that the sector is competitive, the mining sector is 0.5 and the electricity is 2.0.
Table 7. Gross Domestic Regional Product Takalar District in 2006 and 2013
(Million rupiahs)
Economy Sector Year 2006 2013
Agriculture 339,92 541,87
Mining 5,22 6,80
Industry 63,04 78,69
Electricity 7,62 16,57
Construction 37,58 56,35
Trade 76,68 131,51
Transport 33,81 53,50
Finance 42,24 73,69
Services 104,56 167,79
Source: BPS Prov.Sulawesi Selatan 2007&2014 According to regional growth (RG) turns the agriculture sector which has the fastest growth compared with others sector and has a value 222.2 then the services sector 68.3 and the trade sector value is 50.1.
Table 8. Shift Share Analysis Takalar District
Source: BPS, processed in 2016
The agriculture sector in Takalar district for fishery has the highest contribution because its location in the coastal sea that products can be exported, besides that household fisher, also cultivate product the sea that has a trading value.
4. CONCLUSION AND SUGGEST
The result of shift share analysis showed that Makassar city has a good trade sector in terms facilities and infrastructure owned until no shifting, but the sector is not competitive because it has a seasonal time, meanwhile the transportation sector is a sector that can be competitive with other sectors. Different from Maros district which has a high contribution of the agriculture sector but since it has shifted since industry sector has an area industry integrated with Makassar city, and therefore industrial sector has competitiveness with other sectors.
Gowa District does not have a shifting sector but the agriculture sector is not competitive with other sector but the transport sector and Takalar district have a high contribute in agriculture sector especially fishery because to fisheries excellent facilities owned so the sector has not shifted and the sector is competitive.
There is a shifting sector which make the government more focused on the development of the most advanced sector in the region so that the sector can have competitiveness with other regions. In addition, government assistance for leading sector which have shift is expected to be further enhanced as the agriculture sector because this sector is the dominant sector with a lot of society working in this sector.
5. ACKNOWLEDGMENTS
Allhamdulillahirobbil’alamin, Thank You
to Allah SWT for all grateful things because
as co-Supervisor; and my friends PMIE UB
2013.
6. REFERENCES
Arham, Muhammad Amir. 2014. Kebijakan Desentralisasi Fiskal, Pergeseran Sektor, dan Ketimpangan Pendapatan Antarkabupaten/Kota di Sulawesi
Tengah. Jurnal Ekonomi dan
Pembangunan Indonesia. Vol.14 No.2. Daryanto, Arief dan Hafizrianda. 2010.
Model-Model Kuantitatif. Bogor: PT. Penerbit IPB Press.
Djojohadikusumo, Sumitro. 1994. Dasar Teori Ekonomi Pertumbuhan dan Ekonomi Pembangunan. Jakarta: LP3ES.
Soepono, Prasetyo. 1993. Analisis Shift-Share : Perkembangan dan Penerapan. Jurnal Ekonomi dan Bisnis Indonesia. Vol. VIII. No.1 (43-54) Fakultas Ekonomi, Universitas Gajah Mada, Yogyakarta. Tarigan, Robinson. 2005. Perencanaan
Pembangunan Wilayah. Jakarta: Bumi Aksara.
Todaro, MP dan Smith Stephen C. 2000.
Pembangunan Ekonomi. Edisi ketujuh Jilid 1. Jakarta: Penerbit Erlangga. ______, BPS Provinsi Sulawesi Selatan. 2007
dan 2014. Sulawesi Selatan Dalam Angka.
______, Produk Domestik Regional Bruto.
Bank Indonesia.
http://www.bi.go.id/id/statistik/metadat a/sekda/Documents/8PDRBSEKDA1.p df (accessed on April 5, 2016).