Effect of Reducing Sugar and Total Nitrogen to Ethanol Production from
Molasses by Saccharomyces cerevisiae
Ekwan Nofa Wiratno
1*, Tri Ardyati
1, Agustin Krisna Wardani
21
Department of Biology, Faculty of Mathematics and Natural Sciences, University of Brawijaya, Malang, Indonesia
2
Department of Agricultural Product Technology, Faculty of Agriculture Technology, University of Brawijaya, Malang, Indonesia
Abstract
Indonesia's oil production has declined, while demand for derivative products is increasing. Objective of this research are to understand effect of reducing sugar and total nitrogen variation to ethanol production and fermentation efficiency, cell viability, acidity, temperature, dissolved oxygen with molasses by Saccharomyces cerevisiae (SAF Instant). Step of this research consist of determination of reducing sugar, ethanol fermentation, total nitrogen determination, ethanol determination and data analysis. Treatment of reducing sugar (GR) and total nitrogen (N) (g.L-1) that are GR 100 N 0, GR 100 N 6, GR 100 N 10, GR 125 N 0, GR 125 N 6 and GR 125 N 10. Fermentation was carried out for 72 hours with three replications. Observation parameters every 24 hours are ethanol and reducing sugar concentration, temperature, acidity and dissolved oxygen. Highest ethanol resulted from GR 125 N 6 (3.68 g.L-1) and GR 100 N 6 (3.53 g.L-1). Low reducing sugar consumption inhibited by by-product of yeast metabolism and molasses chemical compound, lead leaves high sugar concentration (> 80 g.L-1). GR 100 N 6 and GR 125 N 6 have highest fermentation efficiency (69 and 57
%). There was no increase in temperature and decrease in pH significantly (α>0.05). Dissolved oxygen decreased significantly (α>0.05) at the early of fermentation and decrease until the end of fermentation. Total nitrogen 6 g g.L-1 has the highest fermentation efficiency.
Keywords:ethanol, molasses, reducing sugar, Saccharomyces cerevisiae, total nitrogen
INTRODUCTION
Indonesia's oil production has declined, while demand for derivative products is increasing. Comparison of ethanol and the need for production in 2012 reached 15: 1 [1]. One of the solutions is use ethanol for replacing fossil fuel. The advantages of ethanol use for transportation purpose that it can be produced every time and
low of CO2 emission [2].
Saccharomyces cerevisiae is active microbe in the conversion of glucose to ethanol. Yeast growth is influenced by nutritional factors and environmental factors. The main nutrients that are important in the life of yeast cells are source of carbon, nitrogen, oxygen, and hydrogen. Other materials needed in small amounts for the cell (element phosphorus, sulphur, potassium and magnesium). The critical environmental parame-ters are temperature, pH, and oxygen and air pressure [3].
The major raw material for ethanol
production in Indonesia is molasses. Molasses is a sugar cane factory waste and is not widely used as a staple food as in the case with starchy
Correspondence author: Ekwan Nofa Wiratno
Email : ekwannwiratno@gmail.com
Address : Faculty of Mathemathics and Natural Sciences, University of Brawijaya, Jl. Veteran, Malang, 65145
materials [4]. Molasses has been used because this material does not require pre-treatment processes, so microbes can use it directly for metabolism [5].
However, the use of the concentration of reducing sugar in the molasses as a carbon source and additional nutrients in the form of urea as a nitrogen source was varied in each industry that use it. This research is important to understand the variation on the use of reducing sugars and total nitrogen in increasing ethanol production which is expected to encourage energy independence and reduce reliance on fossil energy sources.
MATERIALS AND METHODS
Total Nitrogen and Calcium (Ca) Concentration Measurement
Total nitrogen measured use the Kjeldahl method [6]. Calcium concentration of molasses use Indonesian standard method/SNI [6].
Measurement of Reducing Sugar Concentration
Ethanol Fermentation
The molasses was diluted with distilled water
to make a reducing sugar concentration 125 g.L-1
and urea has added 0.37 g.L-1 (pH 5.5). Molasses
was boiled at a temperature of 100°C for 10 minutes. The fermentation processes was consist of enrichment, pre-fermentation and fermenta tion.
Total of 20 ml of sterile molasses was added with 2 g of SAF Instant Yeast Gold Label and homogenized at a speed of 120 rpm for 3 hours at 30°C (enrichment). These results was poured into a sterile molasses to the volume of 200 ml and incubated at a speed of 120 rpm for 12 hours at 30°C (pre-fermentation). After it was moved to the sterile molasses with reducing sugar concentration and nitrogen setting (Table 1) to 1000 ml volume and incubated at a speed of 300 rpm for 72 hours.
Table 1. Treatment of Total N and reducing sugar concentration
Ethanol Measurement
Ethanol concentration was measured using Dichromatic Acid Method [8].
Fermentation Efficiency
Fermentation efficiency was estimated using theoretical and real concentration of ethanol [9].
TE = SK x V x 0.511
Description:
TE = theoretical ethanol SK = sugar concentration
V = volume of fermentation medium FE = fermentation efficiency
Fermentation Parameter
Parameters was measured consisted of acidity, temperature and dissolved oxygen (DO). Acidity was measured using pH meter, the
temperature measured by the thermometer, while DO was measured with DO meter.
RESULT AND DISCUSSION
Ethanol Production and Reducing Sugar Concentration
Highest ethanol concentration was produced
is GR 100 N 6 (35.3 g.L-1 or 3.53 %) (Fig. 1) and GR
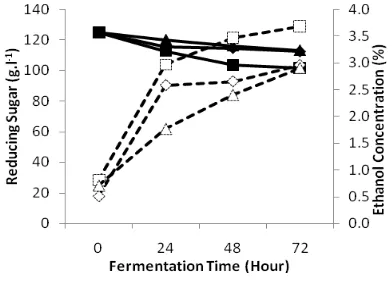
125 N 6 (36.85 g.L-1 or 3.68 %) (Fig. 2). Increasing
of ethanol concentrations was significantly (α>
0.05) occurred at 24 hours. Largest ethanol production occurs in the first 24 hours in the fermentation process [10]. This is caused by an increase in the fermentation process up to 10 % in the early phase of fermentation [11].
Figure 1. Effect of reducing sugar initial concentration 125 g.L-1 to reducing sugar concentration (close symbol) and ethanol concentration (open symbol)
Total nitrogen 0.27 & 0.33 g.L-1 (♦ & ◊), 6 g.L-1 (■ & □), 10 g.L-1 (▲ & Δ)
Result of ethanol fermentation with treat-ment of GR 100 N 6 and GR 125 N 6 were
significantly differences with the other (α = 0.05).
Reducing sugar concentration of 125 g.L-1
resulted in higher ethanol concentrations than
reducing sugar 100 g.L-1. Ethanol yield is
influenced by the concentration of the substrate, the higher the substrate (not more than 15 %), produced the higher ethanol yield [12].
Treatment of total nitrogen 6 g.L-1 influence
the concentration of produced ethanol. Addition of urea for increasing nitrogen concentration
which produced the maximum ethanol
concentration was 6 g.L-1. Nitrogen is a major
nutrient that influence fermentation efficiency and at the same time also become a limiting factor to the fermentation process. Limitations of the nitrogen will lead to a decrease in sugar transport activity in the stationary phase resulting in a decrease in the rate of
No Treatment
Reducing Sugar (g.L-1) Total Nitrogen (g.L-1)
1 100 2.7
2 100 6
3 100 10
4 125 3.3
5 125 6
fermentation. The presence of nitrogen triggers the rate of metabolism of sugar and ethanol production [13].
Reducing sugar in all treatments decreased slightly so that a reducing sugar is still remains in a high concentration. This indicates that the fermentation process is not running optimally. Inhibition of this process of reducing sugar consumption may occur due to the influence of chemical compounds inside the compound of molasses and yeast cell metabolism. One of the compounds derived from molasses is sulphur dioxide [14].
Figure 2. Effect of reducing sugar initial concentration 100 g.L-1 to reducing sugar concentration (close symbol) and ethanol concentration (open symbol)
Total nitrogen 0.27 & 0.33 g.L-1 (♦ & ◊), 6 g.L-1 (■ & □), 10 g.L-1 (▲ & Δ)
Sulphur dioxides have antimicrobial effects by means of penetrating cell membranes and interfere with the activity of enzymes and proteins in the cell. When sulphur dioxide is added to the fermentation process, there will be a decrease in the rate of fermentation and increased production of acetaldehyde. Sulphur dioxide inhibits an enzyme that inhibits the SH-group and NAD [15].
Some of the yield compounds of yeast cell
metabolism include furfural, 5-hydroxymethyl-furfural (HMF), acetic acid [15] and propionic acid [16]. Furfural and HMF at concentrations more than 0.5 % led to a decrease in sugar consump-tion and a decrease in the concentraconsump-tion of ethanol (7.5% and 26%). While the acetic acid concentration more than 0.15% causes reduction of ethanol concentration and productivity [17]. Furfural was caused to the accumulation of reactive oxygen species (ROS), mitochondrial membrane damage, and damage to the vacuole membrane, nucleus and actins chromatin
damage [18]. Concentration of 0.68 % propionic
acid is toxic for Saccharomyces cerevisiae [17].
Effect of Reducing Sugar and Total Nitrogen to Fermentation Efficiency
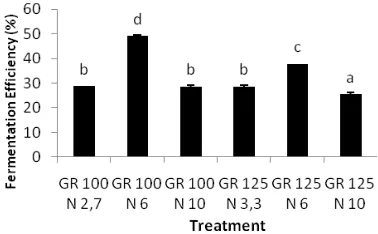
The highest fermentation efficiency is GR 100 N 6 treatment (69%). This was followed by treatment of the GR 125 N 6 by 57%. This fermentation efficiency showed that the total
nitrogen treatment at 6 g.L-1 was able to improve
the efficiency of fermentation. Fermentation media in the form of molasses had a fermentation efficiency of 68.5% [11]. The decline in the efficiency of the fermentation was due to the high concentration of reducing sugars and other components that were toxic [19].
Figure 3. Ethanol Fermentation Efficiency after 72 hour
Efficiency of ethanol fermentation decreases with increase in sugar concentration resulting in increased osmotic pressure of the media or the number of cells that over capacity due to the high concentration of substrate. The high concentration of substrate inhibits the growth of yeast cells that lead to high osmotic pressure and low water concentration. This causes the yeast cells become dehydrated [20]. N concentration of
6 g.L-1 led to the increased cell viability so that
the process of carbohydrate metabolism (ethanol fermentation) increased [21].
Effect of Reducing Sugar and Total Nitrogen to Fermentation Parameters (T, pH and DO)
An increase on temperature of all treatments during the initial fermentation process (24 hours)
were not significant (α>0.05) (Fig. 4). It indicates
the process of carbohydrate metabolism. The increase on temperature in the initial phase of fermentation (first 24 hours) caused by exothermic metabolic activity (heat generating) by the microbial population [11].
1.7 kcal). The energy is sufficient to raise the temperature of 17.9°C medium. Increased of the 17.9°C temperature was not observed either because there is a process made possible release into the environment temperature [12].
Figure 4. Effect of treatment to temperature during ethanol fermentation
GR 100 N 0.27 (♦), GR 125 N 0.33 (◊), GR 100 N 6 (■), GR 125 N 6 (□), GR 100 N 10 (▲), GR 125
N 10 (Δ)
In general, a decrease of the acidity (pH) in all treatments of the fermentation process, were
not significant (α>0.05) (Fig. 5). According to
Khongsay et al. [22], when the fermentation
process using a batch system, decrease the acidity of the medium to 0.25 in the early phase of fermentation (24 hours), then a decrease in pH occurs slowly.
When the yeast to metabolize carbohydrates also produced acetic acid and formic acid, has cause decrease of the acidity of the growth medium. Decrease of the acidity is closely linked
to the consumption of nitrogen and release of H+
ions. The acid is lipo-soluble can enter the cell through the plasma membrane and intracellular acidity affect [23].
Figure 5. Effect of treatment to acidity during ethanol fermentation
GR 100 N 0.27 (♦), GR 125 N 0.33 (◊), GR 100 N
6 (■), GR 125 N 6 (□), GR 100 N 10 (▲), GR 125
N 10 (Δ)
Increasing the concentration of acetic acid causes a decrease in carbohydrate consumption. It is resulting in a decrease in the rate of ethanol production [24].
There was a decrease of dissolved oxygen during the process of fermentation in all treatments (Fig. 6). Decrease of the DO was
significantly (α>0.05) occurred in the treatment of GR 100 N 6, GR 100 and GR 125 N 10 N 10 This indicated that the concentration of total nitrogen
(6 and 10 g.l-1) caused an increase in oxygen
consumption by yeast cells.
Figure 6. Effect of treatment to dissolved oxygen during ethanol fermentation
GR 100 N 0.27 (♦), GR 125 N 0.33 (◊), GR 100 N
6 (■), GR 125 N 6 (□), GR 100 N 10 (▲), GR 125
N 10 (Δ)
Yeasts used oxygen in the process of cell reproduction that would correlate with the number of cells [25] and keep the cell concentration remains high [26]. The presence of oxygen will inhibit the fermentation process (Pasteur Effect) [25]. The function of oxygen is to produce ATP in glycolysis and oxidative phosphorylation. The process of oxidative phosphorylation is a process that is most prominent in the production of ATP. If there is no oxygen (anaerobic), NADH in the mitochondria cannot be re-oxidized in the citric acid cycle, resulting in the formation of ATP and nutrient solution is interrupted [21]. In addition of nitrogen, other factors that affect the process of respiration are the presence of salt. The addition of 1.0 M KCl or NaCl causes an increase in the rate of respiration and cell metabolism [27].
CONCLUSION
molasses chemical compound, lead remains high sugar concentration (> 80 g.L-1). GR 100 N 6 and GR 125 N 6 treatment have highest fermentation efficiency (69 and 57%). There was no increase in temperature and decrease in pH significantly
(α>0.05). DO decreased significantly (α>0.05) at the early of fermentation and slowed until the
rita&id=2787. Accessed June 26th 2012.
[2] Jeon, Y., S.J. Kim, D.H. Kim, B.K. Na, D.H.
Park, H.T. Tran, R. Zhang, D.H. Ahn. 2007. Development of a serial bioreactor system for direct etanol production from starch
using Aspergillus niger and Saccharomyces
cerevisiae. Biotechnol. Bioprocess Eng. 12. 566-573.
[3] Loureiro, V., M. Malfeito-Ferreira. 2003.
Spoilage yeasts in the wine industry. Int. J.
Food Microbiol. 86 (1-2). 23-50.
[4] Kurniawan, Y., A. Susmiadi, A. Toharisman.
2005. Potensi pengembangan industri gula sebagai penghasil energi di Indonesia. Research Centre of Sugar Plantation Indonesia (P3GI). Pasuruan.
[5] da Silva, G.P., E.F. de Araújo, D.O. Silva,
W.V. Guimarães. 2005. Ethanolic fermenta-tion of Sucrose, Sugarcane Juice and
Molasses by Escherichia coli Strain Ko11 and
Klebsiella oxytoca Strain P2. Braz. J. Microbiol. 36. 395-404.
[6] Sudarmadji, S., Haryono, B. Suhardi. 1996.
Analisa bahan makanan dan pertanian. Liberty. Yogyakarta.
[7] Miller, G.L.. 1959. Use of Dinitrosalicylic
Acid Reagent for Determination of Reducing Sugar. Analytical Chemistry 3 (31): 426-248.
[8] Caputi, A. Jr, M. Ueda, T. Brown. 1968.
Spectrophotometric determination of
ethanol in wine. Am. J. Enol. Viticult. 3 (19).
160-165.
[9] Zhang, K., H. Feng. 2010. Fermentation
potentials of Zymomonas mobilis and its
application in ethanol production from low-cost raw sweet potato. Afr. J. Biotechnol. 9 (37). 6122-6128.
[10] Balakumar, S., V. Arasaratnam. 2009.
Comparison of industrial scale ethanol production from palmyrah-based carbon
source by commercial yeast and a mixed
culture from palmyrah toddy. J. Instr.
Brewer. 115 (2). 105-109.
[11] Ingledew, M.W. 1993. Yeasts for production
of fuel ethanol. The Yeasts. 5. 245-286.
[12] Rodrigues, F., P. Ludovico, C. Leao. 2005.
Sugar metabolism in yeasts: an overview of aerobic and anaerobic glucose catabolism. University of Minho. Braga.
[13] Ghosh, S., R. Chakraborty, U. Raychaudhuri.
2010. Modulation of palm wine
fermentation by the control of carbon and
nitrogen source on metabolism of
Saccharomyces cerevisiae. J. Food Technol. 8 (5). 204-210.
[14] Foster, F. 2012. Harmful chemicals in
Molasses. http://www.rawfoodexplained.
com/junk-foods-molasses/harmful-chemi
cals-in-molasses.html. Accessed October 3rd
2012.
[15] Henderson, P.. 2009. Sulfur Dioxide, science
behind this anti-microbia, anti-oxidant, wine
additive. Pract. Winery Vineyart J. 1-6.
[16] Al-Jasass, F.M., S.M. Al-Eid, S.H.H. Ali. 2010.
A comparative study on date syrup (dips) as
substrate for the production of baker’s
yeast (Saccharomyces cerevisiae). J. Food,
Agr. Environ. 8 (2). 314-316.
[17] Wikandari, R., R. Millati, S. Syamsiyah, R.
Muriana, Y. Ayuningsih. 2010. Effect of Furtural, Hydroxymethylfurfural and Acetic Acid on indigeneous Microbial Isolate for
Bioethanol production. Agr. J. 5 (2).
105-109.
[18] Allen, S.A., W. Clark, J. M. McCaffery, Z.
Cai1, A. Lanctot1, P.J. Slininger, Z.L. Liu, S.W. Gorsich. 2010. Furfural induces reactive oxygen species accumulation and cellular
damage in Saccharomyces cerevisiae.
Biotechnol. Biofuels. 3. 2-10.
[19] Abubaker, H.O., A.M.E. Sulieman, H.B.
Elamin. 2012. Utilization of
Schizo-saccharomyces pombe for Production of
ethanol from Cane Molasses. J. Microbiol.
Res. 2 (2). 36-40.
[20] Soni, S.K., N. Bansali, R. Soni. 2009.
Standardization of conditions for fermenta-tion and maturafermenta-tion of wine from Amla (Emblica officinalis Gaertn.). Nat. Product Radiance. 8 (4). 436-444.
[21] Supriyanto, T., Wahyudi. 2010. Proses
produksi etanol oleh Saccharomyces
[22] Khongsay, N., L. Laopaiboon, P. Jaisil, P. Laopaiboon. 2012. Optimization of agitation and aeration for very high gravity ethanol fermentation from sweet sorghum juice by
Saccharomyces cerevisiae using an
orthogonal array design. Energ. 5. 561-576.
[23] Maurice, M.L. 2011. Factors effecting
ethanol fermentation via simultaneous saccharification and fermentation. Shanghai Jiao Tong University. Shanghai.
[24] Casey, E., M. Sedlak, N.W.Y. Ho, N. S.
Mosier. 2010. Effect of acetic acid and pH on the cofermentation of glucose and
xylose to ethanol by a genetically
engineered strain of Saccharomyces
cerevisiae. FEMS Yeast Res. 10. 385–393.
[25] Walker, G.M. 1998. Yeast: physiology and
biotechnology. John Wiley and Sons. Chichester.
[26] Tao, F., J.Y. Miao, G.Y. Shi, K.C. Zhang. 2003.
Etanol fermentation by an Acid-tolerant
Zymomonas mobilis under non-sterilized
condition. Process Biochem. 40. 183-187.
[27] Montiel, V., J. Ramos. 2007. Intracellular Na+
and K+ distribution in Debaryomyces
hansenii. Cloning and expression in