p-ISSN 2622-2027
e-ISSN 2622-2035
RE-LAYOUT PRODUCTION FACILITY BREAD USING FTC AND ARC METHOD IN PT. XYZ
Prihono*)
*)
Industrial Engineering Department, Faculty of Industrial Technology University of PGRI AdiBuana Surabaya
email :[email protected]
Abstract
Layout arrangements are vital for improving quality, productivity and corporate image. A production requiring multiple machines and a production process flow that is too long necessitates the preparation of a detailed layout in order that there is no transfer flow movement in the production process. This study aims to make the production process has a total minimum displacement moment and increase employee performance. From the analysis conducted at PT. XYZ that produce bread shows the existence of long distance, motion behind and congestion during material handling. The result of analysis by using method from to chart shows that the distance of material transfer distance is 73, 70 meter, total frequency of material transfer 35 times and mileage with total 1,901 meter. The result of analysis using activity relationship chart where spray & seeding (J) and split machine (K) departments were moved close to proofing room 1 (H1) and proofing room 2 (H2) facility, rack & pan 1 (I1) facility was moved near With rack, tray & pan cleanning (G) area facilities and the sieving flour (B) and formula room (D) departments being moved close to the process area 2 (C2) facility.
Keywords:Facility layout, From to chart, Activity relationship chart.
1. INTRODUCTION
The development of technology and business competition in the field of industry requires companies to develop innovations so that companies can compete and continue to run their activities. In addition to developing
innovation is to rearrange the layout of existing production facilities.
PT. XYZ which started its activities since 1977 with the scale of production of traditional crackers. For more than twenty years, the company has grown to become the largest cracker maker in Indonesia. In August 2002, PT. XYZ has been working with a fast-food restaurant to produce sauces and flour and in 2006, producing bread that is distributed to meet the needs of Eastern Indonesia.
In line with the development of the company that always prioritizes the quality and safety of products based on the principles of HACCP and GMP, the more reliable the quality and quality. So in addition to supplying fast-food restaurant companies that have cooperated previously, purchase order (PO) also came from several other fast food restaurants. Since the bread production capacity has not fulfilled the orders of some fast food restaurants, departmental development and the addition of machinery or equipment are required to fulfill the order of production capacity.
After the development and addition of departments, there are various obstacles, among them: the inter-departmental employees' access becomes long and there is movement back when the process of material transfer (back tracking), congestion and others.Based on existing conditions, then PT. XYZ needs to rearrange the layout to make the production process more efficient.
storage, production employees and so on.
2. LITERATUR REVIEW Basically, the layout of the factory planned with good preparation of course can determine the efficiency and maintain the success and welfare of the company. In addition the optimal factory layout will also be able to provide convenience in the supervision process and face the future expansion of the factory. (Wignjosoebroto, S., 1992).
Types / Layout type
There are four kinds / layout types that are classically commonly applied in layout design, namely: Wignjosoebroto, S., (1992).
1. Facility Layout Based on Production Flow.
2. Facility Layout Based on Fixed Material Location.
3. Facility Layout by Product Group. 4. Facility Layout by Function or Process Type.
Distance Calculation Methods
In the paper Suhada et al, (2011), explained that, the distance as one of the measurable parameters of the material handling component.In the material handling process there is the process of moving materials from one department to another department.
There are 7 kinds of distance calculation, among others: (Heragu, 1997): 1. Euclidean
How to measure the straight line formed from the center point of each facility. 2. Squared Euclidean
This method is similar to euiclidean, but squared eulidean is the rank of two of the euclidean results.
3. Rectilinear
How to calculate the distance using the number of mileage on each axis line. 4. Tchebychev
Estimating the distance between the facility pairs is the largest axis distance, assuming the movement of each axis is implemented simultaneously.
5. Aisle Distance
How to calculate the actual distance the material experiences based on the accumulated axis distance.
6. Adjacency
7. Shortest path
How to calculate the shortest distance from every possible path.
From-To Chart Method
In the paper Dewi Sari et al, (2012), stated that, from to chart is a conventional technique commonly used for plant layout planning and material transfer in a production process. This technique is very useful for the conditions under which many items flow through an area such as machine workshop, office and others. The numbers contained in a from to chart will show the total weight of the load to be moved, the distance of the material transfer, the volume or combinations of these factors. From to chart here used as a basis for the preparation of data as a condition in the improvement of the factory layout. As for some uses and advantages from to chart are: 1. Analyze the transfer of materials.
2. Comparison of flow patterns or replacement layout.
3. Efficient measurement of flow patterns. 4. Demonstrate the dependence of one activity with other activities.
5. Shows the volume of movement between activities.
6. Shows cross-production linkages.
7. Shows the linkage between some products, components, goods and materials.
8. Demonstrate the quantitative relationship between activities of displacement.
9. Shortening travel distance during the process.
Activity Relationship Chart (ARC)
According to Wignjosoebroto, S., (1992), Activity Relationship Chart is a simple way or technique in planning the layout of facilities or departments based on the degree of relationship often expressed in "qualitative" judgments and tend to be based on subjective considerations of each, each facility/department.
3. METODOLOGY Method of collecting data
Data collection is the activity of searching and retrieving the necessary data, including:
p-ISSN 2622-2027
e-ISSN 2622-2035
Primary data is data taken directly to the company under study as the size of facilities and the flow of material transfer. 2. Secondary Data
Secondary data is data already available on the company.
Data analysis method
1. Map of Operation Process 2. Production Flow Chart 3. From To Chart.
4. Activity Relationship Chart
4. RESULT AND DISCUSSION Results and discussion of research conducted is data collection, data processing and presentation of data processing results. Data processing
For data processing in this research, include:
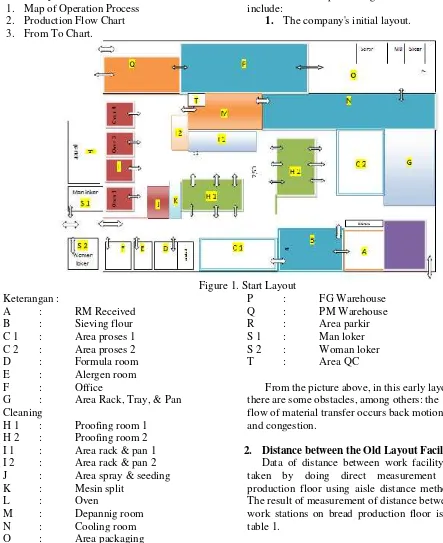
1. The company's initial layout.
Figure 1. Start Layout Keterangan :
A : RM Received B : Sieving flour C 1 : Area proses 1 C 2 : Area proses 2 D : Formula room E : Alergen room
F : Office
G : Area Rack, Tray, & Pan Cleaning
H 1 : Proofing room 1 H 2 : Proofing room 2 I 1 : Area rack & pan 1 I 2 : Area rack & pan 2 J : Area spray & seeding K : Mesin split
L : Oven
M : Depannig room N : Cooling room O : Area packaging
P : FG Warehouse Q : PM Warehouse R : Area parkir S 1 : Man loker S 2 : Woman loker
T : Area QC
From the picture above, in this early layout there are some obstacles, among others: the flow of material transfer occurs back motion and congestion.
Tabel 1.Distance Facility / LayoutExisting
No From Distance (m) Frequency Distance
1 manufacturing industry to describe its operational processes.
Discussion
In this study, the observed is the production process produced every day due to production planning to adjust the order and delivery. The fix layout arrangement is based on the average range of products produced every day.
1. Planning Layout Repair
The design of proposed improvement layout is done by using method from materials that multiply in a large area. While the activity relationship chart (ARC) is used to analyze the level of relationship or relevance of activities from a space with another room. The considerations used for planning should be based on data on production activities, operation process maps and flow diagrams both ongoing and future (forecast).
2. Repair Layout
p-ISSN 2622-2027
e-ISSN 2622-2035
Figure 2. Layout Repair
In this repair layout some obstacles that can be eliminated include: movement of material transfer movement, congestion and distance of material transfer.
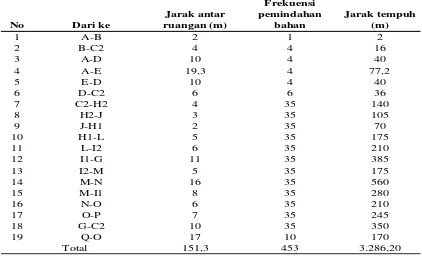
3. Distance Between Layout Facility Repair Distance between production facilities in the repair layout can be seen in table 2.
Table 2. Distance Between Equipment Repair Layout
No Dari ke
Jarak antar ruangan (m)
Frekuensi pemindahan
bahan
Jarak tempuh (m)
1 A-B 2 1 2
2 B-C2 4 4 16
3 A-D 10 4 40
4 A-E 19,3 4 77,2
5 E-D 10 4 40
6 D-C2 6 6 36
7 C2-H2 4 35 140
8 H2-J 3 35 105
9 J-H1 2 35 70
10 H1-L 5 35 175
11 L-I2 6 35 210
12 I1-G 11 35 385
13 I2-M 5 35 175
14 M-N 16 35 560
15 M-I1 8 35 280
16 N-O 6 35 210
17 O-P 7 35 245
18 G-C2 10 35 350
19 Q-O 17 10 170
151,3 453 3.286,20
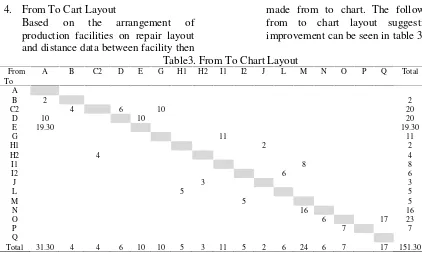
Based on the arrangement of production facilities on repair layout and distance data between facility then
from to chart layout suggestions improvement can be seen in table 3.
Table3. From To Chart Layout
From A B C2 D E G H1 H2 I1 I2 J L M N O P Q Total
To A
B 2 2
C2 4 6 10 20
D 10 10 20
E 19.30 19.30
G 11 11
H1 2 2
H2 4 4
I1 8 8
I2 6 6
J 3 3
L 5 5
M 5 5
N 16 16
O 6 17 23
P 7 7
Q
Total 31.30 4 4 6 10 10 5 3 11 5 2 6 24 6 7 17 151.30
5. Activity relationship chart
In the making activity relationship chart (ARC) is based on data sequence of activities in the process of bread production that has been collected and will be linked in pairs to know the
level of correlation relationship material flow, equipment, human, information between activities between facilities. The following activity relationship chart can be seen in Figure 3.
Figure 3.Activity Relationship Chart From the picture above there are several
p-ISSN 2622-2027
e-ISSN 2622-2035
other facilities in accordance with the activities and according to the flow of production process, among others:
• Received / acceptance of raw materials and supporting materials (A) is absolutely adjacent to the sieving flour facility (B) due to the ease of removal of the raw materials.
• Sieving flour (B) is absolutely adjacent to the process facility 2 / mixing of all materials, damping and dough printing (C2) due to work sequence and minimizing material handling.
• Formula room is absolute adjacent to process facility 1 / mixing of all materials, dough and dough printing (C1) and process 2 / mixing of all ingredients, cuttings and dough printing (C2) due to work flow sequence and ease of confirmation and adaptation planning product.
• Proofing room 2 / fermentation chamber (H2) is absolute adjacent to spray & seeding / spraying and sowing, oat meal and corn dusted (J)
and crown bread (K) split / split / crosslinked areas due to work flow sequence, shortening the distance between facilities and ease of control. . • Spray & seeding / spraying and sprinkling of sesame, oat meal and corn dusted (J) and crown bread (K) split / absolute adjacent to Proofing room 1 / fermentation spaces (H1) due to work flow sequences and eliminating back motion ( back tracking) if required adjustment of product specifications.
• Depanning room from pan to tray (M) is absolute adjacent to rack & pan 1 (I1) area facilities besides work flow sequence as well to shorten material handling flow.
• The rack & pan 1 (I1) area is absolute adjacent to the rack, tray & pan cleanning (G) area facilities due to the order in which the equipment flows and summarizes the material handling process.
Table 4. Comparison of Initial Layout with Repair Layout No Activity Layout Existing New Layout
1
2
3
Total Frequency of Material Transfers Total
Total Distance between facilities
From to Chart
488 times
5.187 meters
225 meters
453 times
3.286 meters
151 meters
The table above shows the difference of total frequency of material transfer, total distance between facilities and from to chart production process activity between initial layout with repair layout.
5. CONCLUSION
From the results of the analysis of the data that has been done, it can be drawn conclusion as follows:
1. By using the method from to chart (FTC) shows that the difference between the distance, among others:
a. Total distance between rooms on the old layout of 225 meters, while on the repair layout to 151.30 meters.
b. The total frequency of material transfer in the old layout 488 times, while in the repair layout to 453 times.
c. The total mileage in the old layout is 5,187 meters, while the repair layout is 3,286.20 meters.
2. Things that disturb material handling process because there are some departments that are less regular and fit the flow of production process. Facilities to be relocated include:
cleanning (G) area facilities.
c. The sieving flour (B) and formula room (D) facilities are moved close to the process area 2 (C2) facility.
6. ACKNOWLEDGMENT Upon completion of this scientific journal the author would like to thank:
1. Dean of Faculty of Engineering PGRI University AdiBuana Surabaya.
2. All Lecturers and staffs in Industrial Engineering Department.
REFERENCES
1. Dewi Ni Made E.N., (2014), Kajian Interior
ElemenPembentungdanPelengkapPem bentukRuang, JurnalDesain Interior Vol. 1, No. 1, page 1–17.
2. Dewi Sari D.R., Prianto A.Y., Mulyono J.,(2012), Perbaikan Tata LetakPabrikDenganMenggunakanMet ode Clustering (Study Kasus: PT:SBS),Prosiding Seminar NasionalAplikasiSains&TeknologiPeri ode 3, ISSN : 1979–911X, page A-25
–A-35.
3. Laksito, B., (2014), MetodePerencanaan&PerancanganAr sitektur. GriyaKreasi Jakarta timur.
LetakFasilitasdenganMenggunakanMe todeBlocplan (StudiKasus PT. Kramatraya Sejahtera),Reka Integra ISSN: 2338-5081, No.03, Vol.01, page 90–100.
5. Pratiwi I., Muslimah E., Aqil W.A., (2012), Perancangan Tata
letakFasilitas di
IndustriTahuMenggunakanBlocplan,Ju rnalIlmiahTeknikIndustri, ISSN: 1412-6869, Vol. 11, No. 2, page 102–112.
6. Prasetya Y.Y., Runtuk K.J., Hartanti S.P.L., (2015),Analisis Tata LetakFasilitasdalamMeminimasi Material Handling (Study Kasus: Perusahaan Roti Matahari), JurnalGemaAktualita, Vol. 4 No. 1, page 1-10.
7. Sugiyono, (2011),
MetodePenelitianKuantitatif,
Kualitatifdan R&D. Alfabeta Bandung. 8. Suhada K., Arisandhy V., Cahyadi A.D., (2011), UsulanPerbaikan Tata LetakMesinDenganMenggunakanMeto
deFraktal (Study Kasus di PT “X”
Cimahi),Jurnal Integra Vol. 1, No. 1, page 21–40.
9. Wignjosoebroto, S.,