An Energy-Economy Model to Evaluate the Future Energy Demand-Supply
System in Indonesia
Master Thesis
Executive Summary
Agus Sugiyono
7493627
Mori Laboratory
Industrial Administration Department
Faculty of Science and Engineering
Science University of Tokyo
An Energy-Economy Model to Evaluate the Future Energy Demand-Supply System in Indonesia
Mori Laboratory 7493627 Agus Sugiyono
1. Introduction
The present level of energy demand in Indonesia is still very low and it expected to continue to increase. To fulfill the demand, some energy resources such as coal, gas, oil and renewable energy are available. These energy resources are characterized by limited oil reserves, sufficient gas reserves and abundant coal reserves. Therefore, it is important to make optimal strategies for the national energy demand-supply system for the long future. Energy-economy model is one of the tools for the energy decision-maker to perform it.
The objective of this study is to develop an energy-economy model for Indonesia to evaluate the future energy demand-supply systems. The whole country is divided into four regions. The model is benchmarked against 1990 base year statistics. The evaluations cover for ten-year time intervals extending from 2000 through 2030. Because there is increasing concern about environmental problem recently and for the energy decision-maker, the relation among energy, economy and environment becomes a new consideration, this model also considered environmental aspect. The model is designed as a non-linear optimization model with various components of quantitative framework to make the model useful device for analysis.
2. Background on Indonesia
Indonesia is an archipelago consists of no less than 13700 islands. Total area is about 9.8 million squares kilometers with the sea area is four times larger than its land area. The land area is generally covered with thick tropical rain forest and predominantly mountainous.
MALAYSIA
Kalimantan
Other Islands
Java Sumatera
Fig. 1. Indonesia and regional divisions of the model
According to the 1990 census the population has reached 179.3 million, which is the third largest group in Asia after People’s Republic of China and India. The population growth rate has declined from 2.2 % per annum in the early eighties to 1.8 % at present.
In the 1970, the country experienced relatively high economic growth of around 7.8 % per annum mainly due to the high oil prices in the international market. Average economic growth rate for the last 10 years is about 6 % per annum.
Energy sector accounted for slightly over 20 % of GDP in 1990 and approximately 40 % of the export earnings. The domestic primary energy supply in 1991 was accounted around 52 MTOE and was dominated by crude oil with 41 % and by biomass, as a traditional form of energy, which contributed 31 %. Natural gas supplied 18 % of the domestic energy consumption. The remainders shared by coal (6 %) and hydropower together with geothermal energy (4 %).
3. Model Overview
3.1. Energy-Economy flow
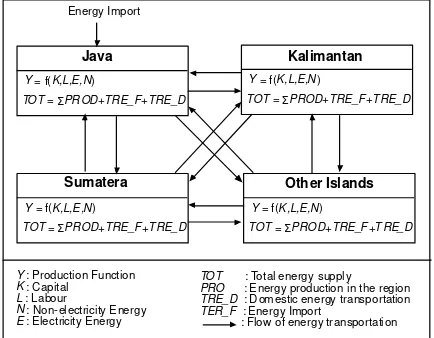
Many islands of Indonesia show a significantly non-uniform distribution of energy resource, energy consumption and a different status of development. Taking this into account, the whole country is divided into four region: Java, Sumatera, Kalimantan, and other islands (see Fig. 1) with transportation of fossil energy: coal, crude oil, and natural gas (see Fig. 2).
Energy Import
Kalimantan
Y = f(K,L,E,N)
TOT = ΣPROD+TRE_F+T RE_D
Sumatera
Y = f(K,L,E,N)
TOT = ΣPROD+TRE_F+T RE_D
Other Islands
Y = f(K,L,E,N)
TOT = ΣPROD+TRE_F+T RE_D
Java
Y = f(K,L,E,N)
TOT = ΣPROD+TRE_F+TRE_D
Y : Production Function
K : Capital
L : Labour
N : Non-electricity Energy
E : Electricity Energy
TOT : Total energy supply
PRO : Energy production in the region
TRE_D : Domestic energy transportation
TER_F : Energy Import
: Flow of energy transportation
Fig. 2. Block diagram of the regional model
model by inter-regional flows such as coal, crude oil, and natural gas shipping.
The model contains five types of primary energy sources: coal, natural gas, crude oil, biomass and other renewable energy which involves hydropower and geothermal energy. The primary energy sources are transformed into secondary energy sector consists of electricity and non-electricity. Demand sector is disaggregate into three sectors: industry, transportation, and other sectors.
Coal Coal
I NDUSTRY SECTOR
TRANSPORT S ECTO R
OTHER SE CTOR
Fig. 3. Structure of regional energy flow model
3.2. Mathematical formulation
The model is formulated as an inter-temporal optimization model with two-way linkages between the energy sectors and the balance of the economy. The basic formulation to calculate the energy demand is the Cobb-Douglas type production function. Y is the production function in each region r with time period
t.
Where E and N denotes the production of electricity and non-electricity energy for the industry sector. L is a population assumed as an exogenous variable. K
denotes capital stock and A is a technical progress factor. The microeconomics parameters on the above equation are adapted from Global 2100 model[3] where
ESUB is production value share of energy, KPVS and
ELVS are capital value share parameter and electricity value share parameter.
The energy demand in the transportation sector is calculated using Equation (2). The supplies of non-electricity and non-electricity energy must be adequate to cover the demands.
) transportation sector, EF is the electricity use efficiency and B is a constant. In the other sectors of demand a similar set of energy demand constraint is employed. The other constraints are the energy
resources limit as summarized in Table 1. For the fossil energy (coal, natural gas, and crude oil) these constraints also calculate the energy transportation to each regions as shown in Equation (3).
(
)
rwhere TRE_D and TRE_F are domestic transportation of energy and import of energy. RESr denote the limit
of energy resource of region r. Total domestic transportation of energy must be balanced and is expressed with:
Table 1. Energy reserves in 1990[4]
Crude Oil
109 Barrel Natural Gas1012 SCF 10Coal9 Ton HydropowerGW GeothermalGW
Java 1.325 12.4 0.061 4.2 7.80
Sumatera 8.324 64.1 24.776 15.6 4.90
Kalimantan 1.002 24.4 9.361 21.6
Other Islands 0.080 0.9 0.107 33.6 3.40
Total reserves 10.731 101.8 34.305 75.0 16.10
The gross value of production is to be distributed among consumption, investment for build up the capital stock and inter-industry payment for energy cost (EC),
where C is consumption and I is investment. The total capital stock surviving from one period to the next was expressed with:
r
where δ is depreciation rate and n denote time horizon intervals. At the end of the planning horizon, a terminal constraint is applied to ensure that the rate of investment is adequate.
To avoid excessively rapid expansion of new technologies, there are expansion rate constraints of the following form. The electricity energy production expansion rate constraint is expressed in Equation (7) and for the non-electricity energy in Equation (8).
r
[
]
consumption. S is share of regional income per capita. In this model depreciation rate and discount rate is set to be 10 % and 5 % per year.The energy sector, which includes energy production, transport, conversion, and end-use in the sector of industry, transportation, and others, is the main contributor to man-made air pollution. The main pollutants are CO2, CO, particulate matter, NOx, SO2,
volatile hydrocarbons, and some heavy metals. In this study only CO2 emission will be analyse. CO2
emission is associated with the consumption of coal, crude oil, and natural gas.
The CO2 emissions directly estimated if the
quantity of each fuel consumed is known. If ECH and
NCH are CO2 emission coefficient for fuel use in
electricity and non-electricity then the total CO2
emission is calculated as:
) (
2, E, ECH N, NCH
CO tr = tr× + tr× (10)
3.3 Population and income data
The major factor influencing energy demands are population growth and the economic growth. This section describes the regional growth of population and income.
Table 2. Regional population and income
Population (Million) Income (Billion US $)
1980 1990 1980 1990
Java 91.22 107.57 37.51 56.53
Sumatera 28.00 36.46 20.15 27.21
Kalimantan 6.72 9.11 6.25 9.88
Other Islands 21.90 26.18 5.57 7.15
Total 147.84 179.32 69.48 100.77
Each region has a different growth rate of population. For the last 10 years, Kalimantan has the highest population growth rate which about 3.1 % per annum followed by Kalimantan (2.7 %), other islands (1.8 %), and Java (1.7 %).
Indonesia has income per capita in 1990 about 560 US dollar. Kalimantan and Sumatera have higher income per capita than the other regions due to oil production. In decreasing order of the growth of income in US dollar base are Kalimantan (4.7 %), Java (4.2 %), Sumatera (3.0 %) and other islands (2.5 %).
3.4 Sensitivity analysis
Sensitivity analysis is conducted to determine how the optimum path would change if the problems were formulated differently. The discount rate and the transportation cost of fossil energy are the main parameters of sensitivity analysis in the model in this paper.
3.5 The GAMS software
The model is a non-linear programming model. A software called General Algebraic Modeling System (GAMS) is used to solve the problem on 386 compatible personal computer. It is generally more difficult to find the solution of non-linear problem than that of linear one. With non-linear model, it is important to keep the formulation as simple as possible and the model as small as possible. Development of the model should be incremental. Most non-linear problems can be solved more easily if some initial information is provided for the value of important variables. This can be implemented in the GAMS using initial value, bounds, and scaling of variable.
The GAMS[1] can solve both linear and non-linear programming problems. The GAMS solves linear programming using reliable implementation of the standard simplex method that first developed by G. Danzig in the 1940s. The problems with non-linear constraints are solved using projected Lagrangean algorithm, base on a method due to S.M. Robinson. When objective function is non-linear, GAMS solves such problem using a reduced gradient developed by P. Wolfe in 1962 combined with quasi-Newton algorithm developed by W.C. Davidon in 1959.
4. Result
Selected highlights of the model results are presented in this section.
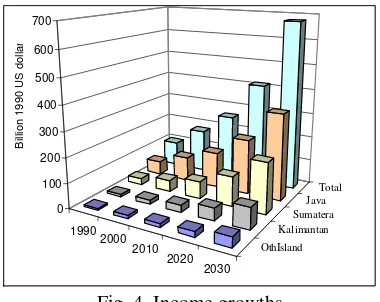
4.1 Aggregate
Energy demand grows in line with economic activities and population expansion. In the model population is assumed as an exogenous variable. A continued decline of the population growth rate is expected because Indonesia family planning policy is attempting to further reduce the growth rate. The total population growth rate until the year 2000 is about 1.8 % per annum and 1 % per annum for the long term.
1990 2000
2010 2020
2030
OthIsland Kalimantan
Sumatera Java
Total
0 100 200 300 400 500 600 700
Billion 1990 US dollar
Fig. 4. Income growths
The future of total primary energy supplies of the reference case was shown in Fig. 5. In 2000 the share of coal supply comes to about 34 % of the total primary energy supply that almost same to the share of crude oil and natural gas supply. In 2010 and 2020 the share of primary energy supply in decreasing order is coal, natural gas, crude oil, biomass, and renewable energy. The renewable energy is not growing significantly because the production cost is expensive that the other technologies.
0 100 200 300 400 500 600
1990 2000 2010 2020 2030
MTOE
Biomass Geothm. Hydro. Oil Gas Coal
Fig. 5. Total primary energy supplies
Although the CO2 emission in Indonesia still low
comparing with total CO2 emission in the world,
Indonesia is aware if this issue. As one of the 150 signatory states of the Rio Convention, Indonesia agreed to report on the status and tendency of CO2
emission in its territory. The CO2 emission expected
by 2030 has been estimated as shown in Fig. 6.
0 50 100 150 200 250 300 350 400 450
1990 2000 2010 2020 2030
Million Ton of Carbon
OthIsland Kalimant Sumatera Java
Fig. 6. CO2 emission
Sensitivity analysis is performed by varying the discount rate from 5 % to 10 % and varying the domestic transportation cost of fossil energy from 50 % to 150 % of domestic transportation cost of fossil energy in the reference case. At a higher discount rate, the total income decreases and also the energy demand declines in a long term.
A cheaper domestic transportation cost makes increase of the total energy demand. The increasing demand will be supplied by an expansion of coal and natural gas production. Supply of crude oil will grow if the domestic transportation cost of fossil energy is goes up.
4.2 Regional perspective
On the regional perspective, coal is attractive for the energy supply in Java and Sumatera due to the high growth of energy demand in these regions. In Kalimantan natural gas has a significant share for energy supply in a long term. In the other islands, area is extensive and the energy demands are fewer but much more spread out. Renewable energy such as hydropower and geothermal energy are attractive in these regions.
5. Concluding remarks
Abundant coal reserves make coal attractive as the major domestic energy supply in Indonesia. These huge amounts using coal seem to create high emission of air pollutants. The second major energy supply is natural gas and followed by crude oil. Crude oil supply is expected not growing significantly due to limited of resource.
When one considers the increasing of electricity consumption, it would be desirable to extent the model with electricity energy transportation to the other regions, such as using submarine cable from Sumatera, that abundant of fossil fuel, to Java that shoes rapidly increase of energy demand in the future study.
References
[1] A. Brooke, D. Kendrick, A. Meeraus. Release 2.25 GAMS User’s Guide, The Scientific Press, 1992. [2] A. Sugiyono and S. Mori. Integrated Energy
System to Improve Environmental Quality in Indonesia, SICE, October, 1994.
[3] A.S. Manne and R.G. Richels. Buying Greenhouse Insurance: The economic costs of CO2 emission
limit, The MIT Press, 1992.
[4] BPPT-KFA, Environmental Impact of Energy Strategy for Indonesia: Final Summary Report, May, 1993.
![Table 1. Energy reserves in 1990[4]](https://thumb-ap.123doks.com/thumbv2/123dok/1676296.1566147/3.595.72.291.219.326/table-energy-reserves-in.webp)