arXiv:1005.2153v1 [quant-ph] 12 May 2010
Y. Miroshnychenko,1 A. Ga¨etan,1C. Evellin,1P. Grangier,1 D. Comparat,2 P. Pillet,2 T. Wilk,1and A. Browaeys1 1
Laboratoire Charles Fabry, Institut d’Optique, CNRS, Univ Paris-Sud, Campus Polytechnique, RD 128, 91127 Palaiseau cedex, France
2
Laboratoire Aim´e Cotton, CNRS, Univ Paris-Sud, Bˆatiment 505, Campus d’Orsay, 91405 Orsay cedex, France
(Dated: May 13, 2010)
We present the coherent excitation of a single Rubidium atom to the Rydberg state 58d3/2using a two-photon transition. The experimental setup is described in detail, as well as experimental techniques and procedures. The coherence of the excitation is revealed by observing Rabi oscillations between ground and Rydberg states of the atom. We analyze the observed oscillations in detail and compare them to numerical simulations which include imperfections of our experimental system. Strategies for future improvements on the coherent manipulation of a single atom in our settings are given.
PACS numbers: 03.67.a, 32.80.Ee, 32.80.Qk,32.80.Rm
I. INTRODUCTION
Rydberg atoms have attracted a lot of research inter-ests in the last decades thanks to their exaggerated prop-erties [1]. Among these propprop-erties is their large interac-tion strength, which is enhanced by many orders of mag-nitude compared to ground state atoms. This long-range interaction between two Rydberg atoms has led to a wealth of studies. For example it was suggested [2, 3] and recently demonstrated [4–6] that two or more Rydberg atoms or Rydberg and ground state atoms can be bound into exotic giant molecules using photo-association tech-niques. Another example where the strong interaction plays a role is the Rydberg blockade, an effect where, in a volume smaller than the interaction range, only one atom of an ensemble can be excited into a Rydberg state. Until recently, the excitation of atoms to Rydberg states was performed using non-coherent laser excitation, usually in multiple steps. This technique led, for exam-ple, to the observation of the Rydberg blockade in clouds of ultra-cold atoms [7–11]. In contrast, the coherent exci-tation of atoms to Rydberg states has been demonstrated only in recent years, starting with experiments using cold thermal clouds of atoms [12, 13] and Bose-Einstein con-densates [14–16]. It was followed by the demonstration of the coherent Rydberg excitation of individual atoms trapped in tight optical dipole traps [17, 18]. Along these lines, electromagnetically induced transparency has been reported in room temperature atomic vapor [19] and mi-crocells [20], as well as in cold atomic clouds [21], where also coherent population trapping [22] has been observed recently. All those demonstrations were also made possi-ble by the technical development of easy to handle laser light sources, especially in the blue region of the electro-magnetic spectrum, that provide a sufficient amount of power and good stability.
This progress in the coherent manipulation of atoms between ground and Rydberg states is accompanied by an increased interest on the theoretical side. It was recog-nized that Rydberg atoms can play an important role in
the field of quantum information processing, using either atomic ensembles or arrays of individual atoms [23–26] (see also [27] for a recent review). In these proposals, sta-ble ground states of single atoms are used as qubit states [28–30] and the controlled coherent interaction between the qubits can be realized via an auxiliary Rydberg state. More generally the long-range interaction between atoms can be tailored and used to engineer quantum states of an ensemble of atoms or to perform quantum simula-tions [31]. A main ingredient of those proposals is the coherent excitation of an atom to a Rydberg state and the Rydberg blockade.
Recently the coherent excitation of individual atoms trapped in tight optical dipole traps led to the obser-vation of controlled interactions between two individual Rydberg atoms by two groups [32, 33]. This work was followed by the demonstration of the entanglement of two atoms [34] and of a Controlled NOT gate [35]. The aim of the present paper is to present in detail the coherent excitation of individual atoms that we used in experi-ments reported in Ref. [33, 34]. In particular we describe the details of the experimental setup and techniques, and investigate the performance of the experiment.
II. EXPERIMENTAL SETUP AND TECHNIQUES
In this section we present briefly the experimental setup and the trapping of single 87Rb atoms in optical tweezers which has been described in earlier publications [33, 34, 36]. We then detail the laser system used for the excitation of the atom from the ground state to a Rydberg state. We present the alignment technique of the laser beams on the atom. As an aside, we use this procedure to estimate the photo-ionization cross-section from the state 5p3/2. Finally, we discuss the detection of a successful excitation of the atom in the Rydberg state.
A. Single atom trapping
A single87Rb atom is held in an optical tweezers which is formed by a 810 nm laser beam focused with a high numerical aperture lens to a waist of 0.9 µm [46]. We operate the trap at a typical power of 0.5 mW which corresponds to a trap depth of 0.6 mK. The trap is loaded from an optical molasses created by three retro-reflected cooling beams with a power of about 3 mW per beam collimated to a waist of 1.8 mm. The detuning of the cooling laser from the (5s1/2, F = 2) to (5p3/2, F = 3) transition is−5Γ, where Γ/2π= 5.75 MHz is the decay rate of the 5p3/2 level. A repumping beam drives the (5s1/2, F = 1) to (5p3/2, F = 2) transition.
We detect the presence of a single atom in the dipole trap by its fluorescence light induced by the optical mo-lasses laser beams. The fluorescence photons are col-lected using the same high numerical aperture lens and detected on an avalanche photo-diode (APD) in single photon counting mode, as shown in Fig. 1. Due to the small trapping volume the number of atoms in the dipole trap is either zero or one [36].
The temperature of the atom in the optical tweezers is about 70 µK, which was measured using a release-and-recapture technique [37].
B. Laser system for Rydberg excitation
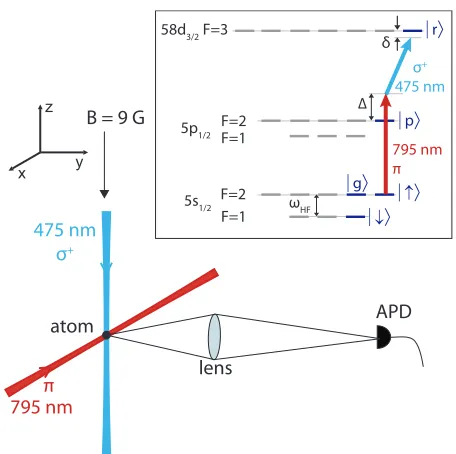
We use a two-photon transition to excite a87Rb atom from its 5s1/2 ground state to the desired Rydberg level 58d3/2. We have chosen this particular state for ex-periments involving two atoms in neighboring traps [33, 34], because of the existence of a F¨orster resonance [38, 39] between the two-atom states (58d3/2,58d3/2) and (60p1/2,56f5/2) which enhances the interaction energy between the atoms. The 5p1/2 excited state of the D1-line of rubidium is the intermediate level. Therefore, we need a laser at 795 nm and a second laser at 475 nm. As depicted in Fig. 1, the 475 nm laser isσ+-polarized and travels along the quantization axis which is defined by a magnetic field of 9 G along the z-axis. In the chamber we have about 35 mW of 475 nm light available which is
B = 9 G
x y
z
475 nm σ+
795 nm
atom APD
lens
π
F=2
5s1/2 F=1 58d3/2
795 nm π
σ+
475 nm ∆
F=2 F=1 5p1/2
F=3
ωHF
δ
↓〉 ↑〉 g〉
p〉
r〉
FIG. 1: (Color online) Scheme of the experimental setup. A single atom is trapped in a dipole trap and cooled by opti-cal molasses (not shown). The atomic fluorescence light is detected on a single-photon counting avalanche photo-diode (APD) allowing to detect the presence or absence of an atom in the dipole trap. A blueσ+
-polarized laser beam in com-bination with a π-polarized infrared laser beam at 795 nm is used to drive a two-photon transition to a Rydberg state. Inset: relevant atomic levels.
focused to a spot of 20 µm at the position of the atom. Theπ-polarized 795 nm laser has a power of about 7 mW, is applied onto the atoms from the side along thex-axis and has a waist of 130 µm. The fast switching (rise-time 10 ns) of the blue and red laser beams is done using electro-optic modulators.
We have chosen the intensities of the lasers such, that the excitation towards the Rydberg state is fast enough (≈100 ns) to ensure passive phase coherence between the two lasers for the duration of the excitation pulse (see more details below). The lasers are not actively phase-locked and we control only the frequencies of the lasers with respect to the atomic transitions.
The 795 nm laser is an external cavity diode laser (Top-tica DL100) which is locked by a feedback loop acting on the grating piezo-electric transducer. As a reference we use the D1-line of 87Rb, more precisely the transi-tion between levels (5s1/2, F = 2) and (5p1/2, F = 2). The lock scheme relies on a saturated absorption spec-troscopy. The error signal is generated using a lock-in technique by modulating the laser diode current at a fre-quency of 80 kHz. The frefre-quency of the laser is then additionally shifted by a detuning ∆ towards the blue of the transition with an acousto-optical modulator to avoid populating the intermediate state.
diode laser, by feedback onto its grating piezo-electric transducer. Here, we use a Fabry-Perot cavity to fix the 950 nm laser relative to the 795 nm laser, which gives us more freedom in the choice of the Rydberg state we are addressing. Both, the 795 nm and the 950 nm laser, are coupled to the permanently scanning cavity which has a finesse F ≈ 100 and a free spectral range of 300 MHz. The cavity is continuously sweeped with a scan frequency of about 100 Hz across the transmission peaks of both lasers. Our locking scheme relies on the stabilization of the separation between these two transmission peaks in the sweep. We use a home-made circuit to convert the time difference into a voltage. When the signal on the photodiode behind the cavity exceeds for the first time a threshold value, an integrator is started and accumulates a voltage until the photodiode signal exceeds the thresh-old value for the second time. Subtracting this value with a set voltage generates an error signal, which is treated and fed back onto the 950 nm laser.
This locking technique is only suitable for compensat-ing long-term drifts of the laser, since the bandwidth of the correcting signal is low and depends on the frequency of the Fabry-Perot cavity sweep. Moreover this method relies on the fact that the cavity piezo responds linearly, that the sweep has a very good stability in frequency and that the cavity has slow drifts. Despite those con-straints we were able to stabilize the 795-m and 950-nm lasers with respect to each other to about 4 MHz for the duration of ∼ 1 hour. We also checked the intrin-sic short term stability of the 950 nm master laser using a self-heterodyne technique. This consists in observing a beat note of the laser with itself shifted in frequency by 80 MHz and delayed by ∼7 µs using a 1.3 km long fiber. We have measured a FWHM of the beat signal of 210 kHz, leading to a linewidth of the 950-nm laser of 105 kHz [47]. Using the same technique, we have mea-sured a linewidth of the 795 nm laser of 600 kHz, which is larger because of the current modulation used to lock it on the atomic transition.
However, this method does not allow to set the wave-length of the 950 nm laser absolutely, since we do not know a priori which longitudinal mode of the cavity we address. We use a wavelength meter with an absolute ac-curacy of 10 MHz (HighFinesse-˚Angstrom WS-U) to set the frequency of the laser close to the desired frequency. The locking scheme described above has been used for all data shown in this paper and for the data discussed in [34]. For the data in [33] we used an even simpler method: the HighFinesse-˚Angstrom wavemeter provides a PID control option that generates an error signal which can be used to stabilize the laser to any desired frequency with precision of 2 MHz. Automatic recalibration of the wavemeter every 10 s using the 795 nm laser locked to 87Rb avoids long term drifts of the wavemeter. The lim-iting factor of this method is the absolute accuracy of the wavemeter, which is estimated around 5 MHz on the time scale of half an hour.
1.2
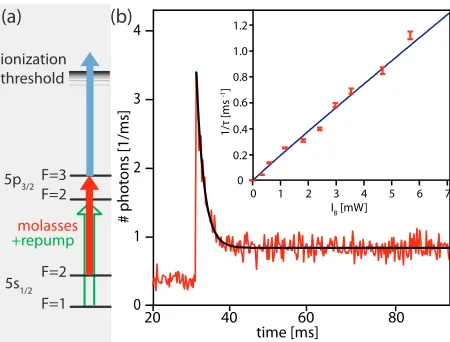
FIG. 2: (Color online) Procedure used to align the 475 nm laser onto the single atom. (a) To create population in the 5p3/2excited state, the atom is driven by the molasses beams and the repumper. From there, the 475 nm laser photo-ionizes the atom with a rate proportional to its intensity. (b) Fluores-cence signal of a single atom averaged over 100 experimental runs. At t=31 ms the atom is exposed to the optical molasses and the 475 nm laser simultaneously. The atom starts fluo-rescing on the D2-line, is photo-ionized from the 5p3/2 state by the 475 nm laser and consequently lost from the trap. The solid line is an exponential fit to the data and gives the photo-ionization rate 1/τ. The inset demonstrates the linear dependence of the inverse of the decay time constant as the function of the blue laser intensity.
C. Alignment of the 475 nm laser
In order to reach a high two-photon Rabi frequency with the limited power of the 475 nm laser available, we need to maximize the intensity of the 475 nm light focused to a spot size of about 20µm at the position of the atom. For this purpose we take advantage of the fact that light at 475 nm photo-ionizes rubidium atoms from the 5p3/2-state, see Fig. 2(a) for excitation scheme, and that the photo-ionization rate is proportional to the light intensity.
is proportional to the intensity of the 475 nm laser, see the inset of Fig. 2(b). Therefore, this method allows us to measure the beam waist of the 475 nm laser using the single atom as a probe. Keeping the laser power fixed and evaluating the photo-ionization rate for different po-sitions of the laser beam, we find wx = 22(1) µm and wy = 19(1)µm which correspond well to the values we expect for our optical setup. The laser beam is then cen-tered onto the atom using the same method.
D. Estimate of the photo-ionization cross section
The photo-ionization rate can also be used to estimate the photo-ionization cross section σ of 87Rb from the 5p3/2 state. The relation betweenσand 1/τ is given by [40]
1 τ =f
IBσ
h νB
, (1)
where IB and νB are the intensity and the frequency of the 475 nm laser, and f is the population in the 5p3/2 state. The populationf depends strongly on the param-eters of the optical molasses and is given by:
f = 1 2
c2
1Ω2mol/2
δ2
mol+ Γ2/4 +c22Ω2mol/2
, (2)
where the coefficientsc1andc2are connected to Clebsch-Gordan coefficients [41] and have values of c2
1 = c 2 2 = 0.73 [48]. Including the light-shift due to the dipole trap, the detuning of the optical molasses is δmol/2π = 100 MHz. The total Rabi frequency on the cooling transi-tion of the molasses is given by Ωmol= ¯hd
q 2Imol
cε0 , where d = 3.58×10⁻²⁹ C·m is the transition dipole matrix element [42], and Imol is the total intensity due to the optical molasses beams at the position of the atom. In our case, the estimation of this intensity can be done only approximately, since it is difficult to determine the posi-tion of the single atom within the beams. We estimate the population in the 5p3/2statef to be between 1 and 8 %. This uncertainty contributes the most to the final uncertainty of the ionization cross section.
From the fit in Fig. 2(b) we extract τ = 2.03(9) ms which was taken for a power of 7.4 mW of the 475 nm laser. The values of the ionization cross section obtained for the two extreme populationsf of the 5p3/2state are
0.2×10⁻¹⁷cm2≤σ≤1.6×10⁻¹⁷cm2 . (3)
Despite our uncertainty on f these values agree with theoretically predicted cross sections, which are between 1.25×10⁻¹⁷ cm2 and 1.4×10⁻¹⁷ cm2 from 5p-states to the ionization threshold [43], and with the experimentally measured values from the literature: 1.48(22)×10−17cm2 at 476.5 nm (see [40] and references therein).
E. Detection of Rydberg atoms
We detect a successful excitation towards the Rydberg state by a loss of the atom. Our detection method is based on the fact that Rydberg atoms are not trapped in our dipole trap, the light at 810 nm being even slightly anti-trapping for them. For a Rydberg atom the electron can almost be considered as a free particle and there-fore the Thomson model can be applied to calculate the polarizability of the atom [44]:
α=− e
2
meε0ω2
<0 , (4)
wheree is the charge of the electron, me is the mass of the electron, and ω/2π is the frequency of the applied laser. Since the light shift is proportional to−α, and in our caseα <0, the light shift is positive for all Rydberg atoms, as long as we are far from any atomic resonance between the Rydberg state and other levels. Since the positive light shift is very small (only ≈ 1 MHz), the Rydberg atoms leave the trapping region on a time scale that corresponds to their velocities at the temperature of 70µK. We have estimated the lifetime of a Rydberg atom in the dipole trap by exciting it to the Rydberg state (see section IV) and measuring the probability to drive it back to the ground state after a given time using a second laser pulse. After 10µs the atom has left the trapping region, which is faster than the radiative decay time back to the ground state which is on the order of 200µs [1]. Moreover, an atom can be photo-ionized by black-body radiation (85 µs). Photo-ionization by the dipole trap beam (1.4 ms [44]) is negligible on these timescales.
III. RYDBERG STATE SPECTROSCOPY OF A SINGLE ATOM
In this section we discuss how the desired Rydberg line is initially localized in the spectrum. Then we explain the optical pumping in state|5s1/2, F = 2, mF = 2i. From this initial state a two-photon spectroscopy of the 58d3/2 level is performed on a single atom.
A. Localizing the Rydberg lines
loading of the dipole trap is strongly perturbed, and the atomic fluorescence signal on the APD drops down to the background level.
We have observeds,p,dandf lines fornranging from 54 to 68, which have a typical separation of 5−30 GHz. The positions of the lines found with this method coin-cide within ∼ 100 MHz with respect to the calculated values, which were calculated using the quantum defect theory [1]. According to the selection rules, only s and d lines should be observable in a two step excitation. The presence of pandf lines indicates the existence of a residual electric field at the position of the atom.
With this spectroscopy method, we identified the 58d3/2line, which we use in further experiments.
B. Initial state preparation: optical pumping
In all further experiments we perform a direct two-photon excitation of a single atom trapped in the tweez-ers from its ground state |5s1/2, F = 2, mF = 2i. The atom is optically pumped into this particular state dur-ing 600 µs using two laser beams: σ+-polarized light resonant with the atomic transition |5s1/2, F = 2i to |5p3/2, F = 2i and repumping light resonant with the transition |5s1/2, F = 1i to |5p3/2, F = 2i. To ensure that there is no population left in the F = 1 ground state, the repumping light is switched off 1µs later than the pumping light. The efficiency of the optical Zeeman pumping to the state |5s1/2, F = 2, mF = 2i is about 95%, which was checked by measuring the visibility of Rabi oscillations driven by Raman transitions between the |5s1/2, F = 1, mF = 1iand |5s1/2, F = 2, mF = 2i hyperfine ground states [30].
C. Spectroscopy of the58d3/2 level
Figure 3(a) shows the time sequence used for this ex-periment. About 1 µs after the optical pumping, we switch on the 475 nm laser beam. We also switch off the dipole trap for 600 ns to avoid light shifts due to the dipole trap laser light during the Rydberg excita-tion. During this time window the 795-laser is switched on for T = 60 ns to coherently excite the free atom to the Rydberg state, as will be detailed in Section IV. Af-ter this excitation the dipole trap is switched on again, which results in the loss of the atom if it was in the Ry-dberg state and in its recapture in the optical tweezers otherwise. The frequency scan is performed by changing the absolute frequency of the 475 nm laser. For every point we repeat the experiment 100 times.
Figure 3(b) presents the resulting two-photon spec-trum. We observe a double peak structure. The two peaks have a separation of 20(1) MHz from each other. We attribute the more pronounced dip to the transi-tion to the |58d3/2, F = 3, mF = 3i state. The width
1
0.8
0.6
0.4
0.2
0
reca
ptur
e
prob
a
bility
blue laser frequency [MHz] - 631 891 000 [MHz]
690 700 710 720
680 670
on off optical pump.
795 nm laser 475 nm laser dipole trap
T
730
on off
on off
on off
(a)
(b)
FIG. 3: (Color online) Two-photon spectroscopy of the 58d3/2 line. (a) The blue laser is switched on for 600 ns. The precise timing of the two-photon transition is controlled by the dura-tionT of the infrared square pulse with a rise time less than 10 ns. The frequency scan is done by varying the frequency of the blue light. (b) The corresponding spectrum taken for T= 60 ns and (ΩR,ΩB,∆)/2π= (255,24,400) MHz, see Sec-tion IV. Each point corresponds to 100 repetiSec-tions of the experiment. The solid line is a double-Gaussian fit to the experimental points.
(FWHM) of this main peak is 16(1) MHz. It is compat-ible with the expected width (13.3 MHz) using a square pulse with durationT = 60 ns convoluted with the con-tribution from experimental imperfections (6 MHz, see section IV). These are mainly fluctuations of the ex-citation laser frequencies and intensities as well as the rise- and fall-time of the square pulse. The center of the line is at νBexp = 631 891 691(10) MHz, where the error bar results from the absolute precision of the waveme-ter. We calculate the position of this line to be at νcalc
B = 631 891 657(6) MHz using quantum defect the-ory and taking into account the light-shifts induced by the 795 nm and the 475 nm lasers and the Zeeman shifts. The difference between the calculated and measured fre-quencies of 34(12) MHz can have several reasons: an un-certainty of the light-shift induced by the 795 nm laser beam itself during the excitation (≈ 10 MHz), or the absolute precision of the wavemeter (≈10 MHz). More-over, stray electric fields, which we can not control on our setup, would also induce a shift. However, the calculated Stark shift (−240 MHz/(V/cm)2)) does not have the cor-rect sign to explain the observed frequency difference.
|58d3/2, F = 3, mF = 2i levels can be excited by the two-photon transition. Since the|5s1/2, F = 2, mF = 1i state is light-shifted by the 795 nm laser by a smaller amount than the|5s1/2, F = 2, mF = 2istate, due to a smaller Clebsch-Gordan coefficient connecting it to the corresponding Zeeman state in level (5p1/2), we expect the side dip to be at a higher frequency of the 475 nm laser, as we observe it on the measured spectrum. This is also confirmed by the fact that changing the detuning ∆ from the intermediate state from positive to negative de-tuning changes the position of the side dip from the blue to the red side of the Rydberg line. However, the area of this side dip seems to be too large to be explained only by about 5% imperfect optical pumping. Another possi-ble effect is the non-perfect polarization of the excitation laser at 475 nm.
IV. RABI OSCILLATION BETWEEN GROUND AND RYDBERG STATE
Once the state|58d3/2, F = 3, mF = 3iis localized in the spectrum, we set the frequency of the blue laser to the center of the line. By varying the pulse duration T of the 795 nm laser we observe Rabi oscillations between the ground state |5s1/2, F = 2, mF = 2i and the Ryd-berg state |58d3/2, F = 3, mF = 3i, demonstrating the coherence of the two-photon excitation. We discuss the experimental results of measurements with different Rabi frequencies of the red (795 nm) and the blue (475 nm) laser, and for different detunings from the intermediate state ∆. The measurements are compared to simulations that we performed which include intensity and frequency fluctuations present in our system.
A. Experimental results
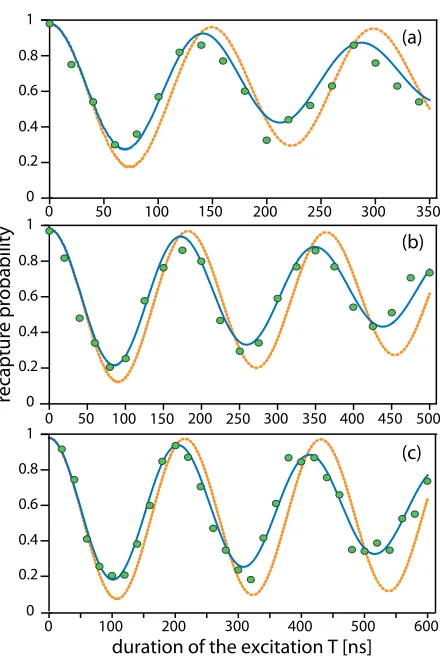
We have recorded the Rabi oscillations between ground and Rydberg states for different values of the red and blue Rabi frequencies ΩR, ΩB, and the detuning ∆. In Fig. 4 the recapture probability of the single atom is plot-ted versus the durationT of the excitation pulse. Each point corresponds to 100 repetitions of the experiment. Fig. 4(a) shows the measurement for (ΩR,ΩB,∆)/2π= (255,24,400) MHz. For these parameters we reach a maximal excitation probability towards the Rydberg state of≈70 %, and the oscillation is strongly damped. A fit to the data by the functionA−Be−T
τ cos ΩT (not
shown) yields a two-photon Rabi frequency of Ω/2π = 7.0(1) MHz and τ = 480 ns. The solid and the dotted line are results of simulations that will be discussed in the next subsection.
We attribute the damping mainly to spontaneous emis-sion from the intermediate 5p1/2state, which destroys the coherence. A second measurement, shown in Fig. 4(b), with about the same Rabi frequencies of the lasers (ΩR,ΩB)/2π= (250,28) MHz but with a larger detuning
re
cap
ture probability
duration of the excitation T [ns] (a)
(b)
(c)
0 0.4
50 100 150 200 250 300 350
0.2 0.6 0.8 1
0
100
50 150 200 250 300 350 400 450 500
0 0.4
0.2 0.6 0.8 1
0
100 200 300 400 500
0 600
0.4
0.2 0.6 0.8 1
0
FIG. 4: (Color online) Coherent Rydberg excitation of a single atom to the level |58d3/2, F = 3, mF = 3i for
different experimental parameters: (a) (ΩR,ΩB,∆)/2π = (255,24,400) MHz, (b) (ΩR,ΩB,∆)/2π= (250,28,600) MHz, and (c) (ΩR,ΩB,∆)/2π= (80,70,600) MHz. Each point cor-responds to 100 repetitions of the experiment. The blue line is the result of a Monte-Carlo simulation of the dynamics of a five-level system, which includes a decay from the interme-diate state, fluctuations of the power and of the frequency of the lasers and imperfection of the optical pumping. The dotted orange line shows for comparison the results of simula-tions with the same parameters of ΩR, ΩB, and ∆ but without fluctuations.
B. Comparison to numerical simulations
In our numerical calculation we include five atomic states, which are labeled in the level scheme of Fig. 1: in the 5s1/2ground state we define| ↓i=|F = 1, mF = 1i, | ↑i=|F = 2, mF = 2iand |gi=|F = 2, mF = 1i. We call the intermediate state |pi=|5p1/2, F = 2, mF = 2i and the Rydberg level is |ri. We take into account the spontaneous emission from the intermediate level |pito the ground state with a rate of Γ/2π = 5.75 MHz and the corresponding branching ratios of 1/2 to state | ↓i, 1/3 to | ↑i, and 1/6 to|gi[42], as well as the decay from the Rydberg state to the intermediate level with rate γ/2π= 4.8 kHz.
The time evolution of the density matrixρis governed by the master equation
where the Hamiltonian ˆH and the LiouvilleLoperators are given in the basis{| ↓i,|gi,| ↑i,|pi,|ri} by [45] splitting frequency. We include the power and frequency fluctuations of the two lasers by applying a Monte Carlo simulation. We assume that the power fluctuations of the red and the blue laser are both Gaussian distributed, and are 2.5% and 5% (FWHM), respectively, as mea-sured independently. We note that these intensity fluc-tuations also lead to a fluctuation of the frequency of the transition due the light-shift induced by the lasers on this two-photon transition, respectively Ω2
R/4∆ on the ground state and Ω2
B/4∆ on the Rydberg state. To take into account the frequency fluctuations of the lasers we assume a Gaussian distribution of the two-photon de-tuning with respect to the transition δ. This procedure would also include a potential variation in the Rydberg transition frequency by the Stark effect due to a fluctu-ating stray electric field. We take into account the effi-ciency of the optical pumping of 95 % by assuming that the remaining 5 % are in state|gi. Finally, we multiply the results of the simulation by 0.98 to account for the measured probability to recapture the atom at the end of the sequence in the absence of laser excitation. We
average over 100 evolutions of the master equation, and the solution is shown for different values of ΩR, ΩB, and ∆ in Fig. 4 as blue solid line. In order to have an idea of how the fluctuations influence the result we have added on the graphs of Fig. 4 the dotted orange line which cor-responds to the solution of the model, without including the frequency and power fluctuations of the lasers.
The simulations are in good agreement with the mea-sured data. For the simulations shown in blue in Fig. 4 we assumed fluctuations (FWHM) of the two-photon detun-ingδof 6 MHz in (a), 4.5 MHz in (b) and 4 MHz in (c). Comparing them to the results without fluctuations, we identify two main factors limiting the population trans-fer to the Rydberg state: the spontaneous emission from state|piand the fluctuations of laser frequency and in-tensity. The influence of the spontaneous emission can be reduced by decreasing the ratio Ω2
R/∆2, resulting in an increase of the contrast of the Rabi oscillations, as shown in Fig. 4(b) and (c). Moreover, we estimate from our simulations, that if we would reduce the laser frequency fluctuations to 1 MHz, we could increase the Rydberg excitation efficiency to 93 %. We finally note that the frequency fluctuation used in the model are compatible with the one estimated from measurements on the laser system (see section II B). At the present stage of the ex-periment we therefore have no evidence of a fluctuation of the transition frequency due to stray electric fields.
As a last comment, we conclude from the good agree-ment between the data and the model, that the result of the simulation is compatible with 100% efficiency of the Rydberg state detection we use on the experiment.
V. CONCLUSION
We perform coherent excitation of single atoms to the Rydberg state |58d3/2, F = 3, mF = 3i using a two-photon transition and observe Rabi oscillations with a high contrast. The observed Rabi frequency is about 7 MHz, which relaxes partially the requirements to the frequency stability of the laser system. The largest pop-ulation transfer to the Rydberg state observed is 80 %. The good agreement between the model and the data leads us to conclude that this maximal transfer efficiency is limited by the spontaneous emission from the interme-diate state and the frequency stability of the excitation lasers. In future experiments the population of the inter-mediate level can be reduced by increasing the detuning from this level and using higher power in the blue beam to keep the two-photon Rabi frequency high.
Acknowledgments
and the ERC starting grant ARENA, and the Institut Francilien des Atomes Froids (IFRAF). A. Ga¨etan and C.
Evellin are supported by a DGA fellowship. Y. Mirosh-nychenko and T. Wilk are supported by the IFRAF.
[1] T. F. Gallagher,Rydberg Atoms, Cambridge (1994). [2] C. H. Greene, A. S. Dickinson, and H. R. Sadeghpour,
Phys. Rev. Lett.85, 2458 (2000).
[3] C. Boisseau, I. Simbotin, and R. Cˆot´e, Phys. Rev. Lett.
88, 133004 (2002).
[4] S. M. Farooqi, D. Tong, S. Krishnan, J. Stanojevic, Y. P. Zhang, J. R. Ensher, A. S. Estrin, C.Boisseau, R. Cˆot´e, E. E. Eyler, and P. L. Gould, Phys. Rev. Lett.91, 183002 (2003).
[5] V. Bendkowsky, B. Butscher, J. Nipper, J. P. Shaffer, R. L¨ow, and T. Pfau, Nature458, 1005 (2009).
[6] K. R. Overstreet, A. Schwettmann, J. Tallant, D. Booth, and J. P. Shaffer, Nature Phys.5, 581 (2009).
[7] D. Tong, S. M. Farooqi, J. Stanojevic, S. Krishnan, Y. P. Zhang, R. Cˆot´e, E. E. Eyler, and P. L. Gould, Phys. Rev. Lett.93, 063001 (2004).
[8] K. Singer, M. Reetz-Lamour, T. Amthor, L. G. Marcassa, and M. Weidem¨uller, Phys. Rev. Lett.93, 163001 (2004). [9] K. Afrousheh, P. Bohlouli-Zanjani, D. Vagale, A. Mug-ford, M. Fedorov, and J. D. D. Martin, Phys. Rev. Lett.
93, 233001 (2004).
[10] T. Cubel Liebisch, A. Reinhard, P. R. Berman, and G. Raithel, Phys. Rev. Lett. 95, 253002 (2005). See also Phys. Rev. Lett.98, 109903(E) (2007).
[11] T. Vogt, M. Viteau, J. Zhao, A. Chotia, D. Comparat, and P. Pillet, Phys. Rev. Lett.97, 083003 (2006). [12] J. Deiglmayr, M. Reetz-Lamour, T. Amthor, S.
Wester-mann, A. L. de Oliveira, and M. Weidem¨uller, Opt. Com-mun.264, 293 (2006).
[13] M. Reetz-Lamour, T. Amthor, J. Deiglmayr, and M. Wei-dem¨uller, Phys. Rev. Lett.100, 253001 (2008).
[14] R. Heidemann, U. Raitzsch, V. Bendkowsky, B. Butscher, R. L¨ow, L. Santos, and T. Pfau, Phys. Rev. Lett. 99, 163601 (2007).
[15] R. Heidemann, U. Raitzsch, V. Bendkowsky, B. Butscher, R. L¨ow, and T. Pfau, Phys. Rev. Lett. 100, 033601 (2008).
[16] U. Raitzsch, V. Bendkowsky, R. Heidemann, B. Butscher, R. L¨ow, and T. Pfau, Phys. Rev. Lett. 100, 013002 (2008).
[17] T. A. Johnson, E. Urban, T. Henage, L. Isenhower, D. D. Yavuz, T. G. Walker, and M. Saffman, Phys. Rev. Lett.
100, 113003 (2008).
[18] Z. Zuo, M. Fukusen, Y. Tamaki, T. Watanabe, Y. Nak-agawa, and K. NakNak-agawa, Optics Express 17, 22898 (2009).
[19] A. K. Mohapatra, T. R. Jackson, and C. S. Adams, Phys. Rev. Lett.98, 113003 (2007).
[20] H. K¨ubler, J. P. Shaffer, T. Baluktsian, R. L¨ow, and T. Pfau, Nature Photonics4, 112 (2010).
[21] K. J. Weatherill, J. D. Pritchard, R. P. Abel, M. G. Ba-son, A. K. Mohapatra, and C. S. Adams, J. Phys. B.41, 201002 (2008).
[22] H. Schempp, G. G¨unter, C. S. Hofmann, C. Giese, S. D. Saliba, B. D. DePaola, T. Amthor, M. Weidem¨uller, S. Sevin¸cli, and T. Pohl, Phys. Rev. Lett. 104, 173602 (2010).
[23] D. Jaksch, J. I. Cirac, P. Zoller, S. L. Rolston, R. Cˆot´e, and M. D. Lukin, Phys. Rev. Lett.85, 2208 (2000). [24] M. D. Lukin, M. Fleischhauer, R. Cˆot´e, L. M. Duan, D.
Jaksch, J. I. Cirac, and P. Zoller, Phys. Rev. Lett.87, 037901 (2001).
[25] D. Møller, L. B. Madsen, and K. Mølmer, Phys. Rev. Lett.100, 170504 (2008).
[26] M. M¨uller, I. Lesanovsky, H. Weimer, H. P. B¨uchler, and P. Zoller, Phys. Rev. Lett.102, 170502 (2009).
[27] M. Saffman, T. G. Walker, and K. Mølmer, arXiv:0909.4777v2 (2010).
[28] S. Kuhr, W. Alt, D. Schrader, I. Dotsenko, Y. Miroshny-chenko, W. Rosenfeld, M. Khudaverdyan, V. Gomer , A. Rauschenbeutel, and D. Meschede, Phys. Rev. Lett.91, 213002 (2003).
[29] D. D. Yavuz, P. B. Kulatunga, E. Urban, T. A. Johnson, N. Proite, T. Henage, T. G. Walker, and M. Saffman, Phys. Rev. Lett.96, 063001 (2006).
[30] M. P. A. Jones, J. Beugnon, A. Ga¨etan, J. Zhang, G. Messin, A. Browaeys, and P. Grangier, Phys. Rev. A,
75, 040301(R) (2007).
[31] H. Weimer, M. M¨uller, I. Lesanovsky, P. Zoller, and H. P. B¨uchler, Nature Phys.6, 382 (2010).
[32] E. Urban, T. A. Johnson, T. Henage, L. Isenhower, D. D. Yavuz, T. G.Walker, and M. Saffman, Nature Phys. 5, 110 (2009).
[33] A. Ga¨etan, Y. Miroshnychenko, T. Wilk, A. Chotia, M. Viteau, D. Comparat, P. Pillet, A. Browaeys, and P. Grangier, Nature Phys.5, 115 (2009).
[34] T. Wilk, A. Ga¨etan, C. Evellin, J. Wolters, Y. Miroshny-chenko, P. Grangier, and A. Browaeys, Phys. Rev. Lett.
104, 010502 (2010).
[35] L. Isenhower, E. Urban, X. L. Zhang, A. T. Gill, T. Henage, T. A. Johnson, T. G. Walker, and M. Saffman, Phys. Rev. Lett.104, 010503 (2010).
[36] N. Schlosser, G. Reymond, I. Protsenko, and P. Grangier, Nature411, 1024 (2001).
[37] C. Tuchendler, A. M. Lance, A. Browaeys, Y. R. P. Sor-tais, and P. Grangier, Phys. Rev. A78, 033425 (2008). [38] T. G. Walker, and M. Saffman, Phys. Rev. A77, 032723
(2008).
[39] A. Reinhard, K. C. Younge, and G. Raithel, Phys. Rev. A78, 060702(R) (2008).
[40] C. Gabbanini, S. Gozzini, and A. Lucchesini, Optics Communications141, 25 (1997).
[41] C. G. Townsend, N. H. Edwards, C. J. Cooper, K. P. Zetie, C. J. Foot, A. M. Steane, P. Szriftgiser, H. Perrin, and J. Dalibard, Phys. Rev. A52, 1423 (1995).
[42] D. A. Steck, Rubidium 87 D line data, http://steck.us/alkalidata (2008).
[43] M. Aymar, O. Robeaux, and S. Wane, J. Phys. B17, 993 (1984).
[44] M. Saffman, and T. G. Walker, Phys. Rev. A,72, 022347 (2005).
[45] M. Fleischauer, A. Imamoglu, and J. P. Marangos, Rev. Mod. Phys.77, 633 (2005).
radius.
[47] We assume that the corresponding linewidth of the light generated at 475 nm is twice larger, although we could not measure it directly.
[48] Although these values were originally measured for Cs atoms, we use them for87