Recap
Cara menentukan nilai ekstrim mutlak:
1. Pastikan bahwa fungsi itu kontinyu pada interval
2. Temukan nilai f pada critical points dan endpoints/ titik ujung
NILAI MAKSIMUM DAN MINIMUM
Second Derivative Test for Local Extrema
Suppose that 𝑥 = 𝑐 is a critical point of 𝑓(𝑥) such that 𝑓′ 𝑐 = 0 and
that 𝑓′′ 𝑥 is continuous in a region around 𝑥 = 𝑐. Then,
1. If 𝑓′′ 𝑐 < 0 then 𝑥 = 𝑐 is a relative maximum.
2. If 𝑓′′ 𝑐 > 0 then 𝑥 = 𝑐 is a relative minimum.
3. If 𝑓′′ 𝑐 = 0 then 𝑥 = 𝑐 can be a relative maximum, relative
minimum or neither.
Calculus I 6
Example 9
Use the second derivative test to classify the critical points of the function,
ℎ 𝑥 = 3𝑥5 − 5𝑥3 + 3
Solution:
ℎ′ 𝑥 = 15𝑥4 − 15𝑥2 = 15𝑥2 𝑥2 − 1 = 15𝑥2 𝑥 − 1 𝑥 + 1 ℎ′′ 𝑥 = 60𝑥3 − 30𝑥 = 30𝑥 2𝑥2 − 1
Critical points: 𝑥 = −1, 𝑥 = 0, and 𝑥 = 1
ℎ′′ −1 = −30, ℎ′′ 0 = 0, ℎ′′ 1 = 30
Calculus I 7
The Shape of a Graph
local maximum
local minimum not local
Points of Inflection
𝑦 = 3 + sin 𝑥 𝑏𝑒𝑟𝑢𝑏𝑎ℎ 𝑘𝑒𝑐𝑒𝑘𝑢𝑛𝑔𝑎𝑛𝑛𝑦𝑎 𝑝𝑎𝑑𝑎 𝑡𝑖𝑡𝑖𝑘 (𝜋, 3)
Pada x=0
𝑃𝑎𝑑𝑎 𝑥 = 0 𝑓′′ 𝑥 𝑡𝑖𝑑𝑎𝑘 𝑡𝑒𝑟𝑑𝑒𝑓𝑖𝑛𝑖𝑠𝑖
Kecekungan berubah
𝑓′′ 𝑥 < 0 𝑝𝑎𝑑𝑎 𝑥 < 0 𝑑𝑎𝑛 𝑓′′ 𝑥 > 0 𝑝𝑎𝑑𝑎 𝑥 > 0
𝑓′′ 𝑥 𝑏𝑒𝑟𝑢𝑏𝑎ℎ 𝑡𝑎𝑛𝑑𝑎 𝑝𝑎𝑑𝑎 𝑥 = 0,
𝑤𝑎𝑙𝑎𝑢𝑝𝑢𝑛 𝑓′′ 𝑥 = 0 𝑝𝑎𝑑𝑎 𝑥 = 0, 𝑡𝑎𝑛𝑑𝑎 𝑓′′ 𝑥 𝑡𝑖𝑑𝑎𝑘 𝑏𝑒𝑟𝑢𝑏𝑎ℎ,
𝑓′′ 𝑥 > 0 𝑢𝑛𝑡𝑢𝑘 𝑥 < 0 𝑑𝑎𝑛 𝑥 > 0 𝑦′′ = 12𝑥2
Tidak ada inflection point
16
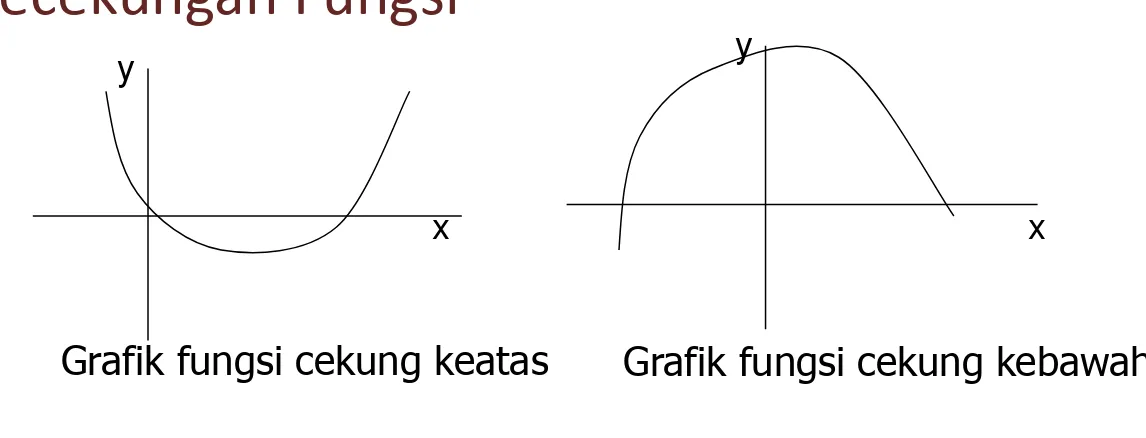
Kecekungan Fungsi
Fungsi 𝑓(𝑥) dikatakan cekung ke atas pada interval 𝐼 bila naik pada
interval 𝐼, dan 𝑓(𝑥) dikatakan cekung kebawah pada interval 𝐼 bila turun
pada interval I.
Teorema 6 Uji turunan kedua untuk kecekungan
1. Jika , maka f cekung ke atas pada I. 2. Jika , maka f cekung ke bawah pada I.
) ( ' x f ) ( ' x f
I
x
x
f
"
(
)
0
,
I
x
x
f
"
(
)
0
,
Grafik fungsi cekung keatas Grafik fungsi cekung kebawah
x y
17 2 2 ) 2 ( 4 ) ( ' x x x x f 2 4 2 ) ( 2 x x x x f
Tentukan selang kecekungan dari
Contoh :
Jawab : 4 2 2
)
2
(
)
4
)(
2
(
2
)
2
)(
4
2
(
)
(
''
x
x
x
x
x
x
x
f
4 2)
2
(
))
4
(
2
)
2
)(
4
2
)((
2
(
x
x
x
x
x
x
3 2 2)
2
(
8
2
8
8
2
x
x
x
x
x
3)
2
(
8
x
Grafik f cekung keatas pada
(
2
,
)
dan cekung kebawah padaselang (,2)
18
c f(c)
(c,f(c)) titik belok
c f(c)
(c,f(c)) titik belok
Karena disebelah kiri c cekung keatas dan disebelah kanan c cekung kebawah
19
c f(c)
(c,f(c)) bukan titik belok
Karena disekitar c tidak
Terjadi perubahan kecekungan
c
Walaupun di sekitar c
Terjadi perubahan
20
1
2
)
(
.
1
f
x
x
3
4
)
(
.
2
f
x
x
Tentukan titik belok (jika ada) dari
2
6
)
(
'
x
x
f
,
f
''
(
x
)
12
x
●
0
+++++++ ---
Di x = 0 terjadi perubahan kecekungan, dan f(0)= -1 maka (0,-1) merupakan titik belok
2
12
)
(
''
x
x
f
●
0
+++++++ +++++++
21
2
4
2
)
(
.
3
2
x
x
x
x
f
3)
2
(
8
)
(
''
x
x
f
● 2 +++++ ---Walaupun di x = 2, terjadi perubahan kecekungan, tidak ada
titik belok karena fungsi f(x) tidak terdefinisi di x = 2
f”(x)
x Tida
Example 8
For the following function identify the intervals where the function is increasing and decreasing and the intervals where the function is concave up and concave down. Use this information to sketch the graph.
ℎ 𝑥 = 3𝑥5 − 5𝑥3 + 3
Solution:
ℎ′ 𝑥 = 15𝑥4 − 15𝑥2 = 15𝑥2 𝑥 − 1 𝑥 + 1 ℎ′′ 𝑥 = 60𝑥3 − 30𝑥 = 30𝑥 2𝑥2 − 1
Critical points: 𝑥 = −1, 𝑥 = 0, and 𝑥 = 1
Calculus I 22
Example 8
For the following function identify the intervals where the function is increasing and decreasing and the intervals where the function is concave up and concave down. Use this information to sketch the graph.
ℎ 𝑥 = 3𝑥5 − 5𝑥3 + 3
Solution:
Calculus I 23
The Shape of a Graph
decreasing decreasing increasing
increasing
local maximum
local minimum not local
Example 8
For the following function identify the intervals where the function is increasing and decreasing and the intervals where the function is concave up and concave down. Use this information to sketch the graph.
ℎ 𝑥 = 3𝑥5 − 5𝑥3 + 3
Solution:
Second derivative test for concavity:
ℎ′′ 𝑥 = 30𝑥 2𝑥2 − 1 = 0
𝑥 = 0, 𝑥 = ± 1
2 = ±0.7071
Calculus I 24
Example 8
For the following function identify the intervals where the function is increasing and decreasing and the intervals where the function is concave up and concave down. Use this information to sketch the graph.
ℎ 𝑥 = 3𝑥5 − 5𝑥3 + 3
Solution:
Calculus I 25
The Shape of a Graph
concave up concave up
Example 8
For the following function identify the intervals where the function is increasing and decreasing and the intervals where the function is concave up and concave down. Use this information to sketch the graph.
ℎ 𝑥 = 3𝑥5 − 5𝑥3 + 3
Solution:
Calculus I 26
Second Derivative Test for Local Extrema
Suppose that 𝑥 = 𝑐 is a critical point of 𝑓(𝑥) such that 𝑓′ 𝑐 = 0 and
that 𝑓′′ 𝑥 is continuous in a region around 𝑥 = 𝑐. Then,
1. If 𝑓′′ 𝑐 < 0 then 𝑥 = 𝑐 is a relative maximum.
2. If 𝑓′′ 𝑐 > 0 then 𝑥 = 𝑐 is a relative minimum.
3. If 𝑓′′ 𝑐 = 0 then 𝑥 = 𝑐 can be a relative maximum, relative
minimum or neither.
Calculus I 27
Example 9
Use the second derivative test to classify the critical points of the function,
ℎ 𝑥 = 3𝑥5 − 5𝑥3 + 3
Solution:
ℎ′ 𝑥 = 15𝑥4 − 15𝑥2 = 15𝑥2 𝑥2 − 1 = 15𝑥2 𝑥 − 1 𝑥 + 1 ℎ′′ 𝑥 = 60𝑥3 − 30𝑥 = 30𝑥 2𝑥2 − 1
Critical points: 𝑥 = −1, 𝑥 = 0, and 𝑥 = 1
ℎ′′ −1 = −30, ℎ′′ 0 = 0, ℎ′′ 1 = 30
Calculus I 28
The Shape of a Graph
local maximum
local minimum not local
Exercises
For each of the functions in this exercise, answer each of the following.
a) Identify the critical points of the function.
b) Determine the open intervals on which the function increases and decreases.
c) Classify the critical points as relative maximums, relative minimums or neither.
d) Determine the open intervals on which the function is concave up and concave down.
e) Determine the inflection points of the function.
f) Use the information from steps (a) – (e) to sketch the graph of the function.
Calculus I 29
Exercises
Calculus I 30
The Shape of a Graph
1.
𝑓 𝑥 = 10 − 30𝑥
2+ 2𝑥
32.
𝑔 𝑤 = 𝑤 𝑤 − 4
133.
ℎ 𝑡 = 3𝑡 − 5 sin 2𝑡 on −1,4
4.
𝑓 𝑥 = 3𝑥𝐞
1−14𝑥2