Rifai Afin,Do Wages Reflect Productivity Under Minimum Wage Setting? 71 DO WAGES REFLECT PRODUCTIVITY UNDER
MINIMUM WAGES SETTING? Evidence from Indonesia Firm Level Survey
Rifai Afin
Universitas Trunojoyo Madura
Abstrak
Penelitian ini menginvestigasi pengaruh pendidikan pada produktifitas tenaga kerja dan upah pada skema kebijakan upah minimum pada sektor manufaktur di Indonesia. Menggunakan data tingkat perusahaan, studi ini mengidentifikasi faktor yang mempengaruhi output dan upah pada tingkat perusahaan dan menggunakan data tingkat regional untuk menginvestigasi pengaruh upah minimum pada perubahan upah.
Temuan pertama, tenaga kerja dengan 9 dan 12 tahun pendidikan mengalami diminishing marginal produktifitas dan tingkat pendidikan lain konsisten dengan human capital theory dan sebagian besar varibel kontrol secara positif berpengaruh terhadap output dan upah. Kedua, pendidikan dan variabel lain mempengaruhi output dan upah dengan pola yang sama yang mengindikasikan dengan kuat bahwa pengusaha membayar upah berdasarkan kinerja para pekerjanya. Ketiga, upah minimum secara statistik signifikan mempengaruhi upah. Hal ini menunjukkan bahwa upah minimum adalah pedoman bagi pengusaha dalam memberikan pembayaran minimum atas jasa pekerja, tetapi jika pekerja ingin lebih maka harus berbuat lebih baik.
Kata kunci: Produktivitas,Upah, Kebijakan Upah Minimum
INTRODUCTION
In competitive market, wage is a result of market clearing process of the labour market, the intersection between labour supply and demand function. Nominal wage is as a result of multiplication of product price and marginal productivity of labour or in other words is the value of marginal productivity of labour. Increasing nominal wage might reflect increasing price or marginal productivity of labour, which is in the demand side, can make movement along demand function of labour downward. In the contrary, labour supply function has positive slope which means that the higher the wage the higher the motivation of labour to join in labour market. Government, as the regulator, sets nominal wage that satisfies both firm and labour through minimum wage
policy. Considering economic situation such as price or inflation, economic
growth, and unemployment,
government formulate nominal wage moderately. Market competition determines wage through interaction between employer, in the demand side, and workers in the supply side but in the minimum wage law context, this may not always work.
Rifai Afin,Do Wages Reflect Productivity Under Minimum Wage Setting? 72
Kling (2001), Blackburn and Neumark (1995), Altonji (1993), Harmon and Walker (1995), Ashenfelter and Zimmerman (1997), and Bonjour, Cherkas, Haskel, Hawkes, and Spector (2003). This evidence shows that education has important role to generate earnings but according to Chevalier, Harmon, Walker and Zhu (2004), this is not clear whether the effect of education on wages is because educated workers have high productivity or signalling of education level on worker’s ability. Some other studies such as Besen (1968), Griliches (1968), Khaldi (1975), Lockheed, Jamison, and Lau (1980), Pudasaini (1983), and Weir (1999), investigate effect of education on productivity.
Most studies on the relationship of education, wage, and productivity have sort of lack the interconnection of this three components. In the one side, some studies partially focus on the relationship between education and real labour productivity but in the other side concern about the effect of education on earnings by arguing that earnings represent labour productivity. Jones (1994) tried to identify the effect of education on both productivity and earnings in industrial sector. This paper contributes to the further question by investigating the interrelationship between the triangle of education, productivity, and earnings as well as how minimum wage set by the government behaves in the two labour performance indicator, productivity and earnings. More specifically, this paper has several questions to be addressed. Firstly, how is the effect of education and other control variables on labour productivity and earnings? Secondly, do other factors, besides education, have the same pattern as predicted by level of education on affecting productivity and wages? Third, where is the position of
minimum wage set by the local government compared to productivity and nominal wages?, and does the minimum wage setting affect wages?.
This paper is structured as follows: the following section describes theoretical foundation on how education affects productivity and earnings and how minimum wage policy affects wages. Section three explores data and empirical investigation method by proposing econometric model, estimation techniques, the strategy how the outcome of empirical methods answer the questions, and data sources. Section four explores the results of empirical study examined in section three. Last section, five, brings us to the concluding remarks.
THEORETICAL REVIEW Human Capital Theory
Rifai Afin,Do Wages Reflect Productivity Under Minimum Wage Setting? 73
stated some criticisms of marginal productivity theory. The first argument is that the assumption of ability of employers to measure marginal cost and marginal revenue is implausible and this is supported by empirical evidence by Lester (1946) who strongly attacked the marginality concept. The argument to refuse marginal productivity idea is the assumption of profit maximization. They argue that this assumption is invalid in the general areas of economy especially in the public sector. This argument seems to be a common issue that shows the limitation of market clearing process. The third objection of accepting marginal productivity theory is about the nature of technology. They argue ‘’specific marginal product value are not related to specific employment levels but to ranges of employment’’. At this rate, the marginal productivity of labour positively depends on the employment ranges (discontinuity of labour demand function).The last but not least of the main objection of marginal productivity theory. According to Oi (1962), labour is not perfectly variable but has fixed cost in part, such as hiring and training cost, which is called labour as a quasi-fixed factor, consequently, employer rationally decides allocation of labour cannot only be based on the relation of wages and marginal value of product but also fixed cost that must be paid in the future of that quantity of labour. These four main objections of marginal productivity theory are very critical in this particular research.
Regardless the objections to marginal productivity theory, many studies, some of them have already been mentioned in the section I, concern about empirical test on the factors affecting marginal productivity and wages in micro economic level that is basically from marginal productivity
model. Most of those studies show that
education or human capital
accumulation has significant effect on increasing real productivity of labour and wages as well. At this level, the connection of education to productivity and wages seems not straightforward like general views on this particular topic. In the first line, a problem starts from education effect on productivity. In this step, trouble arises when we define education such as general or specific training (Becker, 1975) and skills measure (level of education or scoring test). In the second line, the problem is how to represent productivity in terms of wages like previously discussed that there are four
main objections to marginal
productivity theory so that it is presumably more complicated.
Rifai Afin,Do Wages Reflect Productivity Under Minimum Wage Setting? 74
human capital the higher level of innovation that a country could reach. Moreover, in this approach, the only factor of production in the production function is physical capital or past innovation. Therefore, if the physical capital increases economic growth, it means that that human capital which is included in the innovation has significant effect on growth.
In the other side, Lucas (1988) proposes model focusing on mechanism of the effect of human capital on economic growth through schooling and learning by doing. Workers who are just hired perform their job depending on the skills that they bring before being hired but in the meantime they learning and experience that make them perform better. According to Delsen and Schonewille (1999), Lucas identifies that there is direct effect of human capital on production process, and assuming that human capital is another factor of production process besides labour and physical capital. Thus, the higher the level of human capital stock the higher the economic growth. Estimating the effect of human capital effect on the production function which is based on the Lucas approach will be more straightforward that Nelson and Phelps approach.
However, empirical tests of
human capital theory in the
macroeconomic context result in different conclusion among studies. Some studies such as Benhabib and Spiegel (1994), Barro (2001), and Islam (1995) conclude that there is no significant effect of human capital indicator on economic growth. In the contrary, Temple (1999), Ciccone and Papaioannou (2005), Cohen and Soto (2006) in their studies summarize that human capital has significant impact on economic growth. Some arguments that have been proposed regarding these
results are that the results depend on the quality of the data. Cohen and Soto use the survey data in which the classification of education system is uniform. At this stage, we may conclude that the effect of education on economic growth faces more technical problems rather that debating among existing theories.
Signalling Theory
The most courageous theory challenging human capital theory is signalling theory. Basically, signalling theory assumes that there is no clear information on individual worker when employers hire them and in the short run after hiring them. This means there is asymmetric information in the process of transaction in the job market. In other words, education does not inform employer the true ability of workers therefore the relationship of education and productivity and earnings might not be causal (Cahuc and Zylberberg, 2004). According to Spence (1973) employers only identify workers based on their personal data, such as education level, race, sex, and age rather than measuring marginal product of workers. Besides that, there are always some potential sources of information that are needed by employers to categorize their wages such as previous job position, wages, criminal and or reference from previous employer, medical condition.
Rifai Afin,Do Wages Reflect Productivity Under Minimum Wage Setting? 75
proportion of the two groups, let a1 be the proportion of people in group 1 and (1-a1) or a2 be the proportion of people in group 2 and there are two kinds of jobs in the labour market for simplifying. Productivity of group i in job j with education E is represented by the fij(E).
Some assumptions need to be imposed to make the model works. Firstly, employers make decision on hiring workers based on their observation on obtained education of workers without knowing their productivity. Secondly, in the labour side, workers find the job that is suitable with their expected productivity conditional on their education level and finally, in the equilibrium of the job market, labour receives income in which their productivity is used as a basis. In this such situation, individual therefore invest in education based on what they expect from future income and allocates their educational fund as much as the amount of expected income.
Let use our model to know what will happen in the signalling theory. In signalling, productivity of workers does not depend on the education, so that we can write fi1=fi2=fi for group i = 1, 2. If
E* is the number of schooling that satisfies the inequalities:
2 1 2 * 1
1 2
c f f E c
f
f (1)
By assumption, f2>f1 and c2>c1 and the wages offered if f1 if E<E* and f2 if E≥E* the equilibrium can be written in the Table 1 as follows.
The essential finding from this model is that the private and social returns to education differ. As its consequence, group two invest more in education whereas the optimum is just when E=0 for both groups. Wages would be 1f12f2for every group. It
benefit group 1 but not group two because group 1 must invest more in education. In signalling, people pursue more education not because of they will be paid more but to distinguish among others.
Table 1. Pure Signalling Equilibrium
Group Productivity Education
Cost
Wages Education Spending E = 0 E = E*
Group 1 f1 f1 E1 f1 0
Group 2 f2 f2 E2 f2 C2E*
Note: Bold indicate equilibrium productivities
Table 2. Pure Human Capital Equilibrium
Group Productivity Education
Cost
Wages Education Expenditure E = 0 E = E*
Group 1 f1 f1 E1 f1 0
Group 2 f2 f2 E2 f2 C2E*
Rifai Afin,Do Wages Reflect Productivity Under Minimum Wage Setting? 76
In human capital model, assume that fij(E) f(E)for both group and
both kinds of jobs and consider that 1
) 0
( f
f and f(E*) f2 as well as E
satisfies the equation 2.1 above then the equilibrium is similar to in pure signalling model as shown in Table 2 and the only difference from pure signalling is that off diagonal terms so that it has another implication which is wages. In human capital equilibrium, wages is offered at different levels depending on the level of education. Educated worker is more productive.
Minimum Wage Setting
In market clearing mechanism, wage is determined by the value of marginal productivity of workers themselves. Employers offer wages based on their observation to their worker’s performance. The government could do intervention labour market process through setting the minimum wage policy. Keynesian views minimum wages as anchor for price level. Minimum wages force the wage structure and cause movement of income distribution among workers. In the contrary, classical view of minimum wages argues that minimum wages have negative effect on employment. Some empirical studies confirm those theories. Bryan, Salvatori, and Taylor (2012) find that minimum wage negatively affect the earnings for young workers even though they still question the imprecise estimation results. Maloney and Mendez (2004) support empirically that minimum wages strongly affect real wages. Meyer and Wise (1983) find that there is no earnings effect because of minimum wage changes. Bazen and Martin (1991) find that minimum wages has increased real wages of youth employment but it could have negative effect on youth employment as well. Until now, there is no single consensus
on this particular theoretical and empirical study.
DATA AND METHODOLGY Research Framework
The strategy which is used in this study emerges from the basic idea that employer should know how qualified their employees represented by their productivity that their wages can be based on. By identifying the effect of education on real productivity and wages and make comparison of those effects we may come to the conclusion that, intuitively, employers, rationally, pay their workers based on their productivity regardless initial working contract, employers can make revision of contract based on the evaluation of workers actual productivity. If there is a worker who is caught shirking or the worker performance is not like what they expect, the employer will make some revision on wage payment so that the wage must always represent the actual productivity of workers. The question is whether the effect of education on productivity increasing with the level of education and does the effect of education on productivity is followed by the proportional increase in wages. The next question is where does the minimum wages that has been set by the government lies on between value of productivity and received wages.
Data Sources
Rifai Afin,Do Wages Reflect Productivity Under Minimum Wage Setting? 77
census and manufacturing survey. The question on those two surveys are typically designed but in economic census we will find more information such as level of worker’s education and firm administration status but this
census is conducted once in ten years and the only census of manufacturing that can be accessed is census in 2006 containing 25,694 firms with medium and large scale of production.
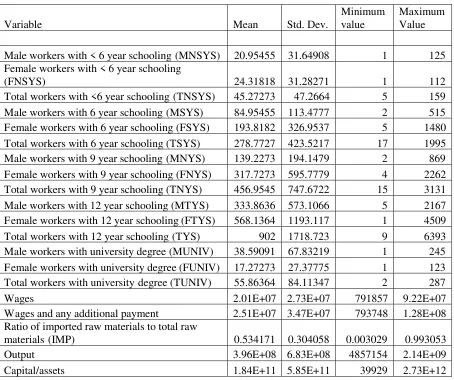
Table 3. Variable Statistic Summary
Variable Mean Std. Dev.
Minimum value
Maximum Value Male workers with < 6 year schooling (MNSYS) 20.95455 31.64908 1 125 Female workers with < 6 year schooling
(FNSYS) 24.31818 31.28271 1 112
Total workers with <6 year schooling (TNSYS) 45.27273 47.2664 5 159 Male workers with 6 year schooling (MSYS) 84.95455 113.4777 2 515 Female workers with 6 year schooling (FSYS) 193.8182 326.9537 5 1480 Total workers with 6 year schooling (TSYS) 278.7727 423.5217 17 1995 Male workers with 9 year schooling (MNYS) 139.2273 194.1479 2 869 Female workers with 9 year schooling (FNYS) 317.7273 595.7779 4 2262 Total workers with 9 year schooling (TNYS) 456.9545 747.6722 15 3131 Male workers with 12 year schooling (MTYS) 333.8636 573.1066 5 2167 Female workers with 12 year schooling (FTYS) 568.1364 1193.117 1 4509 Total workers with 12 year schooling (TYS) 902 1718.723 9 6393 Male workers with university degree (MUNIV) 38.59091 67.83219 1 245 Female workers with university degree (FUNIV) 17.27273 27.37775 1 123 Total workers with university degree (TUNIV) 55.86364 84.11347 2 287
Wages 2.01E+07 2.73E+07 791857 9.22E+07
Wages and any additional payment 2.51E+07 3.47E+07 793748 1.28E+08 Ratio of imported raw materials to total raw
materials (IMP) 0.534171 0.304058 0.003029 0.993053
Output 3.96E+08 6.83E+08 4857154 2.14E+09
Rifai Afin,Do Wages Reflect Productivity Under Minimum Wage Setting? 78
In the other side, annual manufacturing survey does not contain that kinds of information. Mostly, other studies use only labour individual survey that cannot describe the true productivity of labour; moreover it cannot be compared to wages. The second part of this study is estimating the effect of minimum wage on low job position or under supervisor wages in manufacturing sector using panel regional level data which contain eight years and four regions those are region 1 (West Java, Jakarta, Banten), region 2 (Middle Java, and Jogjakarta), region three (East Java and Bali), region 4 (Sumatra, Kalimantan, Irian Jaya or papua, and Sulawesi). This panel data are provided by Central Bureau of Statistics (Badan Pusat Statistik). Some supporting data for the qualitative assessment are taken and explored from some documents of Ministry of Labour and Transmigration.
Econometric Model
There are three types of estimated models for this study. The first is output models for measuring marginal productivity of workers. The second is wages function that has the same predictors with output function. Both models are the same, only have different dependent variables, because, by assumption, marginal productivity reflects wages but even though they have the same explanatory, some of variables have different meaning. Jones (1994) also runs similar model to compare output function and wages and only removes capital in the wages function. The empirical models applied in this study are taken from the production function and wages function. Both types of model are estimated in several forms of nested and non nested models containing five models each type function. Running these models
needs some estimation techniques and we cover this by implementing OLS (Ordinary Least Squares). The estimated models of production function (Cobb-Douglas) are described below:
Q = f (X, Z, S) (2)
Q represents for output variable, X denotes input variables, Z is firm Characteristics, and S denotes schooling variables. In this part, the strategy used is estimating separately output and wages function between male and female workers and total workers per level of education and the role of non labour inputs. Separation of gender aims to see clearly whether gender has important role on production while separating other factors such as capital and energy. The mathematical model 2 can be derived into econometric models in the logarithm as follows:
)
There are 13 control variables included in the models to make sure that there is no omitted variable bias. Since this study aims to identify how well marginal productivity proxy wages and, the model for estimating output and wages is the same model even though they could have different meaning on the model. The wages model is as follows:
Rifai Afin,Do Wages Reflect Productivity Under Minimum Wage Setting? 79
dynamic model for time series data but they omit price level on their model and also Neumark, Sehweitzer, and Wascher (2000) approach using two time difference for estimating minimum wage effect on wage distribution. In this case, difference in wages is used as dependent variable and current minimum wages and its lag 1, price level, and lag 1 of wages as explanatory variables. If price level is significant it means that the wages changes are partly caused by price changes and as its consequence, wages changes do not fully increase welfare. The model is written below:
∆lwages is the wages changes, MW is minimum wage, PI denotes price level, αi is the unknown intercept for each entity, uitis the error term. The model is
already specified in fixed effect model.
RESULTS AND ANALYSIS Empirical Facts of Education, Earnings, and Minimum Wages in Manufacturing Sector
This chapter is divided into two parts, those are qualitative and quantitaive or formal test assessment of wages, education, and productivity, as well as minimum wages policy both in total labour markets and manufacturing sector generally known as returns to
education. While in the qualitative approach, graphical analysis are used to describes how wages, education, productivity, and minimum wages interact and intuitively interpreted, quantitative approach applies some econometric models and tests the effect of education on productivity and wages.
Qualitative Assessment Labour Education Level
Rifai Afin, Do Wages Reflect Pr
Graph
Source: Calculated fro Manufacturing, 2006
The second me
consequence of the first a the context of returns to ed human capital theory, m may have the higher ave income, because the higher education the higher the pro workers will generates hig We will come again to t section econometric approac
Labour Productivity and Wa Strengthening eviden effect of education productivity in manufactu can be investigated from the services expenditure in term productivity changes. Reas increase of productivity followed by the increase expenditure, in other word pays workers based on th performance. Graph 2 depi of percentage productivity from 2006-2008. Percentag
0
ct Productivity Under Minimum Wage Setting?
aph 1. Distribution of Worker’s Education Leve
from Labour Individual Survey and Economic Cens
06
meaning, as t argument, in education and manufacturing verage labour er the level of productivity of higher income. this issue in oach .
Wages
dence of the on labour cturing sector the firm labour erms of labour easonably, the ty should be ase of wages ords, employer their working picts the trend ity and wages tage change of
productivity is increasi 2007 with the increase 2006 and 77 percent in 2006 decrease at 26 p wages increase 28 perce 39 percent in 2007. A productivity changes at 2 In perfect comp wages are fully determi productivity but graph 2 thing. That is th productivity is always f changes in wages paid b the increase of produ responded by the incr proportionately. Some r suspected, regardless structure, the measur productivity used in tabl contribution of other f capital, raw materials because the value of derived from value divided by the number workers.
Ssec and Diploma
Jsec Elem <Elem
Total Labour Manufacturing
80
vel
nsus of
asing from 2006-se 54 percent in in 2007, and in percent , while rcent in 2006 and And follow the t 27 percent.
petitive market, mined by worker 2 tell us different the change of s followed by the d by the firm and ductivity is not crease of wages e reasons may be ss the market sure of labour able 2 ignores the r factors such as als, and energy f productivity is of production ber of production
Rifai Afin, Do Wages Reflect Pr
Graph 2. Percen
Source: Calc
This method cannot estimat workers and other factors o accurately and independ second reason, technically, has some positions of for th not only production but production department marketing, finance, human that contribute to the production but it is diff included in productivity process. The third reason wages policy. Pricing pol minimum wages distor mechanism in th e labour ma parties in the labour mar labour, and government, hav expectation to the price Government intervention in markets by setting minim affects labour markets thro and supply side. In the n estimation on productivity a done by applying econome Even though there is dif changes but the pattern is th
Minimum Wages Policy Indonesia governm minimum wages in the
0
ct Productivity Under Minimum Wage Setting?
entages of Change in Wages Expenditure and P
alculated from Manufacturing Economic Census, 20
ate the role of s of production ndently. The lly, each firm,
their workers, but also non
t such as
an resources, he value of ifficult to be ity measuring n is minimum olicy such as torts market markets. Three arkets, firms, have their own ce of labour. in the labour nimum wages
ment set the e local level,
district and municipal, w on proper living need labour and transmigrat minister rule no 17/ Me technical explanation o needs of workers that m in the labour services amount of payment is c the annual field surv conducted by the team b government involving labour union, aca government. Formal government announce m based on the lowest wag municipal in that p accomplishing price su local area of districts.
Local government wages each year and i increasing reflecting commodity movement. effect of minimum wage Smeru (2001), shows t labour markets especi demand side. This study the increase of 10 perce wages decreases the absorption in labour percent. Since decentr
2006 2007 2008
Productivity Wages
81
d Productivity
2006 -2008
which are based eds. Ministry of ration issues the Men/8/2005 about of proper living must be included es payment. The s calculated from urvey which is built by the local ing employers, cademics, and ally, provincial minimum wages ages in distric and province after survey in each
nt set the nominal it is common ly the price of nt. Study of the ages in Indonesia, s that this affects ecially from the dy concludes that rcent of minimum e labour force r markets by 1 ntralisation fiscal
Rifai Afin, Do Wages Reflect Pr
policy in 2001, local gove the minimum wages more higher. Something that neglected is political reason
Graph 3. Minim
Source: Calculated 2009
Graph 4. M
Source: Calculated and Transmigration
0 200000 400000 600000 800000 1000000 1200000 1400000
20
0 200000 400000 600000 800000 1000000 1200000 1400000 1600000
Manufacturin
ct Productivity Under Minimum Wage Setting?
vernment sets ore often and t cannot be son behind this
policy. Graph 3 shows wages increase gradual 2009.
imum Montly Wages Average of Provincial Le
d from Data of Ministry of Labour and Transmig
Montly Minimum and Manufacturing Wages
d from Manufacturing Economic Census and Mi n
2006 2007 2008 2009
Average Lowest highest
2006 2007 2008
turing Minimum Wages Average Total Labour
82
ws that minimum ually from
2006-Level
igration and BPS,
Rifai Afin,Do Wages Reflect Productivity Under Minimum Wage Setting? 83
Table 4 depicts the trend of minimum wages and manufacturing sector. Clearly pictured that wages in manufacturing sector is higher, on average, than the wages which are set by government and total labour. In the previous part, told us that labour education level in manufacturing sector is higher than total labour, which probably factor that generates higher labour income in manufacturing or temporarily we may conclude that productivity of labour in manufacturing sector is higher than total labour.
Econometric Results Estimation Results
This is the second part of empirical facts that contains the estimation results of econometric models followed by some tests of the models. Those tests are hetero-skedasticity, multicollinearity, model specification, and normality which are the critical tests for cross section data. The first part is estimation results of production function which is shown in the table A1 and A2 in appendix.
In the output function, there are four models to be alternatives which have the same dependent variable but different predictors. The predictors are estimated separately among the models based on the gender comparison per level of education and factors of productions besides labour such as capital and energy used. Moretti (2004) estimates the effect of education on productivity at firm level using both direct estimation on Cobb-Douglas and
translog but ignoring the education level and gender by aggregating skilled and unskilled labour. The method proposed by Moretti, translog estimation, may work properly in the small scale model which means the model contains relatively small number of dependent variables. Translog approach derives main variables into additional standard variables in the translog model such as squared and multiplication between main variables. In this paper, I use direct estimation instead of transformation logarithm, translog. Ordinary Least Squares (OLS) is applied to all models to get unbiased and consistent parameters.
Rifai Afin,Do Wages Reflect Productivity Under Minimum Wage Setting? 84
Table.4. Summary of Classical Assumption Tests
Output Models
Tests Homoskedasticity
(Probability Chi Square) Model Specification(Probability F) Normality(Probability Z)
Multicolinearity (Min and Max VIF)
1 0.057 0.055 0.465 1.1 and 2.1
2 0.039 0.025 0.502 1.2 and 1.8
3 0.051 0.063 0.512 1.1 and 2.3
4 0.035 0.033 0.572 1.3 and 2.2
Wages Model
1 0.051 0.062 0.445 1.1 and 2
2 0.032 0.049 0.521 1.3 and 1.9
3 0.054 0.067 0.601 1.01 and 1.8
4 0.044 0.05 0.566 1.4 and 2
Note: the level of significant of tests is 5 percent and VIF is under 10
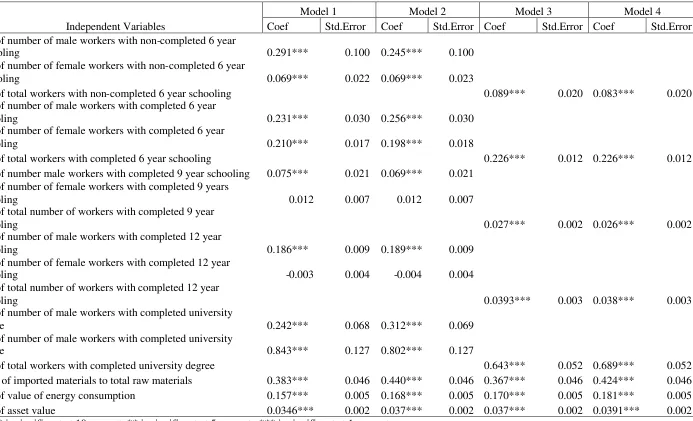
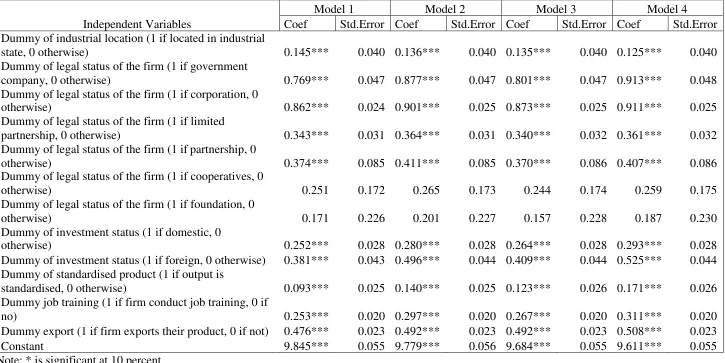
In the other side, wages functions (see table A3 and A4) perform as we expected as well. The estimation strategy applied in the wages function is providing four models with two kinds of dependent variables those are wages and wages plus and two different groups gender separation like what output function does in output model estimation. Separating wages and wages plus function is aimed to know whether additional bonus and payment besides wage is also attached to the performance in production process. In order to obtain the coefficient of parameters, I apply the same technique as estimating output function, OLS. All wages functions show that there is significant and positive effect of labour per level of education. The assumption tests for OLS are also run and the tests result in no deviation from hypothesis which means estimated parameters are unbiased and consistent which are presented in table 4.
Results Interpretation
The estimation results for production function have some findings.
Rifai Afin,Do Wages Reflect Productivity Under Minimum Wage Setting? 85
percent, 13.5 percent workers with six years schooling, 32.8 percent workers with 9 years schooling, 49 percent workers with 12 years schooling, and 2.5 percent with college and university degree. This composition, at least, emphasize our results that is why workers with 9 years and 12 years schooling might have diminishing marginal productivity. Jones (1994) found the same results when estimated both production and wages function which resulted in inconsistency when the results show that workers with lower level of education are not always have higher productivity. Moreover, Jones argues that in that case, education has indirect effect on labour productivity. According to two first findings, it is difficult to say that production function clearly point out how human capital theory works. Pudasaini (1983) confirmed that, in his results, there was the decline contribution to output by the higher educated workers even though on average the role of education on output is positively significant.
Other variables characterizing the manufacturing sector output are international aspects those are export, import, and foreign investment. Imported raw materials have positive effect on output which means that the higher imported raw materials the higher the output. Even though not many respondents or about 20 percent of respondents import their raw materials, it does matter. In other words, imported raw materials have relatively high productivity in production process. In the other side, export has also positively significant impact on output supporting study done by Sjoholm (1997) that had proved the positive effect of import and export from Indonesian manufacturing data even though there is no clear consensus among theoretical and empirical studies
on particular topics across the world. The third international aspect is foreign investment status that does not surprisingly have positive and significant effect on output. In the other side, domestic status of firm has also diminishing in our sample. Foreign companies, which commonly use more advanced technology, still have more capability of doing more.
Other variables that are important role for manufacturing output are location and standardised product. Location, as we expected, positively significant which means industrial state increases manufacturing output. Some studies that support this results are Lall, Shalizi, and Deichmann (2001), and Fan and Scott (2003) that have found empirically that agglomeration has positive effect on industry performance and also Fu and Ross (2010) who prove that industrial agglomeration has positive effect on wages.
Administrative factors which are legal forms and standardisation of product have also important role on output and wages. Legal status of the firm such as Government Company, corporation, cooperatives, limited partnership, etc has positive effect on both output and wages and it shows that the parameter of corporation status is the highest among other legal status. This is not surprising finding. In the other side, standardisation significantly affects output. Intuitively, this is easy to understand that highly standardized products are usually produced by high performing firms so that product standardization is a good way to boost manufacturing productivity.
Rifai Afin,Do Wages Reflect Productivity Under Minimum Wage Setting? 86
the parameters in the output functions which wages follows the marginal
productivity, when marginal
productivity of labour at a level of education decreases the wages decrease as well. Regardless job contract that is signed before knowing true productivity of workers, the expected of employers to workers performance is correct. In the other side, trained workers are paid more than that non-trained. Most firms in Indonesia apply some condition to their workers for some months before they get an extended contract and get more payment. One of the conditions is training both on the job and off the job training. For workers who have passed the training they get some beneficial including higher salary, bonus, and insurance. Employers, basically, will not know the true marginal productivity of workers but the signal in the labour markets which is easily recognised that most workers, as previously mentioned, who search jobs in the labour markets have junior and senior high school certificate so that employers decided to
accept such typical workers that make, in the production function, capital and other production factors optimally used for that education level are decreasing. From the graph 4.5, which is based on model 3 estimation results, it is clearly illustrated that the changes of the number of low education level than the changes in their productivity compared to high skilled labour with university degree and the effect of number of workers with junior and senior high school certificate on output is relatively lower than others and it is followed by the effect on wages. It exists because of the diminishing marginal productivity. This argument is supported by the fact those level of education are the biggest composition in manufacturing sector, but it does not mean that the nominal value of received wages for 9 and 12 year school is lower than 6 and <6 year schooling because it represents percentage of changes (variables estimated in logarithm). The pattern of those parameters from two functions is depicted in the Graph.5 below:
Graph 5. The Pattern of Effect of Education on Marginal Productivity and Wages
0.000 0.200 0.400 0.600 0.800 1.000
<6 years 6 years 9 years 12 years university
degree
Rifai Afin,Do Wages Reflect Productivity Under Minimum Wage Setting? 87
Secondly, capital and energy have positive effect on wages which means capital and energy are complementary factors of workers. Capital and energy are complementary factors in our sample, machinery use energy in the production process and if the capital and energy combination substitutes workers so the more intensive the combination used the less workers will be hired and the expenditure for wages decreases as consequences of using machinery and energy intensively. Generally, we may conclude that workers are needed to operate machinery and for some cases some job positions related to machine operation cannot be replaced by other machines such as installation and maintenance.
International factors play important role in determining industrial wages. Import, exports, and foreign investment have positively significant effect on wages. In empirical literatures, there is no consensus on what effect of import and export on wages. One supporting finding is from Martins and Opromolla (2009) using firm level data proved that export and import have positive impact on workers salary. In the contrary, Alvarez and Opazo (2008) used firm level data and found that imported goods have negative effect on domestic firm wages. The other international aspect is status of investment, which is foreign ownership, does positively affect on wages. It is generally known that foreign management system is better than that of domestic so that it is not surprising results that foreign pays more than domestic firms. This result is shown in table A3 conclude that foreign ownership firms pays more than domestic firms.
Other variables that are expected to have positive effect on wages are location, standardisation, and Legal
status. Table A.4 summarised that those three variables are positive different from zero. Firms located on industrial state pay higher than that of outside industrial state. Indonesia government built some industrial states in some cities such as Surabaya, Pasuruan, Tangerang, and Bekasi which are in most crowded island, Java, and spreading them out to other island such as Batam in Sumatra Island, and Timika in Irian Jaya and some other are still in progress. Most of firms located in industrial states are big companies and well publicly known as companies that have high standard products. To sum up, graph A1 depicts the impact of control variables on output and wages based on model 3 estimation. The graph shows us that most of the effects of those variables on wages follow the trend of their marginal productivity.
Effect of Minimum Wage Setting on Manufacturing Wages
When the effect of education and other control variables on output and wages has the same pattern, so where the minimum wages does lie?. Section 4.1.3 provides qualitative explanation of minimum wage and manufacturing labour earnings, this part apply econometric model instead. Table 4.3 shows us the effect of minimum wage on manufacturing wage changes. By focusing on fixed and random effect models, the results show that minimum wages and lag of wages are different from zero at 10 percent level. Considered by the sensitive results of fixed and random effect model, specification test, Hausman test, need to be applied. According to Hsiao (2003), the issue of specification test is not whether or not individual effect fixed or random, but more important thing is individual effect can be considered as a
Rifai Afin,Do Wages Reflect Productivity Under Minimum Wage Setting? 88
population or the conditional distribution of individual effect and attributes can be viewed as identical across panels and suggested Hausman test as an alternative method to identify satisfying model. Hausman test result suggests that fixed model is more appropriate in this case at 10 percent level. To confirm the result of Hausman test, we test whether the variance among panels is zero, in order to perform the test, Breusch and Pagan Lagrangian multiplier test has been applied.
Due to fixed effect model is more appropriate for this case, further tests for fixed model result must be applied. Baum (2001) argued that fixed effect model estimated in stata command requires OLS point estimator and its interval perform under classical assumption which probably the error disturbance is independently and identically distributed and in the case panel data these assumptions could be rejected in some ways. Two tests for fixed effect, Breusch and Pagan for independence and modified Wald test for groupwise heteroskedasticity, are suggested to check the assumptions.
Breusch-Pagan test for
contemporaneous correlation are explored by Zellner’s seemingly unrelated regression (SUR) estimator. Command ‘’xttest2’’ in Stata tests the hypothesis that the residual correlation matrix, calculated over data common to all cross-sectional units, is an identity matrix of order Nc, where Nc is the number of cross-sectional units or entities (Baum, 2001). The Lagrange multiplier test statistic is:
r is the i jthresidual correlation
coefficient. The Breusch and Pagan (1980) test statistic is distributed 2, where d = Nc(Nc− 1)/2, under the null hypothesis of cross-sectional independence. The other test, heteroskedasticity, is run by command xttest3 following the null hypothesis specifying that 2
i
for i=1..Nc where Nc is the number of cross sectional data.
Let
be the estimator of
the ith cross-sectional unit’s error
variance, based upon the Ti residuals eit
available for that unit. Then define:
^2 2as the estimated variance of 2 ^
. The modified Wald test statistic, defined as
will be distributed 2[Nc] under the null hypothesis. Calculation shows us the results of Breusch-Pagan tests that result in high probability chi square, 0.43 and 0.63 for Breusch-Pagan Lagrange Multiplier and modified Wald test meaning that the two tests strongly
concluded that there no
Rifai Afin,Do Wages Reflect Productivity Under Minimum Wage Setting? 89
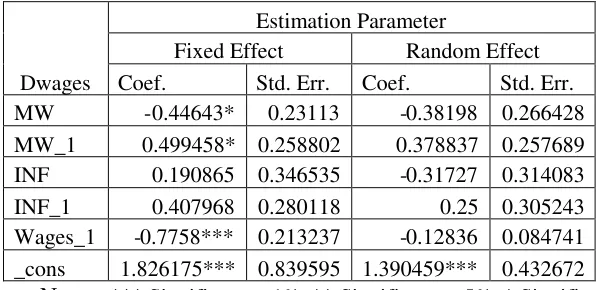
Table 5, The Effect of Minimum Wages on Low Income Manufacturing Workers
Dwages
Estimation Parameter
Fixed Effect Random Effect Coef. Std. Err. Coef. Std. Err. MW -0.44643* 0.23113 -0.38198 0.266428 MW_1 0.499458* 0.258802 0.378837 0.257689 INF 0.190865 0.346535 -0.31727 0.314083 INF_1 0.407968 0.280118 0.25 0.305243 Wages_1 -0.7758*** 0.213237 -0.12836 0.084741 _cons 1.826175*** 0.839595 1.390459*** 0.432672
Notes: *** Significant at 1%, ** Significant at 5%, * Significant at 10%
After performing standard tests for panel estimation and fulfilling the assumptions, parameters of the fixed model can be confidently interpreted. Table 4.2 shows that minimum wages current period negatively affect the wages changes in manufacturing sector at 10 percent level, in the other side, lag 1 minimum wage setting has positively different from zero at 10 percent level. This can be understood intuitively because minimum wages are announced by local government at the end of the year for the guide of employer’s payment for worker services to the next year to come. Due to the dependent variable in the first different form, we cannot identify whether nominal effect of independent variables and only identify the effect to the changes of wages. Even though the effect is negative on changes but it could have been positive on nominal.
The other significant variable that is observed to be positive is lag one of wages. It is about 0.78 percent of changes in manufacturing wages is determined by previous wages. Generally, firms in Indonesia increase the wages of their workers every year following the minimum wages that are always increase every year and employer put their wages payment than minimum wages set by the government
so that it strongly indicates that wages have positive effect on nominal wages even though it has negative on changes of wages.
SUMMARY AND CONCLUSION This report has analysed mainly the effect of education level and some additional variables on output to measure marginal productivity of labour and wages in Indonesia manufacturing sector in 2006 which is under minimum wage setting using firm level survey for more than 25.000 firms as respondents. By estimating production, wages, and
effect of minimum wage on
manufacturing sector to answer the main question whether wages reflect marginal productivity in minimum wage setting and does the minimum wage have role on manufacturing wages. There are some findings that can be summarised in this study.
Rifai Afin,Do Wages Reflect Productivity Under Minimum Wage Setting? 90
Secondly, Employers pay their workers based on their marginal productivity and minimum wage policy of local government. This fact is supported by the pattern of marginal productivity of labour is similar to the pattern of marginal effects of labour on wages function and from the model of minimum wage, moreover the effect of minimum wage on manufacturing earnings changes is statistically significant. We may conclude that the employers determine workers wages by depending on the local government policy on minimum wage and combine it with supervising their workers performance. We can easily understand that minimum wage policy will increase income of low income workers, but for the high income workers, minimum wage, presumably, does not have big effect on income, this study only identify the effect of minimum wage on low income labour. In the policy context, firms could invest more capital which is suitable with majority of their workers education level, in this case is 9 and 12 year schooling, so that it will increase their productivity through upgrading capital labour ratio. Government could invest in human capital by upgrading and updating curricula for high school that are more relevant to worker jobs and contain more advanced technology.
Third, international aspects of industrial characteristics in Indonesia have positive marginal productivity and positively significant affect wages. Import, export, and foreign investment variables as international aspect indicators drive us to the conclusion that openness has prospered manufacturing sector in Indonesia. Intuitively, imported raw materials which are productive increase industrial output, and exporting manufacturing products generates industrial income or profit
that trigger productivity and wages, and foreign investment spreads out knowledge and technology.
Fourth, location of firms on industrial state assists to create agglomeration. Closeness benefits individual and firms in terms of reducing cost of transaction and positive externalities. In the context of labour markets transaction, special concentration or agglomeration for job searching and matching make it easy to process which is based on accurate information. Agglomeration, clustering
producers, may enhance the
productivity of firms through beneficial business alliances that can help increasing local competitiveness. Those arguments bring us to the conclusion that localised firms can make firms reach higher productivity and, for labour, it gives workers more opportunities to have higher wages.
Fifth, legal and administrative aspect (standardisation product) has also important role on industrial output and wages. The legal form of firms such as government company, corporation, limited partnership, cooperatives, and etc has positive effect on output and wages. Among other legal status, corporation has the biggest effect on output and wages and this is not surprising finding. In the other side, standardisation increase output and wages. This could be understood that standardisation of product urge firms to increase their productivity and as its consequence, they pay workers more.
Rifai Afin,Do Wages Reflect Productivity Under Minimum Wage Setting? 91
legal status, standard of product has co-movement. This can be concluded that firms adjust their wages expenditure for their workers to, besides labour productivity, such factors.
REFERENCES
Addison, John T.(1979), and W Stanley Sieberd.’’ The Market for Labor : An Analytical Treatment.’’ Santa Monika: Goodyear
Altonji, Joseph G.(1993).’’ The Demand for and Return to Education When Education Outcomes are Uncertain.’’
Journal of Labor Economics, Vol.
11, No. 1, Part 1: Essays in Honor of Jacob Mincer , pp. 48-83, January 1993
Álvarez, Roberto., and Luis
Opazo.(2008). ‘’Chinese Penetration and Importer Country Wages: Microevidence From Chile.’’ Central Bank of Chile Working Papers No 473, June
2008
Angrist, Joshua D., and Whitney K
Newey.(1991)’’
Over-Identification Tests in Earnings Functions with Fixed Effects.’’
Journal of Business & Economic Statistics, Vol. 9, No. 3 (Jul.,
1991), pp. 317-323
Ashenfelter, Orley., and David J. Zimmerman.(1997).’’ Estimates of the Returns to Schooling from Sibling Data: Fathers, Sons, and Brothers.’’ The Review of Economics and Statistics, Vol. 79,
No. 1 (Feb., 1997), pp. 1-9
Barro, Robert J.’’ Human Capital and Growth.(2001). ’’ The American
Economic Review, Vol. 91, No. 2,
Papers and Proceedings of the Hundred Thirteenth Annual Meeting of the American Economic Association (May, 2001), pp.12-17
Baum, Christopher F. (2001), ‘’Residual Diagnostics for Cross-section Time Series Regression Models.’’
The Stata Journal 1, Number 1,
pp. 101–104
Bazen, Stephen., and John P
Martin.(1991). ‘’ The Impact of The Minimum Wage on Earnings and Employment in France.’’ OECD Economic Studies No. 16, Spring 1991
Becker, Gary S.(1962)’’ Investment in Human Capital: A Theoretical Analysis.’’ Journal of Political Economy, Vol. 70, No. 5, Part 2:
Investment in Human Beings (Oct., 1962), pp. 9-49
______________(1975)’’ Human capital : A theoretical and empirical analysis, with special reference to education.’’ New York : National Bureau of Economic Research (NBER); distributed by Columbia University press, 1975
Benhabib, Jess., and Mark
Spiegel.(1994)’’ The Role of Human Capital in Economic Development Evidence From Aggregate Cross-Country Data.’’
Journal of Monetary Economics, Volume 34, Issue 2, October 1994, Pages 143–173
Cross-Rifai Afin,Do Wages Reflect Productivity Under Minimum Wage Setting? 92
Section Evidence.’’ Journal of Political Economy, Vol. 76, No. 3
(May - Jun., 1968), pp. 494-497
Blackburn, McKinley., and David Neumark.(1995).’’ Are OLS Estimates of the Return to Schooling Biased Downward? Another Look.’’ The Review of Economics and Statistics, Vol. 77,
No. 2 (May, 1995), pp. 217-230
Bonjour, Dorothe., and Lynn F. Cherkas, Jonathan E. Haskel, Denise D. Hawkes, Tim D. Spector.(2003).’’ Returns to Education: Evidence from U.K. Twins.’’ The American Economic Review, Vol. 93, No. 5 (Dec.,
2003), pp. 1799-1812
Bryan, Mark., and Andrea Salvatori, and Mark taylor.(2012). ‘’ The Impact of Minimum Wage on earnings, Employment, and Hours Through The Recession.’’ A Report to Low Pay Commission, Institute for Social and Economic Research (ISER), University of Essex, February 2012
Cahuc, Pierre., and André
Zylberberg.(2004).’’Labor
Economics.’’ Cambridge, Mass. : MIT Press, 2004
Chevalier, Arnaud., and Colm Harmon, Ian Walker, Yu Zhu.(2004)’’Does Education Raise Productivity, or Just Reflect It?.’’ The Economic Journal, Vol. 114, No. 499,
Features (Nov., 2004), pp. F499-F517
Ciccone, Antonio.,and Elias
Papaioannou.’’Human Capital, the Structure of Production, and Growth.’’ Economics Working Papers 902, Department of Economics and Business,
Universitat Pompeu
Fabra.(accessed from<
http://www.econ.upf.edu/docs/pap ers/downloads/902.pdf on 03 August 2012)
Correa, H.(1963).’’ The Economics of Human Resources.’’ Amsterdam: North-Holland
Daniel Cohen & Marcelo Soto.(2007) "Growth and Human Capital: Good data, Good results,"Journal
of Economic Growth, Springer,
vol. 12(1), pages 51-76, March, 2007
Delsen, Lei., and Mark
Schonewille.(1999).’’Human Capital and Productivity: Integration of Institutions and Endogenous Growth.’’ Paper for
the EALE conference in
Regensburg 23-26 September,
1999: URL<
http://129.3.20.41/eps/hew/papers/ 9908/9908001.pdf (accessed on 3 August 2012)
Fan, C. Cindy., and Allen J Scott.(2003). ‘’ Industrial Agglomeration and Development: A Survey of Spatial Economic Issues in East Asia and a Statistical Analysis of Chinese Regions.’’, Economic Geography
79(3): 295–319, 2003.
Fu, Shihe., and Stephen L. Ross.(2010). ‘’ Wage Premia in Employement Clusters: Agglomeration or Workers Heterogeneity?.’’Center for Economic Studies (CES) Working Paper no CES-10-04, February 2010
Griliches, Zvi.(1963).’’ Estimates of the
Rifai Afin,Do Wages Reflect Productivity Under Minimum Wage Setting? 93
Production Function from Cross-Sectional Data.’’ Journal of Farm Economics, Vol. 45, No. 2, pp.
419-428, May, 1963
___________.(1968).’’ Production Functions in Manufacturing: Some Additional Results.’’
Southern Economic Journal, Vol.
35, No. 2 (Oct., 1968), pp. 151-156
Harmon, Colm., and Ian
Walker.(2005).’’ Estimates of the Economic Return to Schooling for the United Kingdom.’’ The American Economic Review, Vol.
85, No. 5, pp. 1278-1286, December 2005
Hewitt, Peter., and Philippe Aghion.(1998). ’’Capital Accumulation and Innovation as Complementary Factors in Long-Run Growth.’’ Journal of Economic Growth, 1998, Volume 3, Number 2, Pages 111-130
Hsiao, Cheng.(2003). ‘’ Analysis of Panel Data.’’Second Edition, Cambridge University Press
Islam, Nazrul.(1995)’’Growth Empirics: A Panel Data Approach.’’The Quarterly Journal of Economics,
Vol. 110, No. 4 (Nov., 1995), pp. 1127-1170
Jones, Patricia.(1994). ’’Are Manufacturing Workers Really Worth Their Pay.’’ WPS/94-12, Centre for the Study of African Economies, Department of Economics, University of Oxford, March 1994
Jorgenson, D. W. and Z.
Griliches.(1967).’’The
Explanation of Productivity
Change.’’The Review of Economic Studies, Vol. 34, No. 3 (Jul.,
1967), pp. 249-283
Khaldi, Nabil.’’ Education and Allocative Efficiency in U.S. Agriculture.(1975)’’ American Journal of Agricultural Economics, Vol. 57, No. 4 (Nov.,
1975), pp. 650-657
Kling, Jeffrey R.(2001).’’ Interpreting Instrumental Variables Estimates of the Returns to Schooling.’’ Journal of Business & Economic Statistics, Vol. 19, No. 3 (Jul.,
2001), pp. 358-364
Lall, Somik, Shalizi, Zmarak, and Uwe Deichmann.(2001).
‘’Agglomeration Economies and Productivity in Indian Industry.’’ World Bank Working Policy Research Working Paper No
2663, The World Bank,
Development Research Group, Infrastructure and Environment, August 2001
Lester, Richard
A.(1946).’’Shortcomings of Marginal Analysis for Wage-Employment Problems.’’ The American Economic Review, Vol.
36, No. 1 (Mar., 1946), pp. 63-82
Lewis, W. A.(1954). '’Economic Development with Unlimited Supplies of Labour'’, The Manchester School, vol. 22, no. 2,
pp. 139-191, 1954
Lockheed, Marlaine E., and T. Jamison, Lawrence J. Lau.(1980).’’ Farmer Education and Farm Efficiency: A Survey.’’ Economic Development and Cultural Change, Vol. 29,
Rifai Afin,Do Wages Reflect Productivity Under Minimum Wage Setting? 94
Lucas, Robert B.(1988).’’On the
Mechanics of Economic
Development.’’ Journal of Monetary Economics No 22
(1988) 3-42. North-Holland
Maloney, William., and Jairo Mendez. ’’Measuring The Impact of Minimum Wages: Evidence From Latin America.’’ Chapter on the Book, ‘’ Law and Employment: Lesson From Latin America and Caribbean, edited by James J. Heckman and Carmen, University Chicago Press (Accessed from
http://www.nber.org/chapters/c10 068 on 03 August 2012)
Martins, Pedro S., and Luca David Opromolla.(2009).‘’Exports, Imports and Wages: Evidence from Matched Firm-Worker-Product Panels.’’ IZA Discussion Paper No 4646, December 2009
Meyer, Robert H., and David A. Wise.(1983)‘’The Effects of the
Minimum Wage on the
Employment and Earnings of Youth.’’ Journal of Labor Economics, Vol. 1, No. 1 (Jan.,
1983), pp. 66-100
Nelson, Richard R. and Edmund S. Phelps.(1966).’’Investment in Humans, Technological Diffusion, and Economic Growth.’’ The American Economic Review, Vol.
56, No. 1/2 (Mar. 1, 1966), pp. 69-75
Neumark, David., and Mark Schweitzer, William Wascher.(2000). ‘’The Effect of Minimum Wages
Throughout Wage
Distribution.’’NBER Working
Paper Series No 7519, February 2000
Oi, Walter Y.(1962).’’Labor as a Quasi-Fixed Factor.(1962).’’ Journal of Political Economy, Vol. 70, No. 6,
pp. 538-555, Dec., 1962
Pudasaini, Som P.(1983).’’ The Effects of Education in Agriculture: Evidence from Nepal.’’ American Journal of Agricultural Economics, Vol. 65, No. 3 (Aug.,
1983), pp. 509-515
Schultz, Theodore W.(1961)’’ Investment in Human Capital.’’
The American Economic Review,
Vol. 51, No. 1 (Mar., 1961), pp. 1-17
Sjöholm, Fredrik.(1997). ‘’Exports, Imports, and Productivity: Results From Indonesian Establishment Data.’’The European Institute of Japanese Studies, Working Paper No. 33, August 1997
Smeru.(2001). ‘’ Dampak Kebijakan Upah Minimum Terhadap Tingkat Upah dan Penyerapan Tenaga Kerja di Daerah Perkotaan Indonesia.’’ Smeru Research Report funded by USAID and PEG.
Spence, Michael.(1981). ‘’Signaling, Screening, Information.’’ Chapter on the book, ‘’Studies in Labor Markets’’, edited by Sherwin Rosen, University Chicago
Press,(Accessed from
http://www.nber.org/chapters/c89 15.pdf on 03 August 2012), 1981
Rifai Afin,Do Wages Reflect Productivity Under Minimum Wage Setting? 95 Economic Literature, Vol. 37, No.
1. (Mar., 1999), pp. 112-156
Vailancourt, Francois.(1995).’’ The Private and Total Returns to Education in Canada, 1985.’’The Canadian Journal of Economics / Revue canadienne d'Economique,
Vol. 28, No. 3 (Aug., 1995), pp. 532-554
Rifai Afin,Do Wages Reflect Productivity Under Minimum Wage Setting? 96
APPENDIX
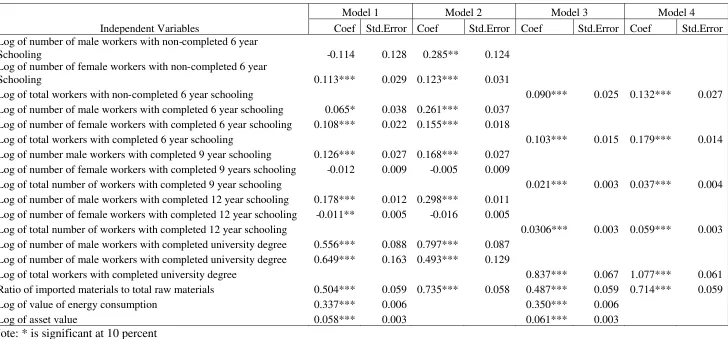
Table A1: Summary of Output Function Regression Results of Main Variables
Independent Variables
Model 1 Model 2 Model 3 Model 4
Coef Std.Error Coef Std.Error Coef Std.Error Coef Std.Error Log of number of male workers with non-completed 6 year
Schooling -0.114 0.128 0.285** 0.124
Log of number of female workers with non-completed 6 year
Schooling 0.113*** 0.029 0.123*** 0.031
Log of total workers with non-completed 6 year schooling 0.090*** 0.025 0.132*** 0.027
Log of number of male workers with completed 6 year schooling 0.065* 0.038 0.261*** 0.037 Log of number of female workers with completed 6 year schooling 0.108*** 0.022 0.155*** 0.018
Log of total workers with completed 6 year schooling 0.103*** 0.015 0.179*** 0.014
Log of number male workers with completed 9 year schooling 0.126*** 0.027 0.168*** 0.027 Log of number of female workers with completed 9 years schooling -0.012 0.009 -0.005 0.009
Log of total number of workers with completed 9 year schooling 0.021*** 0.003 0.037*** 0.004 Log of number of male workers with completed 12 year schooling 0.178*** 0.012 0.298*** 0.011
Log of number of female workers with completed 12 year schooling -0.011** 0.005 -0.016 0.005
Log of total number of workers with completed 12 year schooling 0.0306*** 0.003 0.059*** 0.003 Log of number of male workers with completed university degree 0.556*** 0.088 0.797*** 0.087
Log of number of male workers with completed university degree 0.649*** 0.163 0.493*** 0.129
Log of total workers with completed university degree 0.837*** 0.067 1.077*** 0.061
Ratio of imported materials to total raw materials 0.504*** 0.059 0.735*** 0.058 0.487*** 0.059 0.714*** 0.059
Log of value of energy consumption 0.337*** 0.006 0.350*** 0.006
Log of asset value 0.058*** 0.003 0.061*** 0.003
Rifai Afin,Do Wages Reflect Productivity Under Minimum Wage Setting? 97
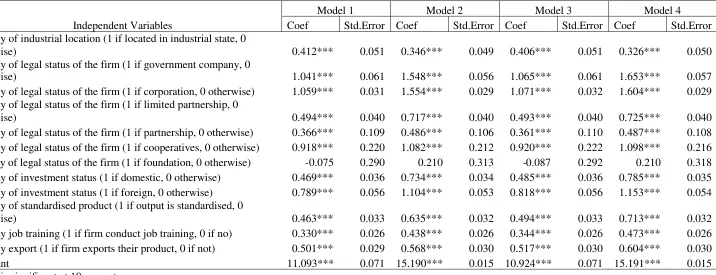
Table A2: Summary of Output Function Regression Results of Control Variables
Independent Variables
Model 1 Model 2 Model 3 Model 4
Coef Std.Error Coef Std.Error Coef Std.Error Coef Std.Error Dummy of industrial location (1 if located in industrial state, 0
otherwise) 0.412*** 0.051 0.346*** 0.049 0.406*** 0.051 0.326*** 0.050
Dummy of legal status of the firm (1 if government company, 0
otherwise) 1.041*** 0.061 1.548*** 0.056 1.065*** 0.061 1.653*** 0.057
Dummy of legal status of the firm (1 if corporation, 0 otherwise) 1.059*** 0.031 1.554*** 0.029 1.071*** 0.032 1.604*** 0.029 Dummy of legal status of the firm (1 if limited partnership, 0
otherwise) 0.494*** 0.040 0.717*** 0.040 0.493*** 0.040 0.725*** 0.040
Dummy of legal status of the firm (1 if partnership, 0 otherwise) 0.366*** 0.109 0.486*** 0.106 0.361*** 0.110 0.487*** 0.108 Dummy of legal status of the firm (1 if cooperatives, 0 otherwise) 0.918*** 0.220 1.082*** 0.212 0.920*** 0.222 1.098*** 0.216 Dummy of legal status of the firm (1 if foundation, 0 otherwise) -0.075 0.290 0.210 0.313 -0.087 0.292 0.210 0.318 Dummy of investment status (1 if domestic, 0 otherwise) 0.469*** 0.036 0.734*** 0.034 0.485*** 0.036 0.785*** 0.035 Dummy of investment status (1 if foreign, 0 otherwise) 0.789*** 0.056 1.104*** 0.053 0.818*** 0.056 1.153*** 0.054 Dummy of standardised product (1 if output is standardised, 0
otherwise) 0.463*** 0.033 0.635*** 0.032 0.494*** 0.033 0.713*** 0.032
Dummy job training (1 if firm conduct job training, 0 if no) 0.330*** 0.026 0.438*** 0.026 0.344*** 0.026 0.473*** 0.026 Dummy export (1 if firm exports their product, 0 if not) 0.501*** 0.029 0.568*** 0.030 0.517*** 0.030 0.604*** 0.030
Constant 11.093*** 0.071 15.190*** 0.015 10.924*** 0.071 15.191*** 0.015
Rifai Afin,Do Wages Reflect Productivity Under Minimum Wage Setting? 98 Independent Variables
Model 1 Model 2 Model 3 Model 4
Coef Std.Error Coef Std.Error Coef Std.Error Coef Std.Error Log of number of male workers with non-completed 6 year
Schooling 0.291*** 0.100 0.245*** 0.100
Log of number of female workers with non-completed 6 year
Schooling 0.069*** 0.022 0.069*** 0.023
Log of total workers with non-completed 6 year schooling 0.089*** 0.020 0.083*** 0.020
Log of number of male workers with completed 6 year
schooling 0.231*** 0.030 0.256*** 0.030
Log of number of female workers with completed 6 year
schooling 0.210*** 0.017 0.198*** 0.018
Log of total workers with completed 6 year schooling 0.226*** 0.012 0.226*** 0.012
Log of number male workers with completed 9 year schooling 0.075*** 0.021 0.069*** 0.021 Log of number of female workers with completed 9 years
schooling 0.012 0.007 0.012 0.007
Log of total number of workers with completed 9 year
schooling 0.027*** 0.002 0.026*** 0.002
Log of number of male workers with completed 12 year
schooling 0.186*** 0.009 0.189*** 0.009
Log of number of female workers with completed 12 year
schooling -0.003 0.004 -0.004 0.004
Log of total number of workers with completed 12 year
schooling 0.0393*** 0.003 0.038*** 0.003
Log of number of male workers with completed university
degree 0.242*** 0.068 0.312*** 0.069
Log of number of male workers with completed university
degree 0.843*** 0.127 0.802*** 0.127
Log of total workers with completed university degree 0.643*** 0.052 0.689*** 0.052
Ratio of imported materials to total raw materials 0.383*** 0.046 0.440*** 0.046 0.367*** 0.046 0.424*** 0.046 Log of value of energy consumption 0.157*** 0.005 0.168*** 0.005 0.170*** 0.005 0.181*** 0.005
Log of asset value 0.0346*** 0.002 0.037*** 0.002 0.037*** 0.002 0.0391*** 0.002
Rifai Afin,Do Wages Reflect Productivity Under Minimum Wage Setting? 99
Independent Variables
Model 1 Model 2 Model 3 Model 4
Coef Std.Error Coef Std.Error Coef Std.Error Coef Std.Error
Dummy of industrial location (1 if located in industrial
state, 0 otherwise) 0.145*** 0.040 0.136*** 0.040 0.135*** 0.040 0.125*** 0.040
Dummy of legal status of the firm (1 if government
company, 0 otherwise) 0.769*** 0.047 0.877*** 0.047 0.801*** 0.047 0.913*** 0.048
Dummy of legal status of the firm (1 if corporation, 0
otherwise) 0.862*** 0.024 0.901*** 0.025 0.873*** 0.025 0.911*** 0.025
Dummy of legal status of the firm (1 if limited
partnership, 0 otherwise) 0.343*** 0.031 0.364*** 0.031 0.340*** 0.032 0.361*** 0.032
Dummy of legal status of the firm (1 if partnership, 0
otherwise) 0.374*** 0.085 0.411*** 0.085 0.370*** 0.086 0.407*** 0.086
Dummy of legal status of the firm (1 if cooperatives, 0
otherwise) 0.251 0.172 0.265 0.173 0.244 0.174 0.259 0.175
Dummy of legal status of the firm (1 if foundation, 0
otherwise) 0.171 0.226 0.201 0.227 0.157 0.228 0.187 0.230
Dummy of investment status (1 if domestic, 0
otherwise) 0.252*** 0.028 0.280*** 0.028 0.264*** 0.028 0.293*** 0.028
Dummy of investment status (1 if foreign, 0 otherwise) 0.381*** 0.043 0.496*** 0.044 0.409*** 0.044 0.525*** 0.044 Dummy of standardised product (1 if output is
standardised, 0 otherwise) 0.093*** 0.025 0.140*** 0.025 0.123*** 0.026 0.171*** 0.026
Dummy job training (1 if firm conduct job training, 0 if
no) 0.253*** 0.020 0.297*** 0.020 0.267*** 0.020 0.311*** 0.020
Dummy export (1 if firm exports their product, 0 if not) 0.476*** 0.023 0.492*** 0.023 0.492*** 0.023 0.508*** 0.023
Constant 9.845*** 0.055 9.779*** 0.056 9.684*** 0.055 9.611*** 0.055
Rifai Afin,Do Wages Reflect Productivity Under Minimum Wage Setting? 100
Notes:
1. Export denotes dummy for exporting firms
2. Training denotes dummy variable for firms conducting job training for employee 3. Stand denotes dummy for firms that have standardised products
4. STATINV1 denotes dummy variable for firms which have domestic status of investment
5. STATINV2 denotes dummy variable for firms which have foreign investment (There are three criteria based on raw data, domestic, foreign and others. To avoid perfect collinearity, others is not included in the model)
6. Legal denotes legal status of the firm (LEGAL1 for government company, LEGAL2 for corporation, LEGAL3 for Limited Partnership, and LEGAL4 for partnership, other legal status (5 and 6 which is included in the model) are statistically significant. There are eight criteria for legal status in raw data and this study takes six of them
7. LOC is dummy variable for firms that are located in industrial state
0.000 0.200 0.400 0.600 0.800 1.000 1.200
LOC LEGAL1 LEGAL2 LEGAL3 LEGAL4 STATINV1 STATINV2 STAND Training Export