Planning
Perencanaan
Failing to plan is
planning to fail
gagal merencanakan =
merencanakan kegagalan
You can manage what you can measure
Anda bisa mengelola apa yang bisa Anda ukur
Evaluation
Evaluasi
What gets evaluated gets produced
apa yang dievaluasi dapat dihasilkan
Your report should be
useful to yourself first
laporan Anda harus berguna
untuk diri Anda terlebih dahulu
Indicat
or
Assumption
Ta r g e t
P e r f o r m a n c e
Management
Program Objectives
M o n i t o r i n g
Activities
Risk
PMER Reference Book
Planning, Monitoring, Evaluation, and Reporting
PMER
Supported by:
PMER is Everybody’s Business
Reporting
P e l a p o r a n
P
roject
A guideline of program management in PMI organization, ranging from Planning, Monitoring, Evaluation, and Reporting. This book is devoted to PMI personnel at all levels, at Headquarter, Province, and District office, especially to those who are responsible to manage the organization/ program/project.
Adapted from various resources of International Federation of Red Cross and Red Crescent Societies (IFRC) and Project Management for Development Professional from InsideNGO.
Author
Planning Bureau PMI Headquarter
M&ER Team American Red Cross – Indonesia Delegation
Publisher
Indonesian Red Cross (Palang Merah Indonesia – PMI)
Design and Lay Out
Aksara Buana
Editor
Herry Prasetyo
Supported by
American Red Cross
International Federation of Red Cross and Red Crescent Societies-IFRC is the world’s largest humanitarian organization, providing assistance without discrimination against nationality, race, religious beliefs, class or political opinions.
InsideNGO is a global association of more than 300 international
organizations in the field of development and humanitarian. These
The PMER Reference Book has been developed by adopting and adapting various IFRC’s resources, such as Project/Program Planning Manual, Project/ Program Monitoring and Evaluation Guide, and Framework for Evaluation. In addition, a book from INSIDE NGO, titled -A Guide to the Project Management for Development Professionals- also used as main source of concepts, principles, and inspiration. During the development process, the team has tailored this reference book into PMI Organizational context and needs. Therefore, PMI expresses high appreciation to the IFRC Geneva, particularly the Department of Planning and Evaluation, as well as INSIDE NGO.
This reference book aims to introduce the project/program management process in PMI organization context, ranging from the Planning, Monitoring, Evaluation, and Reporting. This book is devoted to PMI personnel at all levels, National Head Quarter, Province, and District/City, especially for those who have roles and responsibilities in managing organization/projects/programs, both Staff/Head of Office as well as board members.
This reference book introduces and discusses in detail all basic concepts, approaches/methods, measures, and instruments/tools or formats used in Planning, Monitoring, Evaluation, and Reporting. PMI at all levels can use them directly, but also can adapt to their organizational needs and.
Finally, we hope that this book can serve as source of knowledge in order to enhance PMI’s personnel competence, especially in managing its project/ program and at the end will improving its performance to deliver better service to community.
Jakarta, April 2015 Secretary of General
Dr. Ritola Tasmaya, MPH
Table of Content
Acknowledgement ii
Table of Content iii
Abbreviation and Acronyms ix
Introduction
1
Why do project/program managers or PMI Head of Office need to master PMER? 2 Project/program’s challenges in development/humanitarian sector 4 What makes projects/programs become challenging or even fail? 7 Required competences for project/program managers or PMI Head of Office. 8
Section I Introduction to Project/Program Planning
11
1. Introduction to Planning 12
1.1. Defining Terms in Planning 12
1.2. Project/Program Cycle 14
1.3. Constraints in Projects/Programs 20
1.4. Levels of Planning 22
1.5. Strategic Planning 23
1.6. Operational Planning 23
Section II Project/Program Cycle
25
2. Project/Program Identification Phase 26
2.1. Initial Assessment 26
2.1.1. Collecting Data 27
2.1.2. Types of Data Collected During Assessment 28
2.2. Analyzing Data 30
2.2.1. Situation and Problem Analysis 30
2.2.2. SWOT Analysis 31
2.2.3. Stakeholder Analysis 33
2.2.4. Problem Analysis (using Problem Tree) 36
3. Project/Program Design Phase 53
3.1. Defining Results and Objectives 53
3.2. Logical Framework (Logframe) Matrix 54
3.3. Designing Objectives 56
3.4. Assumptions and Risks 60
3.5. Indicators 65
3.6. Means of Verification 72
3.6.1. Data Collection Tools 73
3.7. Developing Project/Program Proposal 78
3.7.1. Determining Project/Program Scope 79
3.7.2. Developing Proposed Implementation Plan 81
3.7.3. Developing Proposed Project/Program Budget 82
4. Project/Program Set Up Phase 85
4.1. Establishing the Project/Program Management Structure 86
4.2. Developing Project/Program Charter 87
4.3. Communicating the Project/Program Launch 91
5. Project/Program Planning Phase 92
5.1. Implementation Planning is Balanced 94
5.2. Implementation Planning is Comprehensive 96
5.3. Implementation Planning is Integrated 98
5.4. Implementation Planning is Participatory 99
5.5. Implementation Planning is Iterative 100
6. Implementation Phase 109
6.1. Managing Resources (Time, People, Finance) 110
6.1.1. Managing Time or Implementation Timeline 110
6.1.2. Managing Human Resources 113
6.1.3. Managing Finance 114
6.2. Managing Risks and Issues 116
6.2.1. Managing Project/Program Risks 116
6.2.2. Managing Project/Program Issues 120
6.2.3. Managing Internal Control (Logistics and Assets) 122
6.2.4. Managing Stakeholders 126
7. Monitoring and Evaluation Phase 131
7.1. Introduction to Monitoring and Evaluation 131
7.1.2. Monitoring and Evaluation Concepts 132
7.1.3. Baseline and Endline Studies 146
7.1.4. Comparing Monitoring, Evaluation, Reviews, and Audits 147
7.1.5. Minimizing Bias and Error 149
7.2. Key Steps for Project/Program M&E 152
7.2.1. Step 1 – Identifying Purpose and Scope of M&E System 154 a. Reviewing Project/Program’s Operational Design (Logframe) 154
b. Identifying Informational Needs and Expectations 156
c. Identifying Any M&E Requirements 157
d. Scope of Major M&E Events and Functions 157
7.2.2. Step 2 – Planning for Data Collection and Management 159
a. Developing M&E Plan Table 159
b. Preparing Specific Data Collection Methods/Tools 161
c. Planning for Data Management 167
d. Using Indicator Tracking Table (ITT) 182
7.2.3. Step 3 – Planning for Information Reporting and Utilization 187
a. Why Do We Need to Report? 188
b. Anticipating and Planning for Reporting 189
c. Planning for Information Utilization 198
7.2.4. Step 4 – Planning for M&E Human Resources and Capacity Building 205 a. Assessing Project/Program’s Human Resources Capacity for M&E 205
b. Determining the Extent of Local Participation 205
c. Determining the Extent of Outside Expertise 208
d. Defining Roles and Responsibilities for M&E 208 e. Identifying M&E Capacity Building Requirements and Opportunities 209
7.2.5. Step 5 – Preparing M&E Budget 210
a. Itemizing M&E Budget Needs 210
b. Incorporating M&E Costs in Project/Program Budget 211 c. Reviewing Any Donor Budget Requirements and Contributions 211
d. Planning for Cost Contingency 211
8. End of Project/Program Transition Phase 213
8.1. Managing End-of-Project/Program Transition Strategy 214 8.2. Verifying Project/Program Scope and Accepting Deliverables 216 8.3. Completing Administrative, Financial, and Contractual Closure 217
8.4. Completing End of Project Learning 218
ANNEXES
221
Annex 1 : Glossary of key terms for PMER 222
Annex 2 : Factors affecting the quality of M&E information 226 Annex 3 : Checklist for project/program M&E steps 227 Annex 4 : M&E plan table template and instructions 229
Annex 5 : Example of M&E activity table 233
Annex 6 : Key data collection methods and tools 234
Annex 7 : Indicator tracking table (ITT) Benefits and instructions 237
Annex 8 : IFRC’s project/program management report 241
Annex 9 : Guideline for evaluation questions 251
Annex 10: Example of proposal template 267
Annex 11: Red Cross and Red Crescent 269
The Code of Conduct for The International Red Cross and
RedCrescent Movement and NGOs in Disaster Relief
270
Safer Access framework (guideline for security and safety)
271
References
275
List of Diagrams, Tables, and Boxes
Diagram 1 Project Success Rate 5
Diagram 2 Illustration of Project/Program Failure Causes 7
Diagram 3 Project/Program Cycle 15
Diagram 4 Project/Program Phase Interaction 19
Diagram 5 Project/Program Constraint Triangle 20
Diagram 6 Strategic and Operational Plan scheme 22
Diagram 7 Relationship between Strategic Plan and Operational Plan. 24
Diagram 8 Problem Tree Scheme 37
Diagram 9 Example of Problem Tree for a Sanitation Project 41 Diagram 10 Example of Problem Tree (Disaster Risk Reduction and Disaster Management) 42 Diagram 11 Example of Objective Tree for a Sanitation Project 45 Diagram 12 Example of Objective Tree (Disaster Risk Reduction and Disaster Management) 46 Diagram 13 Example of Objective Selection for a Sanitation Project 49 Diagram 14 Example of Objective Tree (Disaster Risk Reduction and Disaster Management) 50
Diagram 15 Objective Chain Hierarchy 54
Diagram 16 Levels of Indicator 68
Diagram 17 Types of Data Collection Methods and Tools 74
Diagram 18 Example of Scope Identification Diagram 81
Diagram 22 Sequence of Latrine Construction Activities 103 Diagram 23 Estimating Duration for Latrine Construction Activities 105 Diagram 24 Initial Scenario for Latrine Construction Activities 111 Diagram 25 Fast Tracking Scenario for Latrine Construction Activities 111 Diagram 26 Initial Scenario for Latrine Construction Activities 112 Diagram 27 Crashing Scenario for Latrine Construction Activities 112
Diagram 28 Monitoring Questions and Logframe 133
Diagram 29 Evaluation Questions and Logframe 136
Diagram 30 Example of M&E Activities 158
Diagram 31 Data Management Process 168
Diagram 32 Example of Information Flow in Project/Program Reporting 191
Diagram 33 Four Project/Program Transition Scenarios 213
Table 1 Description of Project/Program Managers (Head of Office) Competencies 10
Table 2 Explanation of Key Terms in Planning 12
Table 3 Example of a SWOT Analysis from PMI District B 32
Table 4 Example of Stakeholder Analysis Matrix 35
Table 5 Tips to Create Problem Tree Statements 40
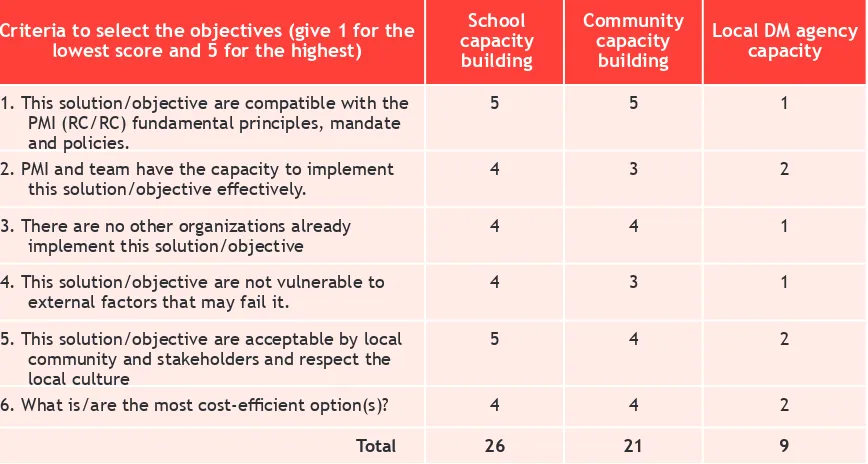
Table 6 Example of Objective Selection Matrix 51
Table 7 Definition of Logical Framework (Logframe) Terminology 55 Table 8 Examine the Vertical and Horizontal Logical Relationship “If; And; Then” 62
Table 9 How to Determine Assumption 64
Table 10 Example of SMART Indicator Criteria 67
Table 11 Traps during Identifying Indicators 71
Table 12 Example of Sanitation Project Logframe Matrix 75 Table 13 Example of Disaster Preparedness Project Logframe Matrix 76 Table 14 Example of Activity Implementation Schedule 82
Table 15 Project Charter 88
Table 16 Project/Program Proposal Vs. Detailed Implementation Plan 93
Table 17 Example of Activity Budget Plan 104
Table 18 Gantt Chart of Latrine Construction Activities 107 Table 19 Assessment for Budget Realization and Time Utilization 115
Table 20 Example of Risks Assessment Matrix 118
Table 21 Project/Program Risks Assessment Matrix 120
Table 22 Example of Issue Log 122
Table 23 RACI Matrix of Sanitation Project 127
Table 24 Communication Plan 128
Table 25 Common Types of Monitoring 134
Table 26 Summary of Types of Evaluation 138
Table 27 Comparing Key Features of Monitoring/Review, Evaluation, and Audit 149
Table 28 Example of M&E Plan 160
Table 29 Example of Indicator Tracking Table – ITT 183
Box 1 Minimum criteria for Situation Analysis 30
Box 2 SMART Criteria 66
Box 3 Key Principles in Monitoring 133
Box 4 M&E in Emergency Settings 154
Box 5 Source of Standardized Indicator 155
Box 6 Example of Stakeholder’s Needs of Information 156
Box 7 Is an M&E Plan Worth All the Time and Effort? 159 Box 8 Comparing Quantitative and Qualitative Data 162
Box 9 Minimize Data Collection Costs 167
Box 10 Benefits of Involving Stakeholder in Data Analysis 175
Box 11 Analysis Questions to Describe Data 177
Box 12 Using Traffic Lights” to Highlight Data 180
Box 13 Comparing Data Analysis: Finding, Conclusion, Recommendation, Action Plan 181
Box 14 The Importance of Target Setting 186
Box 15 Internal Vs. External Reporting 190
Box 16 Example of Reporting Format 192
Box 17 Criteria of Good Reporting 194
Box 18 Project/Program Management Report Outline 196
Box 19 Report Writing Tips 197
Box 20 Reporting Roadblocks and Solutions 198
Box 21 Key Categories of Information Use 199
Box 22 Key Medium of Information Dissemination 199
Box 23 Considering Participatory M&E 207
Abbreviation and Acronyms
DAC Development Assistance Committee
FWRS Federation-Wide Reporting System
HNS Host National Society
HR Human Resources
ICRC International Committee of the Red Cross
IFRC International Federation of Red Cross and Red Crescent Societies
IT Information Technology
ITT Indicator Tracking Table
M&E Monitoring and Evaluation
MoU Memorandum of Understanding
NGO Non-Governmental Organization
OECD Organization for Economic Co-operation Development
PED Planning and Evaluation Department
PMER Planning, Monitoring, Evaluation and Reporting
PNS Participating National Society
RBM Results-Based Management
RTE Real-Time Evaluation
SMART Specific, Measurable, Attainable, Relevant, Time-bound
SWOT Strengths, Weaknesses, Opportunities and Threats
ToR Terms of Reference
Indonesian Red Cross (PMI) will celebrate its 70th birthday on 17 September 2015. In this ‘mature’ age, it is important for us to reflect on the extent to which this movement has delivered impact and benefits to those people we serve. PMI have done many things for a better Indonesia, especially in blood donation service, disaster response, and other social services. However, we also realize that in some parts of Indonesia archipelago, there are PMI provinces/districts that are need to work harder to roll out its mission and mandate.
Concerning Planning, Monitoring, Evaluation, and Reporting (PMER) capacity, in December 2012-January 2013, PMI Headquarter collected data from 33 provinces and 300 districts/cities. The assessment results are including:
ü The planning process were delayed in more than 50% of PMI District/ City (generally took place on February to May of the ongoing year), and therefore the annual planning is ineffective and does not in line with government planning schedule.
ü The main obstacle of the planning process is the absence of guideline as well as inadequate skills among staffs (which is needed to be strengthened by PMI Headquarter/Province)
ü As results, more than 40% of PMI District/City do not conduct its Annual Planning Meeting; often the annual work plans are basically list of activities rather than objective based activity, there’s lack of planning synergy between province and district, and ultimately ineffective to contribute to the national strategic objectives, organizational mission and vision.
ü PMI Province/District/City facing difficulties in operationalizing the 2009-2014 Strategic Plan as there were a lot of overlapped statements between the Mission, Strategic Objectives, program and activities, as well as the absence of performance indicators to measure its success.
Why do project/program managers
ü It is also very difficult for PMI Headquarter to collect the data from Province and District/City and as result information is inadequate for organizational management (for instance to develop an annual report for Annual Planning Meeting or General Assembly). Further, in some occasions such as IFRC international conference, data from Indonesian Red Cross (PMI) was not available. Therefore, it is very critical to improve the reporting capacity, guideline, as well as the tools.
ü Almost 90% out of 300 Districts/Cities do not have a standard Monitoring and Evaluation (M&E) system and mechanism in place. This has affected program performance as well as its relationship with partners.
The assessment results were presented at the National Planning Meeting on February 2013, in Yogyakarta, and the following recommendations were made:
ü It is important to establish a planning cycle (schedule) and issuing planning and reporting policies to be implemented at all levels.
ü Planning between levels (headquarter, province, and district/city) needs to be more synergized.
ü PMI headquarter need to improve PMER capacity at province and district/city through workshops or training or mentoring.
Reflecting on those facts above, specifically related to Planning, Monitoring, Evaluation, and Reporting capacity, there are four main questions that we need to reflect and answer honestly.
1. Since PMI exist in your Province/District/City, how does the planning process take place? How was the strategic plan or operational plan or annual work plan developed? Was the planning based upon facts/ information? Whether it is in accordance with standard planning practices? Was it participatory process?
3. As we witnessed nowadays, there are thousands of humanitarian organizations exist in the world as well as in Indonesia. Generally, they have good system in place, such as organizational systems, human resources, as well as strong financial capacity. In this environment context, what would enable PMI to survive or compete with them? Will PMI able to stand upright in such tough ‘competition’?
4. With all its internal dynamics as well as challenges from external, what is the PMI’s strategy to be an organization that is accountable and trustworthy by the government, donors, communities, and other stakeholders?
As an organization working on humanitarian or development sector, PMI should actualize its vision and mission through sustainable projects or programs. For instance, blood donor services, disaster management, as well as health and social services, both in times of emergency and non-emergency. What are you doing right now? Surely, you are managing and implementing a program or project, which ultimately aims to change the world, for the better, is not it?
PMI is not alone. Hundreds of thousands of organizations engaged in the development sector, including the government, globally working to change the world in a variety of fields, such as health, disaster preparedness, education, agriculture, microfinance, environmental conservation, affordable housing, infrastructure, and human rights. They are all share one thing in common: They change the world through project/program!
Working on development/humanitarian sector has its own challenges, more difficult and complex as it is very much related to promoting social change, behavior change, economy, education and culture, which ultimately leads to improvements in the human well-being. In addition, development project/program tend to operate in exceptionally challenging contexts such as problems of poverty, inequality and injustice, limited resources and organizational capacity, internal dynamics, policy/regulation, unstable political and interest, even unsafe conditions.
Project/program’s challenges in
development/humanitarian sector
“When you are working in PMI,
Speaking about challenges affecting project/program success/failure, we need to learn from Standish Group who conducted survey to over 10,000 Information Technology (IT) Project in 2008. The findings are as follow.
1. SUCCEEDED projects (arrive on scope, on budget and on time) = 32% 2. FAILED projects (terminated early or abandoned in the mid-way) = 24% 3. CHALLENGED project (completed but fail to meet the original
scope, budget and calendar) = 44%
Compared to the development project/program as described above, probably IT projects relatively simpler, in terms of both results and objectives as well as the context and other factors affect it. This means that the possibility to fail in the project/program of development/humanitarian sector could be higher.
Diagram 1.
IT Project Success Rate
Success rate of 10,000 IT project, Standish Group report
SUCCESS FAIL
CHALLENGES
60
50
40
30
20
10
0
2000 2002 2004 2006 2008
28% 34% 29% 35% 32%
23% 15% 18% 19% 24%
Another example, one well-known international NGO, faces significant challenges in implementing its project/program in many parts of the world. Over a period of one year: 70 programs were overspent by more than 10%; 235 projects were overspent by more than 10%; the amount of project overspend was over 15,000,000 pounds (IDR 300 billion). At the end of the year 89 projects had overdue its milestones.
PMI also experienced this. For example, in partnership with a supporting national society, within the recent three years, from 11 projects implemented in the various regions, of which there are six of two-year project facing difficulties, both on budget and schedule/time management.
When those projects have reached its end (i.e., two years), that spending rate only less than 60%, and there were many activities have not been implemented yet, so as the results have not been achieved. This has caused by variety of things, such as inadequate project/program management capacity, lack of knowledge and technical skills, organization internal dynamics that create less conducive for project/program implementation, limited support and participation from various stakeholders.
This judgement, however, mainly in terms of quantity, namely the execution of planned activities and budget absorption. If we try to examine the implementation quality or the achievement of project performance indicators at output, outcome, and goal level, it will be much more apprehensive.
This graphic serves as illustration of just some of many challenges that could threaten the success of a project/program.
Diagram 2. Illustration of Project/Program Failure Causes
Incorrect/inadequate understanding of need
Poor design Unrealistic expectations
Inadequate resources Project delays Natural disasters
Inadequate capacity Unrealistic Budget Low quality materials
For example: internal dynamics within the implementation team, lack of support from senior management/board members, monitoring system is not in place, accurate and timely information is not available, unreliable vendors, limited support from stakeholder, political, security, and economy instability.
Therefore, project/program management competence is vital to anticipate and address those various challenges, obstacles, and problems as mentioned above.
It is not over stated if we say that the lives of millions of people often depend on the ability of development or humanitarian organizations to deliver results effectively and efficiently. Therefore, PMI existence is expected to increase the wellbeing of communities it serves.
While in fact, project/program management is rarely regarded as a major/ vital strategy to improve the organizational performance. Generally, the development/humanitarian organizations (including PMI) tend to focus on technical programmatic areas.
In PMI, for example, there are many technical training provided to increase its personnel technical capabilities, such as first aid, assessment, emergency response, restoring family links, relief distribution, water and sanitation, public kitchens, as well as temporary shelter.
There are many personnel in PMI both staff and the head of the offices were given responsibility to manage project/program, while they actually do not have extensive experience and skills in management.
Required competences of a project/
program manager or
Lack of skills and expertise of projects/programs management are often the major roots of difficulties or even failures to achieve the intended results. However, too often that failed projects/programs are chalked up as the victims of circumstances that were “out of project/program team control.” While this explanation might be valid at times, too often it is used as an excuse of why project/program fails to meet its objectives. Manager and team fails to acknowledge that risks could have been better anticipated, analyzed, and actively managed.
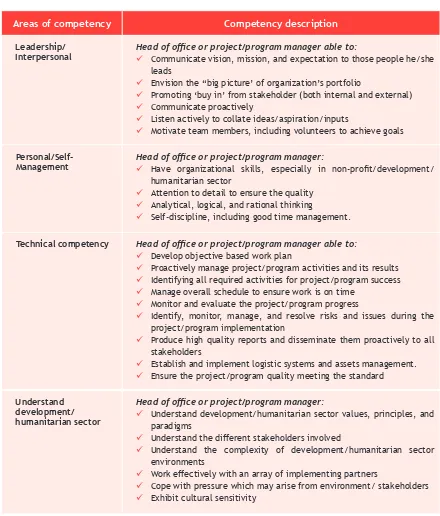
Project/program management is combination of science and art. If those two are not adequate then will cause ineffective project/program management and implementation in its attempt to achieving the expected results and objectives. Head of office or project/program manager is a very strategic position for organizational or program management. Therefore, a head of office or project/program manager must have the following competencies.
You are never given a wish without also being given
the power to make it true.
You may have to work for it, however.
Table 1.
Description of Project/Program Managers (Head of Office)
Competencies
Areas of competency Competency description
Leadership/
Interpersonal Head of office or project/program manager able to:ü Communicate vision, mission, and expectation to those people he/she
leads
ü Envision the “big picture’ of organization’s portfolio
ü Promoting ‘buy in’ from stakeholder (both internal and external)
ü Communicate proactively
ü Listen actively to collate ideas/aspiration/inputs
ü Motivate team members, including volunteers to achieve goals
Personal/Self-Management
Head of office or project/program manager:
ü Have organizational skills, especially in non-profit/development/
humanitarian sector
ü Attention to detail to ensure the quality
ü Analytical, logical, and rational thinking
ü Self-discipline, including good time management.
Technical competency Head of office or project/program manager able to:
ü Develop objective based work plan
ü Proactively manage project/program activities and its results
ü Identifying all required activities for project/program success
ü Manage overall schedule to ensure work is on time
ü Monitor and evaluate the project/program progress
ü Identify, monitor, manage, and resolve risks and issues during the project/program implementation
ü Produce high quality reports and disseminate them proactively to all stakeholders
ü Establish and implement logistic systems and assets management.
ü Ensure the project/program quality meeting the standard
This reference book, however, will not discuss all of the above areas of competence, but technical competencies to manage a project/program. PMI works often difficult and therefore competent head of office and staff to manage the organization and its programs in a professional manner is essential.
Understand development/ humanitarian sector
Head of office or project/program manager:
ü Understand development/humanitarian sector values, principles, and paradigms
ü Understand the different stakeholders involved
ü Understand the complexity of development/humanitarian sector environments
ü Work effectively with an array of implementing partners
ü Cope with pressure which may arise from environment/ stakeholders
INTRODUCTION TO
PROJECT/PROGRAM
PLANNING
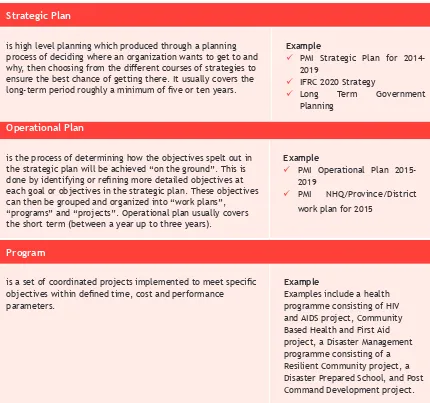
Before a more in depth discussion on Planning, Monitoring, Evaluation, and Reporting or project/program management, we need to understand a few key terms that will be used in this book. Thus, we can understand the strategic plans, operational plans, projects, programs, activities, and tasks consistently in one context.
Table 2.
Explanation of Key Terms in Planning
Strategic Plan
Operational Plan
is the process of determining how the objectives spelt out in
the strategic plan will be achieved “on the ground”. This is done by identifying or refining more detailed objectives at
each goal or objectives in the strategic plan. These objectives
can then be grouped and organized into “work plans”, “programs” and “projects”. Operational plan usually covers
the short term (between a year up to three years).
Example
ü PMI Operational Plan
2015-2019
ü PMI NHQ/Province/District work plan for 2015
1.1. Defining Terms in Planning
Program
is a set of coordinated projects implemented to meet specific objectives within defined time, cost and performance
parameters.
Example
Examples include a health programme consisting of HIV and AIDS project, Community Based Health and First Aid project, a Disaster Management programme consisting of a Resilient Community project, a Disaster Prepared School, and Post Command Development project.
Introduction to Planning
1
is high level planning which produced through a planning process of deciding where an organization wants to get to and
why, then choosing from the different courses of strategies to
ensure the best chance of getting there. It usually covers the
long-term period roughly a minimum of five or ten years.
Example
ü PMI Strategic Plan for
2014-2019
ü IFRC 2020 Strategy
Project
is a set of planned and coordinated activities implemented
to meet specific objectives within defined time, cost and
performance parameters. Projects aimed at achieving a common goal form a programme.
Example
Community Based First Aid project
to expand the reach of first aid
in a region or a Disaster Risk Reduction project to increase awareness of disaster preparedness and response measures. These projects would consist of various activities, like those described below.
Activity
is a combination of several tasks required to be done to deliver product/result/services. To be well done, an activity is needed to be planned in detail.
Example
Training for Disaster Response Team, health promotion/ education, disaster drill,
organizing a community meeting, developing communication materials, providing orientation for volunteers, or organizing the distribution of relief supplies.
Task
are the simplest actions that make up activities. Example
Examples of tasks for a training include preparing training materials, sending invitation to participants, arranging venue, preparing assignment letter, checking a training toolkits, printing participants manual, and purchasing stationary.
1.
Introduction to
planning
PMI personnel, especially in some areas, prefer to use “program” for a project because of project has a “less positive” connotations. A ‘project’ often perceived with “a lot of money”. Hence, with the explanation above, PMI personnel are expected to understand the definition of programs and projects clearer and can use these terms appropriately.
For development project/program to succeed, it is critical that the full array of project management competencies be applied in a balanced way through the entire life of the project/program. To this end, many development organizations have developed project/program life cycle diagrams which they use to identify the phases through which their project/program pass from beginning to end. The cycle describes assessment, planning, implementation, monitoring and evaluation. Together, these cycle phases identify the logical sequence of activities that accomplish the intended goals or objectives.
Project/program life cycle diagrams can vary considerably, however, their objectives are the same. By grouping activities into a project/program life cycle sequence, the project/program manager (head of office) and the core team can:
ü define the phases that connect the beginning of a project/program to its end.
ü identify the processes that project/program teams must implement as they move through the phases of the project/program life cycle.
ü illustrate how the life cycle or phases can be used to model the management of project/program.
ü model how projects work within an environment of ‘constraints’, including time, resource, and scope; where changes to any one constraint will result in consequential changes to the other parameters.
This reference book adopts the phase model in the PMD Pro Manual developed by INSIDE NGO1 to help managers and core team to understand those four items above easier. This model is not meant to replace any specific project/ program life cycle model, instead, its purpose is to provide a balanced and comprehensive project/program phase model that covers the entire life of the project/program.
1.2. Project/Program Cycle
Too often, development organizations, such as PMI, have placed an especially strong emphasis on project Design, Monitoring and Evaluation, but this emphasis has sometimes overshadowed the importance of other phases in the life of the project/program. Clearly, strong design and M&E is necessary. However, it is not sufficient to guarantee project/program success. This is has to be changed by commit to investing similar levels of resources and effort in all the phases in the life of the project/program. Following diagram includes all phases of a project/program.
Within the phase model in the above diagram, there are six phases take place in a project/program life period. These phases will be briefly explained and will be discussed further in detail.
Project/program identification and design phase
Identification Phase - It is process to understand the current situation and to define whether not a project/program is needed. At this phase, PMI identify needs, explore opportunities, and analyze the organization capacity and environment through an initial assessment. Initial assessment is conducted by identifying key factors, which affect the current situation including issues, and it causes, needs, interest, capacities, and challenges from each of existing stakeholders. Identification phase is done through initial assessment, analysis (SWOT analysis, Stakeholder Analysis, Problem Analysis, and Objective Analysis).
Diagram 3. Project/Program Cycle
Monitoring, Evaluation and Reporting
Decision Gate
Project/ Program Identification
and Design
Project/ Program
Setup
Project/ Program Transition
Planning
Design Phase is a process to design project/program framework by determining its intended objectives, inputs, and activities required to achieve them, indicators to measure its achievements, and key assumption which could affects the project/program success. At this phase, PMI start to develop a frame for project/program work plan or logical framework (log frame).
The ultimate product of this design phase is description of work plan that is in line with PMI Planning and Reporting Guideline. In addition, the result could be a project/program proposal, which articulates log frame, means of implementation (strategies and activity components), detail implementation plan, M&E plan, and estimated budget and required resources.
Project/program Setup
It is during this phase that a project/program is officially started. Ideally, there are three things needed to be prepared.
First, prepare a project/program charter or a document provides a high-level description of a project/program, such as objectives and expected results, budget and time line, number of beneficiaries, potential risks, tolerance or acceptable change, as well as the project/program management structure. This document is important to ensure common understanding among all organizations entities and stakeholders towards the project/program.
Second, the project/program management structure along with specific tasks and functions of each team member. Thus, the division of roles and responsibilities clearly understood by all parties.
Project/program Planning
Based on the initial proposal or work plan, at this Planning phase, team will develop a activity implementation plan which is detail and comprehensive. During the design phase, work plan often contains key activities, while in this phase those activities will be detailed into a set of tasks required to be done within a narrow time line (for instance in weekly basis). This Planning stage will cover scope, time, and resources, stakeholders, and risks management.
This plan will be used as guidance for project/program team to undertake all activities and works which are required along the project/program implementation. This planning not only done at once, but iterative. It means that this work plan will be revisited periodically, and adjusted when needed. Therefore, project/ program planning and implementation remain relevant to the existing needs and context. At the end, this phase will produce “Project/Program Detail Implementation Plan” which is details and comprehensive.
Project/Program Implementation
The day-to-day work of project/program implementation is to lead and manage the application of the project/program implementation plan. In this phase, head of office or project/program manager leading the team, dealing with issues, managing the team and creatively integrating the different elements of the project/program work plan.
Project/Program Monitoring and Evaluation
Monitoring is a routine collection and analysis of information to track progress against set plans and check compliance to established standards, and it helps identify trends and patterns, adapt strategies and inform decisions for project/program management. Monitoring plan and its mechanisms should be designed at the design and planning phase to allow adequate time, resources, and personnel to collect data related project/program’s progress. This progress report can inform decision making on whether a project/program needs to be changed or not, or need to be adjusted to its operating context. In essence, monitoring occurs continuously to determine progress and identify corrective actions if there is a mistake or a significant deviation from the original plan.
Evaluation is “an assessment, as systematic and objective as possible,
of an ongoing or completed project/program including policy, its design, implementation and results. The aim is to determine the relevance and fulfilment of objectives, developmental efficiency, effectiveness, impact and sustainability of a project/program. An evaluation should provide information that is credible and useful, enabling the incorporation of lessons learned into the decision-making process by both project/program team or donor. Evaluation inform the planning process, whether to continue the similar project/program in wider area (replication) or modifying the means of implementation of the same project/program in the same area or elsewhere.
End of Project/Program Transition
At this stage, the team will implementing all the transition activities that need to occur at the end of a project/program. Such activities include communicating deliverables/results with stakeholders, including beneficiaries, identifying important lessons learned and experiences, and completing the administrative, financial, contract, closure activities, etc.
Further, the team need to ensure that the project/program’s continuation is justified or, if needs have changed, to possibly even cancel or terminate the project/program.
The six phases model gives the impression that the phases are discrete and sequential. While in reality, they interact and overlap.
For example:
ü Already in the project/program identification and design phase, extensive works is being completed to prepare implementation plan and M&E plan.
ü Monitoring is taking place throughout the project life; while evaluation takes place in the midterm or at the end.
ü Throughout the implementation, activities will take place to ensure efficient closeout when the end of project/program transition phase arrived.
Diagram 4.
Project/Program Phase Interaction
Project/Program Interaction
Level of worl/resources
start
Identification
and Design
Setup
Planning Monitoring & Evaluation
Implementation
End of Project/ Program Transition
The following diagram illustrates the interaction clearly; it shows how the phases overlap with other phases.
In addition to understand project/program cycle or phases, a manager or head of office should aware of project/program constraints. These constraints often called “Triple Constraints” which is explained further.
Scope/Quality – What are the products or services that the project/program will produce and what is the work required to produce these deliverables?
Cost/Resources – What money, materials and effort are available to deliver
the project/program’s product/services and to complete the comprehensive work of the project and meeting the expected quantity and quality?
Time/Schedule – What is the amount of time required to complete the components of the project/program?
1.3. Constraints in Projects/Programs
Diagram 5.
Project/Program Constraint Triangle
risk
risk
risk
Time/Schedule
Not flexible
Adaptable
May concede
Cost/Resources
Scop
It is the task of project/program manager (or head of office) to ensure that the triple constraint triangle stays in balance. As you could see that each of the constraints is connected to the others. Whenever one of these constraints is restricted or extended, the other constraints will also need to be extended/increased or restricted/reduced.
The manager needs to understand the relationships and trade-offs that exist between each of the constraints. The three basic classifications for the constraints are:
ü Inflexible – indicating that the constraint is critical and must be constrained. For instance, money cannot be added or reduced. ü Adaptable – indicating that the constraint is negotiable, but should be
optimized as much as possible. For instance, when it is possible, time could be added or scope could be reduced.
ü May concede – indicates a constraint where trade-offs can be made in
order to manage the inflexible constraint or optimize the adaptable constraint, or in other word: ‘optimize the constrains which is adaptable. For instance, scope (in quantity or quality; a target for example) could be adjusted to be achieved in a time interval which is not flexible.
Diagram 6.
Strategic Plan and Operational Plan Scheme
Strategic plan guides the organization's overall
direction by defining the vision and missions as well Operational plan determines how the objectives described in the Strategic Plan will be achieved
Planning consists of determining solutions to an unsatisfactory situation by identifying the results that will best address identified problems and needs, and the actions and resources required to achieve those results. It is the foundation of good performance management and accountability.
Planning can also be seen as a process of choosing from the different courses of action available and of prioritizing the steps to take in order to change a particular situation for the better. Usually, time and resources (material, financial, human) are limited. Therefore, prioritization has a direct consequences on an organization’s ability to improve or resolve a problematic situation. This is why planning is so crucial, especially in an organizations with limited capacity.
Frequently, planning is considered a difficult exercise, complicated and inaccessible or a matter reserved for specialized technicians with specific qualifications. However, in reality, we plan all the time in our daily lives: planning for weekend activity, organize a party or a trip? In these and many other aspects of our lives, we have to plan what we want to do and with whom, which steps to follow and what we need to get things done.
Although almost anything can be planned, the ways in which we make plans and implement them are not always the same. Different levels of planning have to be established according to the aims of the planning process. In the International Federation of Red Cross and Red Crescent, including PMI, a distinction is made between “strategic” and “operational” planning. Both are integral parts of the overall process of setting priorities and targets for the organization.
Strategic planning is the process of deciding where an organization wants to get to and why, then choosing from the different courses of action available to ensure the best chance of getting there.
It helps an organization to define a clear way forward in response to emerging opportunities and challenges, while maintaining coherence and long-term sustainability. The strategic objectives should be linked to prioritized sectors of intervention based on the capacities of the organization and other stakeholders and should include a time- frame and outline evaluation mechanisms.
One of the key functions of the strategic plan is to guide and influence the development of more detailed planning at the operational level. Therefore, a strategic plan is a key reference for project/program managers when designing, implementing and evaluating its performance. It usually covers the long term planning (roughly a minimum of four to ten years).
Operational planning is the process of determining how the objectives spelt out in the strategic plan will be achieved “on the ground”. This is done by working through a series of steps, identifying or refining more detailed objectives at each level, linked to the objectives in the strategic plan.
These objectives can then be grouped and organized into “work plans”, “programs” and “projects”. Operational planning usually covers the short term (between one year to five years).
In order to translate strategic objectives into practical results, the required actions need to be planned (in a work plan), along with their costs (in a budget), how the work will be funded and who will carry out the work (resource mobilization plan).
1.5. Strategic Planning
Overall-it looks great.
The relationship between strategic and operational planning is also a cyclical process, with the experience from operational planning being used to inform strategic planning, and strategic planning then informing the general direction of operational planning. Operational plans are often made up of several “programs”, which are in turn made up of several “projects”. Likewise the relationship of strategic plan and operational plan, program also informs the projects implementation. On the other hand, projects implementation inspires program development.
Diagram 7.
Relationship between Strategic Planning and Operational Planning
The board
High level Federation-wide strategic (Strategy 2010/2020)
PMI 2014-2019 Strategic Plan
Annual work plan or projects (includes
Both of these plans should be inspiring, specific,
PROJECT/
PROGRAM
CYCLE
All projects begin as an idea – a need or opportunity that is assessed, analyzed, and ultimately developed into a project/program. It is during this process that we begin answering the critical question ‘are we doing the right project/program?’ Get it wrong here, and the project/program will be wrong for a long time – even if all of the work of the project is planned and implemented well. Get it right, and you may be half way there.
During the identification and design phase, time, resources, and efforts are invested to define needs, explore opportunities, analyze the project/program environment, cultivate relationships, build trust, develop partnerships and design a project/program to address the problem in the targeted areas.
Therefore, this phase should be done correctly, otherwise, scopes, time and resources estimation in the project/program design will be mistaken. Once a project/program has been implemented, it will become much harder to make any changes to those three parameters. Therefore, it is important that a project/program manager (head of office) gather and analyze data to inform decision making during identification and design phase.
Project/Program Identification Phase
2.1. Initial Assessment
2
Monitoring, Evaluation and Reporting
Decision Gate
Project/ Program Identification
and Design
Project/ Program
Setup
Project/ Program Transition
Planning
2.1.1. Collecting Data
Identifying project/program needs
As part of this broad exploration process, PMI head of office and staff will need to collect data that identifies organizational and community needs in the potential intervention area. This data collection must be done through triangulation of source and method to obtain objective and accurate result.
One way to triangulate the process of needs identification is to use an approach introduced by American sociologist, Jonathan Bradshaw. He believes that needs assessments should explore four types of need in a community and that the presence of all types of needs would indicate a “real” need. With this approach, the ‘real’ need could be identified correctly. Following is the four category of social need.
a. Normative needs – compare the current situation to a set of professional or expert standards (such as physicians, nutritionist, engineers, public health professionals, disaster expert, etc.). For example, a sanitation expert might indicate that rates of fecal matter in household water are above the standard established by the ministry of health; shelter construction should meet Public Works’ standard; under five baby growth should meet the standard by nutritionist; baby should get complete basic immunization before celebrating their first birthday based on World Health Organization (WHO) standard.
b. Comparative needs – compare the current situation with the situation of others. One of the most common uses of this approach has been the comparison of people’s access to resources. For example, diarrhea cases in higher in the villages with insufficient sanitation facilities compare to villages which has them; flood impact is more severe in village which has no early warning system compare to other villages with well function early warning system; ability to provide sufficient blood product in Blood Transfusion Unit (BTU) in District A compare to BTU in District B.
c. Felt needs – focus on the thoughts and dreams of the community itself. What the people themselves believe should be the priority. A felt need is likely to be subjective and could be better described as a ‘want’. Felt need is necessarily affected by the knowledge and expectations of the individual, which may be unrealistic and/or unaffordable. For example, community wants to build meeting point
2. P
roject/P
rogram
Identification P
d. Expressed needs – are inferred by observation of the community’s actions. Community members often indirectly show that they need something and we could observe their actions. For example, mothers willing to go to the public health center which is far away to vaccinate their babies, long queue to health services, community start to identify waste disposal points, community start to agree upon early warning sign for disaster.
Normative needs often become the top priority and then the comparative needs. When these needs are not met, it would tend to create problems in the future. Identifying felt and expressed need could be as a way to confirm whether the first two needs is real. With this approach, PMI and the community will be able to identify the real needs to be effectively addressed.
2.1.2. Types of Data Collected during Assessment
The data collection process, however, is not limited solely to defining needs, but also to fully understand the project/program context and environment. Therefore, the project/program team will need to collect data regarding a number of areas, including, but not limited to data related to:
ü Organizational capacities, experiences, successes, weaknesses
ü Local stakeholders capacity (government, community, other institution)
ü Community strengths, opportunities and vision ü Biological/physical environment
ü Organizational networks (PMI partners) ü Infrastructure (system, facilities) ü Legal, policy and political institutions ü Social and cultural conditions
In each of these areas, there are three types of data that may be collected:
ü Secondary data – is data that is collected not specifically for the
Sometimes selective primary data collection will be necessary to verify the reliability and relevance of secondary data to the specific context, or to obtain deeper, more specific information.
ü Primary quantitative data – primary data is data that is collected specifically to be used for a project/program design. In situations where secondary sources do not provide sufficient assessment information, PMI can collect data via quantitative assessment approaches (surveys, questionnaires, tests, standardized observation instruments) that focus on information that can be counted and subjected to statistical analysis.
ü Primary qualitative data – In contrast to quantitative data approaches, qualitative approaches seek to capture participants’ experiences using words, pictures and objects (and even non-verbal cues provided by data providers).
Combining secondary and primary data as well as both qualitative and quantitative methods is the best way to gather a more comprehensive and accurate (high quality) information.
Regardless the type or methods or approach you use to collect data, before starting the data collection, you need to ask ‘how will this data be used?’ If there is no acceptable answer to the question, do not proceed. Time and resources are too valuable to be wasted in useless exercises.
Regrettably, many assessment exercises have collected extensive data which have produced large documents that often sit on the shelf “collecting dust.” These documents are a poor use of resources, can be an intrusion on the lives of stakeholders, and create false expectations that could damage important partner and/or beneficiary relationships.
As a conclusion on data collection, you must gather data effectively, by: ü collect only the data that you need
ü using secondary data as much as possible, ü triangulate the sources or methods.
After data collection during the initial assessment, it will be analyzed to consider the needs, interests, resources and capacities, desired objectives/ results, inputs and activities required to achieve them, indicators of success, as well as assumptions that can affect the success of the project/program.
The aim of the first steps in the analysis stage is to understand in more detail the information gathered during the assessment phase. It is often a transitional step between initial assessment and design. The conclusions and recommendations of the assessment should be used as the basis for a more detailed analysis of the problems to be tackled. If the information collected appears to be inaccurate, incomplete or biased, it may be necessary to redo some of the assessment steps, using the relevant methodology and tools. It is therefore useful for the people who carried out the initial assessment to participate in this stage of the planning phase.
Tools for analysis
Situation analysis requires tools to summarize, compare, prioritize and organize data. Many different tools can be used – those provided here are examples only and are not necessarily the best tools to use in every situation.
2.2. Analyzing Data
Box 1.
Minimum Criteria for Situation Analysis
Whatever tool is used for situation analysis, you need to ensure the following things:
ü Board members, staff, and volunteers, including people the project/program aims to help, should participate during the analysis process.
ü The analysis result covers organizational capacity assessment and analysis of stakeholders/ potential partners
ü The opportunity to decide project/program implementation strategy is given to those who analyze the data as well as allow room for creativity, to plan the changes needed to improve the situation
A tool is only useful if used at the right time and in the right way. This manual proposes three tools to analyze the situation:
1. SWOT analysis – a tool with a wide range of uses, including, as suggested here, to assess the capacity of the implementing agency or team.
2. Stakeholder analysis – to assess the problems, interests and potential of different groups in relation to the conclusions of the assessment
3. Problem tree analysis – to get an idea of the main problems and their causes, focusing on cause-effect relationships
The above tools can be supplemented or replaced by other tools, as long as the minimum criteria are met.
2.2.2. SWOT Analysis
A common tool used to analyze the situation before designing a project/ program is the “SWOT analysis”. This can be used to facilitate participatory group discussions to identify and compare strengths, weaknesses, opportunities and threats related to different aspects of the situation being analyzed.
“Strengths” and “Weaknesses” are taken to be factors internal to an organization and “Opportunities” and “Threats” to be external factors. An alternative is to define “strengths” and “weaknesses” as current factors and “opportunities” and “threats” as future factors.
If an implementing team uses the SWOT analysis to look at the capacity of the organization to act on the issues identified in the initial assessment, some of the key questions to be answered would be:
1. What capacities PMI has today? For instance: number of staff, board members, volunteers, district or sub district, financial capacity, related experiences, its relationships with donors and partners.
2. Is PMI’s surrounding environment (political/economic situation, culture, history, traditions, etc.) favorable to project/program implementation?
3. How could PMI benefit from the project/program for its long-term development (for instance: system improvement, capacity-building component, personnel competency and professionalism)?
4. What are the risks related to the project/program implementation
for the organization (PMI) (i.e. side effects, hidden costs in the short and long term, work load, additional staff, logistics to sustain in the long term, public image/perception, etc.)?
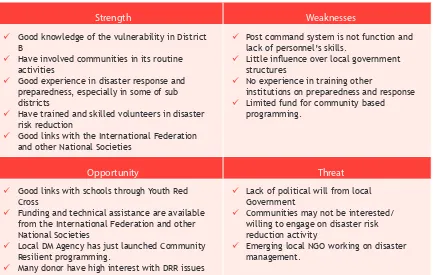
The following Table 3 provides a brief example of a completed SWOT analysis of the PMI District B, reflecting on its capacities in relation to the disaster risks reduction identified in an initial assessment report.
Table 3.
Example of a SWOT Analysis of PMI District B
Strength Weaknesses
ü Good knowledge of the vulnerability in District B
ü Have involved communities in its routine activities
ü Good experience in disaster response and preparedness, especially in some of sub districts
ü Have trained and skilled volunteers in disaster risk reduction
ü Good links with the International Federation and other National Societies
ü Post command system is not function and lack of personnel’s skills.
ü Little influence over local government
structures
ü No experience in training other
institutions on preparedness and response
ü Limited fund for community based programming.
Opportunity Threat
ü Good links with schools through Youth Red Cross
ü Funding and technical assistance are available from the International Federation and other National Societies
ü Local DM Agency has just launched Community Resilient programming.
ü Many donor have high interest with DRR issues
ü Lack of political will from local Government
ü Communities may not be interested/ willing to engage on disaster risk reduction activity
Steps to conduct organizational SWOT analysis
1. Discuss: “What are the strengths and weaknesses within the PMI that could affect the problems we seek to address?”
2. Discuss: “What are the opportunities and threats outside the organization that could affect the problems we seek to address?”
3. Record the answers in the SWOT analysis matrix.
4. Discuss: “What do these results tell us?”, “What decisions should we take?” and “Are we ready to proceed? If so, what needs to be done first? If not, what needs to be done before we can proceed?”
2.2.3. Stakeholder Analysis
A “stakeholder” in this context is a person or group of people who have an interest in the project/program that is being planned. Stakeholder analysis is a technique used to identify and assess the interests of the people, groups or institutions who may significantly influence the project/ program’s success.
The overall aim of stakeholder analysis is to ensure that the project/program takes place in the best possible conditions, by aligning it realistically with the needs and capacities of the stakeholders and their resources. Therefore, the stakeholder analysis ideally would be carried out in a participatory session with PMI staff, volunteers, board members, and representatives of potential stakeholder groups such as related local government officials, including the beneficiaries.
One way to conduct this analysis is by drawing up a comparative table. First,
the stakeholders must be identified. In the example given in Table 3, the stakeholders are categorized as follows:
a. Institutions that will potentially be involved in the project/program, such as Participating National Society, IFRC, United Nations agencies, government ministries, etc.
b. Target groups, for example vulnerable groups or potential beneficiaries,
such as mothers, schools students, teenage and PMI volunteers.
Second, the problems, interests, needs, potential, interaction and other relevant factors are identified and analyzed for each stakeholder. Below is the detail explanation.
a. Problems: What are the key problems identified in the assessment and affecting the stakeholder in question? For instance, how is the high vulnerability of the community will affect the Local DM Agency? If the vulnerability to disaster is increase, Local DM Agency will definitely have larger responsibilities to improve the community resilience.
b. Interests: What motivates the stakeholder group? For example, the Local DM Agency has high motivation to roll out its tasks and responsibilities in order show its institutional performance.
c. Potential: How can the stakeholder group contribute to resolving the issues identified? Their potential could be strong capacity, knowledge, high level of commitment, voluntarism, idealism, free time, etc. For example, the Local DM Agency may have more funds for DRR programming, it may have well-functioning disaster command post, and good infrastructures.
d. Interaction: How can the implementing team relate to this group?
Which channels of communication can be used? For instance, PMI could communicate or coordinate with the Local DM Agency through coordination meeting, regular reporting, emergency response report.
e. Others’ actions: Is any other association, organization, group, etc. already implementing a project/program or action that targets the selected group? If so, identify them and their actions to avoid any overlap, as well as to establish the basis for a possible collaboration and to save effort and resources. For example, Education District Office may release and promote DRR curricula for school.
Ideally, the whole exercise would be carried out in a participatory session with representatives of potential stakeholder groups, including potential beneficiaries, PMI staff and volunteers, and government officials. The effective use of participatory planning methods and group facilitation tools can help ensure that the views and perspectives of different stakeholder groups are adequately represented and understood.
PMI should be able to recognize its strength and
weakness and at the same time are fully aware of
Table 4.
Example of Stakeholder Analysis Matrix
Factors Community
leaders Women groups Schools Students Local DM Agency
Problems
Have some responsibility to ensure the safety of the community
Lack of information and skill in disaster preparedness
Want to ensure safer community
Also work with the local NGO “Disaster
Individually we are one drop, together we are an ocean.
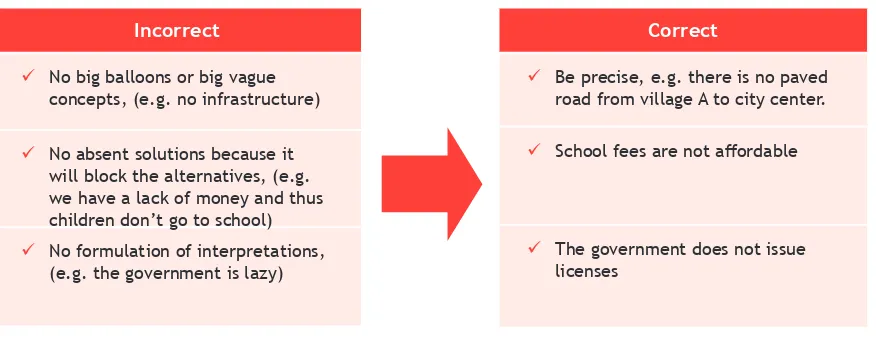
2.2.4. Problem Analysis (using Problem Tree)
A “problem” is defined here as “an unsatisfactory situation that may be difficult to cope with”. Problem analysis is a critical stage of project/ program planning, as it guides all subsequent analysis and decision-making on priorities.
Problem analysis can be defined as the thorough study of one or more problems (identified during the initial assessment stage), to identify their causes. Through problem analysis, team could understand the issues and identify alternatives solutions to addressed them, or in short to decide
whether and how to tackle them.
Merely listing and ranking problems does not provide for a sufficiently deep analysis of the situation. The aim of problem analysis is to structure, summarize and organize the initial findings of an assessment in order to arrive at a clearer understanding of the situation under analysis. It involves identifying the negative aspects of an existing situation (i.e. “problems”) and then identifying the immediate and underlying causes. By identifying the causes of a problem, it is possible to start to identify possible solutions that will address the problem.
A variety of tools can be used to support problem analysis. One commonly used tool is the “problem tree”. This visual method uses the analogy of a tree to facilitate the analysis of the problem(s). The exercise produces a summary picture of the existing negative situation, for example with the main problem as the “trunk”, the causes of the problem as the “roots” and the effects of the problem as the “branches”.