Jurnal Bina Praja 9 (2) (2017): 281 - 293
Jurnal Bina Praja
e-ISSN: 2503-3360 p-ISSN: 2085-4323 http://binaprajajournal.com
Capital Investment Behavior of Local Government
in Regional Development Bank (BPD) in Indonesia
M. Yusuf
1, *, Sri Hartoyo
2, Adler H. Manurung
3, Yuswandi A. Temenggung
41, 2 School of Business IPB
Gedung SB-IPB, Kampus IPB Gunung Gede, Jalan Raya Pajajaran, Bogor Utara, Bantarjati, Kota Bogor, Jawa Barat 16151, Indonesia
3 BINUS University
Jl. K. H. Syahdan No. 9, Kemanggisan, Palmerah, Jakarta 11480 Indonesia 4 Ministry of Home Affairs of the Republic of Indonesia
Jl. Medan Merdeka Utara No. 7, Jakarta Pusat
Received: 11 September 2017; Accepted: 23 October 2017; Published online: 28 November 2017
DOI: 10.21787/jbp.09.2017.281-293
Abstract
Capital investment of local government or long-term regional investment is a form of government program and one
of the tools of regulating the regional fiscal. Local government investment in the form of direct investment is the capital
investment in business entities which aims to increase regional economic growth, increase regional income, and improve the welfare of the community. Regional capital investment is a decision-making behavior to invest or not to invest in busi-ness entities to obtain dividends. The behavior of decision making requires Information on bank performance, knowl-edge of banking governance, and shareholder agreements with bank directors. This study aims to analyze performance
behavior and investment of provincial government that affects the profit of regional development banks in Indonesia. The method of analysis is done using descriptive statistic and multiple linear regression. Multiple Linear Regression with dependent variable of regional development bank profit and independent variable consist of Bank size (SIZE), business risk of BPD bank (RISK_Bt), Capital Adequancy Ratio (CAR), Operational Cost to Operating Income (BOPO), Return of Equity (ROE), Interest Rate of Bank (INTEREST), Provincial Capital Investment to Bank BPD (PMD), Regional Minimum Wage (UMR), Initial Public Offering Dummy (DIPO), and Bank Business Target Dummy (DSARBISB). The result
of descriptive statistic analysis concluded that the capital investment of 26 provincial governments in 26 regional devel-opment banks describes the varying bank performance caused by different bank sizes. The results of multiple regression
analysis can conclude that all independent variables are able to both explain the dependent variable at a significant level of level below 1%, as well as individually ten independent variables that are statistically significantly different with zero
at levels below 1%, below 5%, and below 10%.
Keywords: Local Capital Investment, Regional Development Bank, Local Government, Local Investment
I. Introduction
Local government capital investment in
business entities becomes an interesting topic
discussed in the regional financial management
model in Indonesia. The investment of local capital
according to the mandate of Law Number 23 of 2014 can be conducted on Regional Owned Enterprises (BUMD) or State-Owned Enterprises (SOEs) that aims to provide benefits for the development of
regional economy in general, organizing general
benefits in the form of provision of goods and/or
quality services for the fulfillment of the livelihood
of the community according to the conditions, characteristics, and potential of the region concerned based on good corporate governance and
to obtain profit.
Capital investment is a form of local government investment in business entities. Investment decision-making in this case is that capital
investment, as part of public finance management,
risks such as tunneling risks, strategy of transfer pricing, liquidity risk, discontinuity risk, credit risk, regulatory risk, and tax risk, the risk of improper
dividend returns, disinformative past financial
performance reports that predict the future based
on accounting ratios (Claessens, Fan, Djankov, & Lang, 1999; Deo & Sundar, 2015; La Porta, Lopez-de-Silanes, Shleifer, & Vishny, 2000; Li & Miu, 2010; Lo, Wong, & Firth, 2010).
Regional capital investment is a behavior for decision maker of long-term investment allocation of region to business entities to get dividends. The
behavior of decision makers is influenced by various
information, investment knowledge, feelings, inputs from analysts or third-party views, experience,
financial and economic understanding (Jaiyeoba & Haron, 2016). This can be seen in investors who
will make an investment in the form of shares in the capital market. They, in decision-making, are based on investment information on shares to be purchased. The same may apply to decision making of local government capital investment in BPD Bank,
either to get dividends or to get influence in bank
BPD management. Decision-making can be based on feelings, can also be based on data analysis from various parties.
Local capital investment is one of the interesting regional fiscal instruments to be analyzed in
relation to regional rights and obligations in the framework of local government through the
Regional Budget (APBD). During 2010-2015, the
average capital accumulation of 26 provinces in regional development banks were amounted to
IDR17,124.1 billion aimed at economic benefits of
the community, the provision of goods/services,
and for profit.
Ahmad & Wajid (2013) and Romer (2006)
explain that the decrease in unemployment,
controlled inflation, increased public welfare, and economic growth are targeted by regional fiscal policies. Many variables to achieve these benefits,
including targeted regional spending as well as
regional financing that gave rise to multiplier effects
such as the investment of local government capital
in the Business Entity.
Capital investment is an investment of local government in business entities which certainly has risks from the local government side, return risk, legal risk due to responsibility of a policy, and other uncontrollable risks such as credit risk,
dividend return risk, and financial report which is not informative (Al-Subhiri, 2013; Deo & Sundar, 2015; Kun & Duo, 2014).
Capital investment can be done well when the
bureaucracy as the dominant actor influences the
government's policy to provide capital investment
to Business Entities. Bureaucratic views are
generally the same as the community in doing the
capital investment to improve the welfare and progress of the region. Capital investment is made
to obtain dividends or influence on the company, such influence as a local government or community
welfare facility.
The interaction between the giver of capital, that is the local government, with the recipient of capital, that is the regional-owned bank or regional enterprise, creates rights and obligations for both parties. These rights and obligations resulted in separation of local corporate governance apart from
the local governance as described in Law No. 1 of
2004, that regional enterprise as separated assets. The principle of separation in the management context raises the interests of the principal and the
interests of the manager (agent) carried out by contractual mechanisms (Jensen & Meckling, 1976; Ross, 1973). The bureaucracy that is authorized
to determine the determination of the magnitude of local capital investment is strongly concerned with strong and healthy regional companies, while managers are very concerned that the managed companies have the reputation, professionalism, and trust of the owners and the community.
Human Resource Management as told by
Ulrich (2012) in Triyonggo, Maarif, Sukmawati, & Baga (2015) must be able to be a credible activist
when all recommendations submitted must be accountable and acting actively in mastering aspects of understanding the business of the company/ organization.
The provincial government according to the data of the Ministry of Home Affairs of the Republic of Indonesia in 2017 amounted to 34. This study only examined 26 provinces and 26 BPD Banks because the realization of APBD data available during 2010-2015 in parallel with the performance data of BPD banks are found in 26 provincial governments. Data on realization of APBD 2010 to 2015 as a form of realization of revenue performance, realization of spending performance, and realization of provincial
government financing performance are as illustrated
in Table 1.
The investment theory had begun before the 20th century by William in 1930, then Markowitz
(1952) began. The choice of investments in
portopolio, a combination of many money-processed assets provided to allocate to diverse asset groups,
can be both real assets and financial assets (Bodie, Kane, & Marcus, 2010).
The investment of local government capital is a form of regional investment that is conducted
directly or indirectly. Local government investment
social and/or other benefits in a certain period of
time as described in the Regulation of the Minister of Home Affairs of the Republic of Indonesia Number 52 of 2012.
Direct investment is in the form of capital investment in assets that are separated from the
management of fixed assets and current assets as described in Law Number 1 of 2004. The assets
are separated in the form of Regional Owned
Enterprises. Pappalardo (1987) explains that the benefits of direct investment is to gain a decisive influence in the execution of a business and want to profit from the invested capital.
The influence of the global environment,
especially with regards to the withdrawal of foreign investment, is crucial for the role of the APBN/ APBD in encouraging faster economic growth,
increasing significant added value, accelerating
government services, the creation of new cultures, then incentives and disincentives need to be given
to successful bureaucratic officials and fail to realize new behaviors that fit with the new culture, this is as described by Polimpung (2014).
Previous researches have been conducted in relation to local investment, such as research
conducted by Waymire & Cefaratti (2014) on bond
market of companies and regional bond market with method of probit regression analysis with
the result of one of them is operational profit does not show significant relation with bank issuer of bond commercial, then, Coronado, Engen, & Knight (2003) stated that investment in capital markets is
affected by political decisions.
Furthermore, Mzee & Mohamed (2014) stated that to determine the cost efficiency, profit and behavior of management at Commercial Bank (Case study in Tanzania) with multiple linear regression
method. The result of this study concludes that commercial banks in Tanzania are relatively more
profit efficient than cost. Domestic banks cost more efficiently while foreign banks are more profitable.
This research is different from previous
research conducted by Mzee & Mohamed (2014) and Waymire & Cefaratti (2014). This research is
related to local government's direct investment in the form of capital investment to BPD Bank, while the equation lies in the grand theory that is related to investment. The novelty of this research lies in the method, object, and location of research.
The purpose of this research is to analyze
the influence of performance behavior, bank size,
regional minimum wage, and provincial government
capital investment to profit of regional development
bank in Indonesia.
II. Method
This research is conducted in Indonesia by
analyzing the financial statements of 26 provincial
governments from 34 provincial governments
and 26 Regional Development Banks (BPD) from
27 existing BPD Banks. Twenty-six BPD Banks represent the population of BPD Bank and 26 samples of Provincial Government with periods between 2010 and 2015. The election of 26 local development banks and samples is based on the considerations of the researchers as described by
(Zikmund, Babin, Carr, & Griffin, 2009).
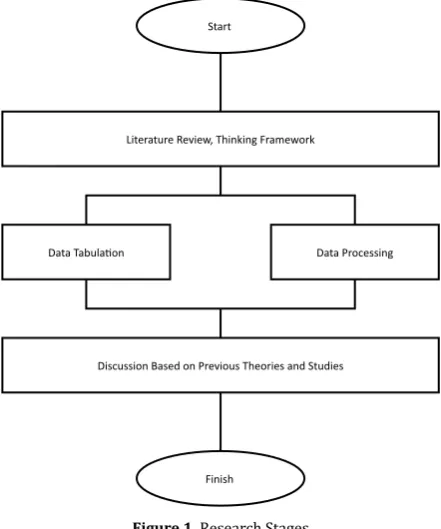
The research design is described in Figure
1 with several stages of research starting from literature study and data collection of local
government financial report and financial report of
Regional Development Bank, either directly from the Bank website or audit result of Supreme Audit
Board (BPK) for Local Government Financial Report.
The analytical tool used is descriptive statistics
to describe the composition of finance and capital
investment of the provincial government at the Regional Development Bank and the composition of
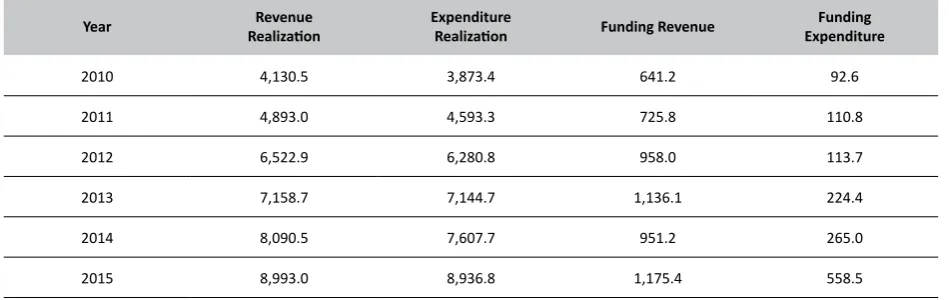
Table 1.
Average Realization of Local Budget (APBD) in 26 Provinces in 2010-2015 (in Billion Rupiah)
Year RealizationRevenue Expenditure Realization Funding Revenue Funding Expenditure
2010 4,130.5 3,873.4 641.2 92.6
2011 4,893.0 4,593.3 725.8 110.8
2012 6,522.9 6,280.8 958.0 113.7
2013 7,158.7 7,144.7 1,136.1 224.4
2014 8,090.5 7,607.7 951.2 265.0
2015 8,993.0 8,936.8 1,175.4 558.5
capital ownership of the District/City Government and others.
The results of data processing are presented in the form of descriptive statistics and multiple linear regression with the dependent variable of Bank
profit and independent variables consisting of bank
performance, bank size, and capital investment. The independent variables can also be called factors
that influence the profit of BPD bank, namely bank size (SIZE), bank's business risk (RISK_Bt), CAR, BOPO, ROE, bank interest of prevailing BPD (INTEREST), provincial capital investment (PMD), regional minimum wage (UMR), bank dummy that has an initial public offering (DIPO) and BPD Bank business target dummy (DSARBISB) in consumer
sector or productive sector. Productive sector if 51% and above, the credit distribution is to productive sector. The regression model framework illustration
is shown in Figure 2.
Based on the conceptual framework, the profit
performance of the Regional Development Bank in the period 2010 to 2015 is measured by the following multiple regressions:
i ,t
BANKit 0 1 i ,t 2 B 3 i ,t 4 i ,t 5 i ,t
6 P,t 7 P,t 8 P,t 9 P,t
10 P,t i ,t
PROFIT SIZE RISK
CAR BOPO ROE
BUNGA PMD
UMR DIPO
DSARBISB
= δ + δ + δ
+δ + δ + δ
+δ + δ
+δ + δ
+δ + ξ
In which:
PROFIT = BPD Bank Profit Amount;
SIZE = Bank Size;
RISK_Bt = Bank Business Risk;
CAR = The level of bank capital adequacy;
BOPO = Operational cost compared to
operational revenue;
ROE = Return of equity;
INTEREST = Bank interest rates apply;
PMD = Local capital investment;
UMR = Regional minimum wage;
DIPO = IPO bank dummy;
DSARBISB = Bank business target dummy (if
1 then bank business target is 51% to productive sector and 0 to
consumptive sector);
i = BPD Bank Name
t = t year
δ = Regression coefficient
with hypothesis as follows:
δ0; δ1; δ2; δ3>0; δ4<0; δ5; δ6; δ7>0; δ8<0; δ9; δ10 ;δ11>0
DIPO as a code for banks that have recorded their shares in Indonesia capital market or initial
public offering (IPO) in this case is Jabar-Banten
Bank and Jatim Bank. The code is to measure the difference between an already IPO bank and not yet IPO Bank. Dummy 1 is for banks that are already IPO and 0 for banks that are not yet IPO.
DSARBISB is a code to measure the quality
of bank business as defined in Law Number 23 of
2014, Government Regulation of the Republic of Indonesia Number 1 of 2008, and Regulation of the Minister of Home Affairs of the Republic of Indonesia Number 52 of 2012 Regarding Guidelines for the Management of Investments Regional Government stating that the purpose of the establishment of a
regional-owned business entity is for the benefit of
regional economics, goods and services, and to gain
profit. DSARBISB Code measures business targets of
BPD banks as far as the target of credit distribution that can prosper the general public as the purpose of establishing a bank as a regional business entity
is to benefit the local economy. The utilization of the
regional economy as an indicator is the welfare of the community with the size of income per capita. The provider of goods and services, namely local government, as the owner of a business entity is Literature Review, Thinking Framework
Discussion Based on Previous Theories and Studies Data Tabulation
Start
Finish
Data Processing
Figure 1. Research Stages
Dependent Variable: Bank Profit
Independent Variables: SIZE RISK_Bt
CAR BOPO
ROE INTEREST
PMD UMR DIPO DSARBISB
responsible for the fulfillment of the needs of the community in daily life, can be fulfilled in particular
in the less desirable sectors of the private sector, and
seek profit in order to improve the original regional
revenue.
Dummy 1 if the bank is distributing its credit 51% and above on the productive sector and if zero then the credit distribution in the productive sector is below 50%, in other words credit distribution in the consumer sector.
III. Results and Discussion
This research succeeds in collecting data of
annual financial report of provincial government and annual report and also financial report of BPD
Bank in each province for six years from 2010 to 2015 for data on provincial government and data at regional development bank as whole as 312 reports
consisting of 156 provincial government financial reports and 156 annual financial reports/annual
reports of BPD Bank. This six-year data collection is done to match the data period owned by 26 provincial governments and data of 26 BPD Banks.
The lowest capital investment nominal average composition is in Papua at 17.86%, while the highest is in DKI Jakarta at 94.10% followed by the highest in Maluku at 65.99%, Central Java at 64.45%, West Java at 64.48%, Aceh at 63.98%. The four lowest provinces after Papua are Central Sulawesi
at 29.78%, NTT at 32.56, and North Sulawesi at
36.32%. For the province of DKI, the composition is
that there is no capital sourced from District/City, because DKI Jakarta is different from the District/ City in other provinces that are autonomous.
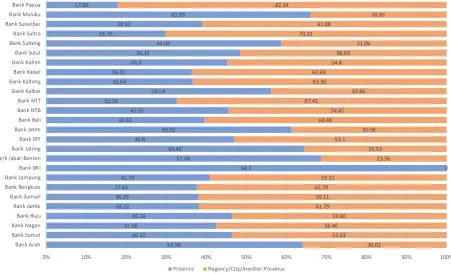
Figure 3 illustrates the average percentage
composition of provincial and district/municipal capital ownership at each BPD. The lowest composition of capital investment is in Papua Province at 17.86% while the highest is in Maluku Province at 20.23% after DKI Jakarta. The composition, in addition to the ownership of the District/City and the provincial expansion, is also owned by the public through the capital market such as the ownership of Jabar-Banten Bank shares by 25% and Jatim Bank by 20%, Bank owned by
other investors are sulut bank (North Sulawesi) and
Central Sulawesi Bank, which shares owned by PT. Mega Corpora.
Horizontally, it can be seen that the difference in the composition of capital investent in each bank varies greatly depending on the policy of each local government in providing capital to BPD, but theoretically, the local government has no limit in the investment amount in BPD Bank.
The composition of ownership of provinces
which control over 50% are five banks, namely
Aceh Bank, DKI Bank, Jabar-Banten Bank, Central Java Bank, Kalbar Bank, and Maluku Bank, while the ownership of the rest is dominated by District/City.
Source: BPD Bank Annual Report
Figure 3. BPD Bank Shares Ownership Average Among Provinces and District/City/Others in 2010-2015 63.98
46.37 41.66
46.34 38.22 36.29 37.61 40.79
94.1 51.44
64.48 46.9
49.02 39.52
45.55 32.56
56.14 36.64
36.31 45.2
36.32 44.04 29.78
38.92
65.99 17.86
36.02 53.63
56.46 53.66 61.79 59.11 62.39 59.21
0 23.56
35.53 53.1
30.98 60.49
54.45 67.41
43.86 63.36
63.69 54.8
38.69 31.06 70.22
61.08
34.01 82.14
0% 10% 20% 30% 40% 50% 60% 70% 80% 90% 100%
Bank Aceh Bank Sumut Bank Nagari Bank Riau Bank Jambi Bank Sumsel Bank Bengkulu Bank Lampung Bank DKI Bank Jabar-Banten Bank Jateng Bank DIY Bank Jatim Bank Bali Bank NTB Bank NTT Bank Kalbar Bank Kalteng Bank Kalsel Bank Kaltim Bank Sulut Bank Sulteng Bank Sultra Bank Sulselbar Bank Maluku Bank Papua
These banks, especially Banks in Java, have more assets than other banks, except for DIY banks, which is still below 50%.
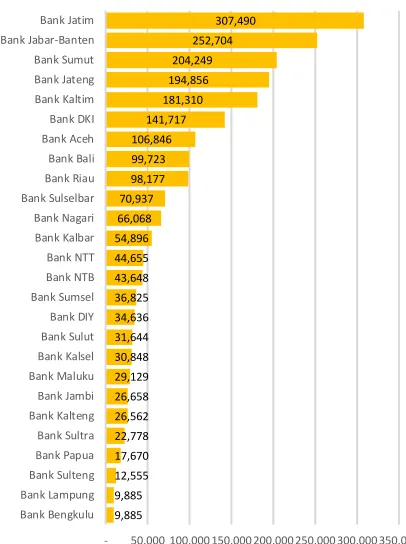
The composition of the average amount of 26 provinces to the total average capital investment of
26 provinces (billions of Rupiah) of 2010-2015 in
BPD. The largest amount of investment made by the provincial government of DKI Jakarta at IDR2,596.7
billion (14%) from the all capital value of 26 Provinces, subsequently West Java, East Java, and
Central Java Provinces respectively IDR2,225.02
billion (12%), East Java IDR1,995.5 billion (11%), and Central Java IDR1,602.4 billion (9%), while the smallest province is Southeast Sulawesi (Southeast Sulawesi) at IDR98.8 billion (1%). In nominal, up to
2015, the total capital investment of 26 Provinces is amounted to IDR53,924.8 billion.
Bank BPD is a bank which capital is owned by the Provincial and District/City Government in Indonesia with different composition, in which several banks are partly owned by the public and
investors as shown in Figure 3. The composition of
capital investment of BPD owned by two provinces, namely South Sulawesi Province and West Sulawesi Province named Sulselbar Bank and Riau Bank, the Capital Investment composition is owned by two provinces namely Riau Province along with its District/City and Riau Islands Province along with
its District/City and Kaltim bank and Kaltara (North Kalimantan) Bank, and Jabar-Banten Bank, and Sulselbargo (West Sulawesi and Gorontalo) Bank.
The amount of ownership, the amount of capital that must be owned by the bank theoretically will be explained in the description of data on bank performance measures in the next sections, because from the bank side there is a need to limit the amount of capital that must be owned by a bank
called CAR (Capital Adequancy Ratio) described in Figure 8 along with the description.
The literature study and composition of capital investment in BPD Bank above have succeeded in capturing the performance data of each BPD Bank as described in following pictures.
The composition of the dividend performance received by the provincial government based on the percentage of total dividend of all BPD Banks during 2010-2015 and the composition of capital
ownership in Figure 3 and Figure 4 that exceeded
IDR2.1 trillion respectively received by the
Government of East Java Province 14%, West Java
Province 12%, Central Province 9%, North Sumatra
9%, East Kalimantan 8%, DKI Jakarta 7% and Aceh
province 5%, while the lowest is in Central Sulawesi, South Kalimantan, and Maluku respectively 1%.
Large dividend receipts such as East Java
and West Java, the BPD Banks have become open companies which shares are partly owned by the
public through the Indonesia Stock Exchange (IDX)
with the status of Initial Public Offering (IPO),
Jabar-Banten bank IPO was registered on July 8, 2010 and Jatim bank IPO was on July 12, 2012. With IPO, it was able to contribute more than the banks that have not listed their shares in the capital market.
Dividends are an important instrument for shareholders in measuring returns and dividends theoretically, and is very popular when paid high to
shareholders as described by Damodaran (2015)
which states that the principle of dividend that requires cash generated to exceed the needs of good projects to be returned to the owner. Dividends are signals and tools of corporate stability assessment by investors, therefore dividend is demanded by investors as a form of pressure to the company
(David, 2010).
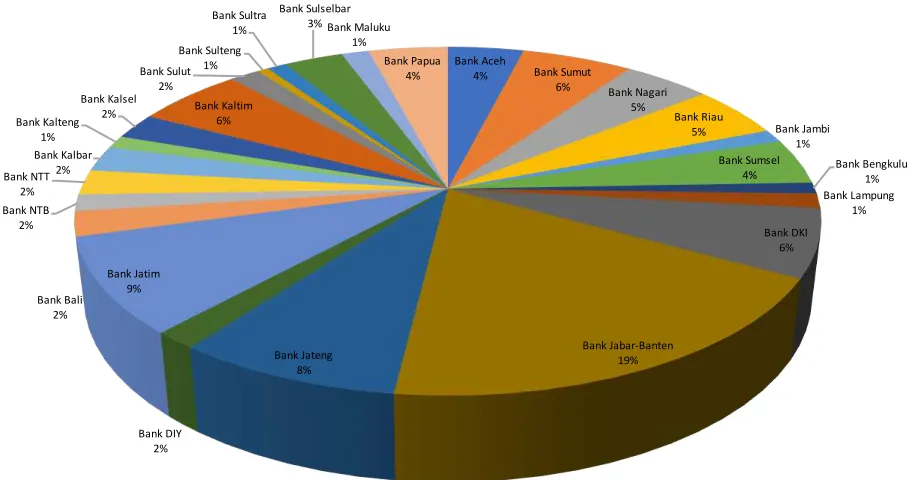
The revenue percentage of BPD Bank in
2010-2015, see Figure 4, during the study period, the banks that can record the biggest profit are Jabar-Banten
Bank and Jatim Bank. Jabar-Banten Bank at IDR1.5
trillion (19%) of total BPD revenue of IDR39 trillion,
while Jatim Bank at IDR1.17 trillion. Other BPD Banks have not recorded their shares on the Stock
Exchange, the earnings are still below IDR1 trillion,
such as Jateng Bank at IDR833 billion, Kaltim Bank at IDR732 billion, Sumut Bank at IDR641 billion, DKI Bank at IDR587 billion, Bali Bank at IDR517 billion, and Aceh Bank at IDR567 billion. BPD Banks
that earn the smallest profit before taxes are Central
Source: Province Financial Report
Figure 4. Average Dividends Composition received by Provincial Government in 2011-2015
9,885
Sulawesi Bank at IDR60 billion and followed by Maluku Bank at IDR115 billion.
Other indicators related to the size of the firm,
measured by the total natural asset logarithm (Ln total assets). Total assets are selected because the
total assets are more stable, and representative
influenced by supply and demand (Margaretha & Ramadhan, 2010).
The data in Figure 6 shows that Jabar-Banten
Bank is the largest bank among other BPD Banks with natural logarithm average number in 2010-2015 at 18.00 followed by the second rank Jatim Bank at 17.23. Both banks are of open bank status.
Other large BPD Banks are Jateng Bank (17.16) followed successively by DKI Bank (17.10), Kaltim Bank (17.01), Sumut Bank (16.80), Riau Bank (16.73), Papua Bank (16.58), Nagari Bank (16.52), Aceh Bank (16.50), Sumsel Bank (16.48), and Bali Bank (16.41). While the other 5 BPD Banks are the Central Sulawesi Bank (14.42), Bengkulu Bank (14.86), Lampung Bank (14.86), Sultra Bank (14.88), and Central Kalimantan Bank (15.14).
Based on these data, can be seen that the four largest banks are banks located in the island of Java, namely Jabar-Banten Bank, Jatim Bank, Jateng Bank, and DKI Jakarta Bank.
The business risk of each BPD Bank company is measured by the average degree of operating
leverage (DOL) during 2010-2015 as shown in Figure 7 respectively. The biggest ones are Lampung
Bank, Bengkulu Bank, Sumsel Bank, and DKI Bank, while the lowest risk is owned by Kalsel Bank, Nagari Bank, Kaltim Bank, and Sulselbar Bank.
While the middle level DOL is North Sumatra Bank,
Source: BPD Annual Report in 2010-2015
Figure 5. The Average Percentage of Income of BPD Bank in 2010-2015 Compared to Total Income of 26 BPD Banks
Bank Aceh
4% Bank Sumut
6% Bank Nagari
5%
Bank Riau
5% Bank Jambi
1% Bank Sumsel
4%
Bank Bengkulu 1% Bank Lampung
1%
Bank DKI 6%
Bank Jabar-Banten 19% Bank Jateng
8%
Bank DIY 2% Bank Jatim
9% Bank Bali
2% Bank NTB
2% Bank NTT
2% Bank Kalbar
2% Bank Kalteng
1%
Bank Kalsel
2% Bank Kaltim
6% Bank Sulut
2%
Bank Sulteng 1%
Bank Sultra 1%
Bank Sulselbar 3% Bank Maluku
1%
Bank Papua 4%
Source: BPD Bank Annual Report in 2010-2015
Figure 6. Company Size (BPD Bank)
14.42 14.86 14.86 14.88 15.14 15.20 15.21 15.27 15.57 15.62 15.74 15.93 15.96 16.00 16.41 16.48 16.50 16.52 16.58 16.73 16.80 17.01 17.10 17.16 17.23 18.00
0.00 5.00 10.00 15.00 20.00
Sultra Bank, Papua Bank, and NTT Bank.
Business risk is a risk borne by the bank due to both internal and external operations of the bank.
External risk due to national and global economic fluctuations will affect the bank operation. On the contrary, the internal risks due to inefficient bank
management and human resource professionalism are not able to predict the national and global economic situation.
Furthermore, the composition of CAR or capital adequacy level, as shown in Figure 8, of the highest position is Sulselbar Bank (32.01), followed by Sulteng bank (25.50), Sultra Bank, (25.03) and Central Kalimantan Bank (24.96). While the lowest CAR is Sumut Bank (14.04) and followed by DKI Bank (14.45), North Sulawesi Bank (14.57), and Sumsel Bank (14.86). While in the middle is occupied by Kalbar Bank (18.46), Aceh Bank (18.57), and South Kalimantan Bank (19.15) and Bengkulu Bank (19.86).
Figure 8 shows that all CAR banks have exceeded
the stipulations set by Bank Indonesia, compared to the size of banks, banks outside of Java are smaller assets, but the CAR is partly above the CAR of banks in Java. This can be taken as an impression that the purpose of local government in placing its capital in banks other than to get dividends, also in order to enlarge the size of the bank.
Large CARs will be able to bear the risks, able to finance operational activities and able to contribute
to profitability. How to raise a CAR can be done by
adding debt or stocks. Stocks are done by selling
on the stock market (capital) or through capital
investment. BPD Bank, which is a bank that has no
debt to other parties, is the easiest to find additional
capital through the investment of local government of District/City or province. This contribution of capital investment has consequences on the liquidity of local budgets, for regions with remaining higher
financing each year will be easier to provide capital
to the Bank.
The composition of operational cost compared
to operating income (BOPO) as shown in Figure 9
is operational cost compared to bank operating
income, the highest average figure is Sulut Bank (82.80), followed by DKI Bank (82,56), Sumsel Bank (81.99), and Jabar-Banten Bank (79.80), then the lowest BOPO are Kalteng Bank (63.77), Jambi Bank (66.06), Bali Bank (66.52), and Sultra Bank (66.95). Meanwhile, the mediocre BOPO figures are Kalbar Bank (73.27), Bengkulu Bank (73.35), Lampung Bank (73.35), and DIY Bank (73.40).
When compared to the size of the bank, the Bank in Java has the largest asset, but the operational cost compared to operating income is also large, this can occur because the control over operating expenses
and operating income has not been done efficiently
or otherwise can occur because of operational costs compared to revenue operation is small because the
0.59
0.00 1.00 2.00 3.00 4.00 5.00
Bank Kalsel
Source: BPD Bank Annual Report 2010-2015
Figure 7. Company Risk Composition (BPD Bank)
14.04
0.00 5.00 10.00 15.00 20.00 25.00 30.00 35.00 Bank Sumut
Source: BPD Bank Annual Report 2010-2015
Figure 8. CAR (Capital Adequacy Ratio) Average
bank intermediation is not maximized.
If BOPO is compared to risk, large BOPO does not necessarily have a greater risk. BOPO bank in Java Island, especially for three banks, DKI Bank and Jabar-Banten Bank, the risk is smaller than that
of Lampung Bank, Bengkulu Bank, and BOPO Bank
which is smaller compared to DKI Bank and Jabar-Banten Bank, except Bank Sumsel, which risk is in third and BOPO is also in third. Thus, the problem occurs in the management of banks that must be
more efficient.
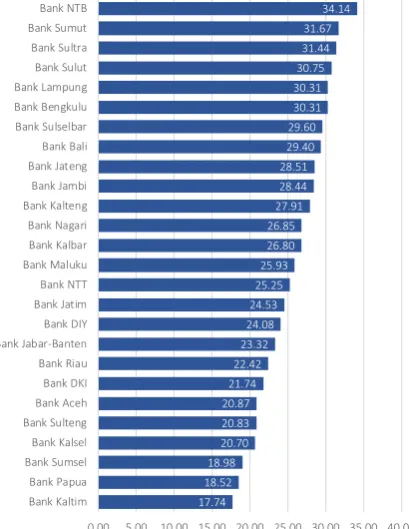
The composition of ROE is the ratio between income and equity (Return of Equity). The highest number is owned by Sumut Bank (31.67), followed by Sultra Bank (31.44), and Sulut Bank (30.75). While the lowest number is Kaltim bank (17.74), Papua Bank (18.52), Sumsel Bank (18.98), South Kalimantan Bank (20.70). Banks which value are in the middle is NTT Bank (25.25) and Maluku Bank (25.93).
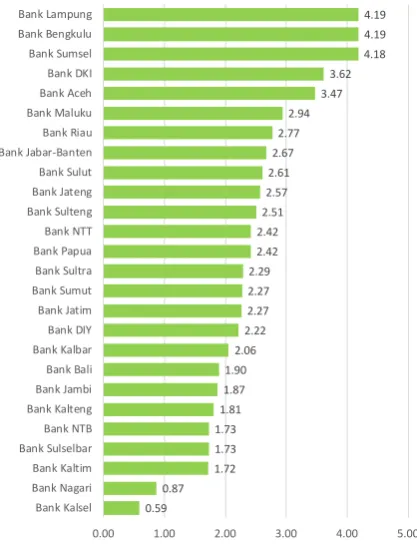
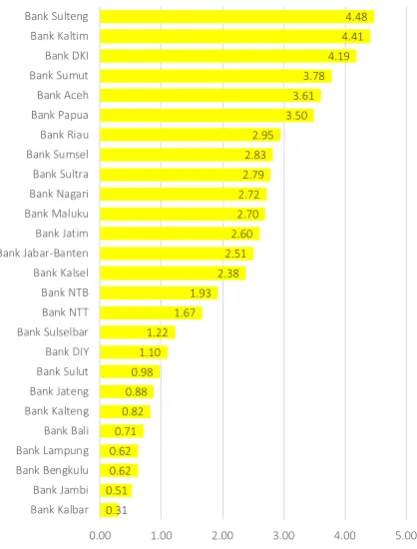
NPL (Non-Performing Loan) is the ratio of
capital adequacy rate commonly used to assess bank liquidity to third-party funds can be seen
in Figure 11. The composition of NPL of BPD
Bank's lowest average on 2010-2015 is located in
Kalbar Bank (0.31) followed by Jambi Bank (0.51), Bengkulu Bank (0.62), while the highest NPL is in Central Sulawesi Bank (4.48) followed by Kaltim Bank (4.41) and DKI Bank (4.19). The middle NPL is NTB Bank (1.93) and South Kalimantan Bank
(2.38) of several other BPD banks which numbers
are approaching.
The composition of data as described above shows that BPD banks in managing their management need to measure performance to be
more efficient. Likewise, an investor in investing
must measure the performance of the company in which will be invested capital in the form of equity. Investors are risk aversion because in each investment results in a risk of the asset and
multifactor risk (Bodie et al., 2010).
The analysis of the average performance of 26 BPD Banks with the composition of the weighted data of each bank provides the fact that the investment of local government capital at BPD Banks varies in amount compared with the realization of regional income during the study period. In Maluku Province, the weight of capital investment in BPD Bank has the largest share of 20.23 while the smallest portion
is in Papua Province (2.76). This is done based on
Government Regulation of the Republic of Indonesia Number 1 of 2008 and Regulation of the Minister of Home Affairs of the Republic of Indonesia Number 52 of 2012 stating that the Regional Government has the authority to invest some funds in the form of investment of securities and direct investment in the form of capital investment in business entities.
The composition of capital investment of 26 provincial governments in BPD Bank in general, the largest nominal value of a capital investment to BPD 63.77
0.00 20.00 40.00 60.00 80.00 100.00
Bank Kalteng
Source: BPD Bank Annual Report 2010-2015
Figure 9. BPD Bank Average BOPO Composition
17.74
0.00 5.00 10.00 15.00 20.00 25.00 30.00 35.00 40.00 Bank Kaltim
Source: BPD Bank Annual Report 2010-2015
Bank is about 14% by DKI province compared to other provinces. Then, West Java with an average of
12%, East Java with an average of 11%, and Central
Java with an average of 9% of the total provincial capital investment, which is in nominal IDR53,924.8 billion.
Ownership composition will determine the amount of dividend to be received every year by the
local government as can be seen in figure 4. A number
of dividends received by the provincial government of the total dividend are the accumulation of total dividends distributed by 26 BPD banks. The spirit of local investment for local government, in addition to the existence of programs that should be empowered
local companies, as well as the purpose to gain profit in the future (Mahmudi, Hardani, & Sallama, 2010). The profit can be in the form of dividends or yields,
asset security, and optimization of cash management
and maintenance of financial liquidity. The amount of dividend received depends on the profit and the
amount of the bank such as Jabar-Banten Bank, although the composition of capital investment is only 12% with the capital investment nominal of IDR2.2 trillion from the realization of regional income and the portion of ownership composition of 38.26% below 50%, while the dividend received is IDR247 billion, compared to the total capital investment of DKI Provincial Government in DKI Bank amounting to 14% of the total of all provincial government and capital investment of IDR2.6 trillion
and ownership composition of 91.20% above 50% but the dividend income is IDR158 billion. The size of dividend receipts is highly dependent on the
profit and size of banks in managing their finances.
In West Java Province, although the composition of capital investment is smaller, the size of the bank
(company) is greater than DKI Bank with a ratio of 18.00:17.10 (see Figure 6).
The arrangement of bank earnings result is regulated based on the accounting policies of each bank such as dividends to shareholders, for reserve funds, for welfare funds, for tantiem funds, and production services.
For an investor to get a reasonable dividend, it
is necessary to have a precise calculation relating to
the health of the bank in predicting the benefits to
be gained. Thus, bank health indicators need to be studied.
The bank's health indicators, in this case BPD, are not all the same, but in reality, all BPD Banks have no debt to other parties to invest as capital structure
theory (Donaldson, 1961; Durand, 1959; Myers, 1984) ratio (DER) does not need to be measured,
the composition of BPD debt can be ignored to be measured.
Other bank health indicators that need to be
measured are related to CAMEL (Capital Quality, Management, Earning and Liquidity) as described by Mirdhani & Budiyanto (2014). In this paper
Capital quality measured is represented by CAR,
management is measured by the amount of profit
earned by the bank, earnings are measured by
return on equity (ROE), and liquidity is measured
by BOPO.
CAR that must be owned by a bank, according to Bank Indonesia Regulation Number 15/12/ PBI/2013 concerning the Minimum Capital Requirement for Commercial Banks that the Capital
Adequacy Ratio (CAR) for a bank is at least:
1. 8% from Weighted Assets by Risk (ATMR) for
bank with risk profile ranked 1st (first),
2. 9% to less than 10% from ATMR to bank with
risk profile ranked 2nd (second)
3. 10% to 11% dari ATMR from ATMR to bank
with risk profile ranked 3rd (third); or
4. 11% to 14% from ATMR to bank with risk
profile ranked 4th (fourth)
The CAR on 26 BPD Banks is already above 14%. Another health indicator is BOPO to measure
the level of efficiency and ability of banks in
conducting its operational activities. The highest BOPO is in Sulut Bank with an average of 82.80 which means that the operational cost is close to the operational income so that the business risk in this bank is higher than other BPD Banks, DKI Bank is 82.56, Sumsel Bank is 81.99 and Jabar- Banten Bank is 79.80.
There are still BPD banks with BOPO under 70,
0.31
0.00 1.00 2.00 3.00 4.00 5.00 Bank Kalbar
Source: BPD Bank Annual Report 2010-2015
amounting to 9 units, namely Kaltim Bank, Sulteng Bank, Sulselbar Bank, Jatim Bank, NTB Bank, Sultra
Bank, Bali Bank, Jambi Bank, and Kalteng Bank. ROE
indicator is a tool to show how far the company that
manages its own capital to benefit from investments
that have been made by the owners of capital or
shareholders of the company (Bodie et al., 2010). According to the data, the highest ROE is North
Sumatra Bank and North Sulawesi Bank.
The NPL indicator, the return of
non-performing loans is one of the key indicators to assess bank performance. Bank is an intermediary institution or liaison between investors or people with excess and with people who need funds. According to Bank Indonesia Regulation Number 17/11/PBI/2015, the ratio of non-performing loans of total credit is the ratio between total loans quality that are deemed substandard, doubtful, and loss to
total loans that must meet the NPL ratio of total gross (gross) less than 5% (five percent). According to data in Figure 12, the highest NPL ratio is owned
by Sumsel Bank with an average of 6.10, Kaltim bank with 5.49, while for all other BPD Banks, all are already under 5%. Therefore, Banks with problem loans that violate Bank Indonesia regulations are Sumsel Bank and Kaltim Bank.
How the influence of each variable so that the bank profit becomes a measuring instrument that
is interconnected with each variable performance
is done with multiple linear regression acquiring
R2 of 90.60% with this model Prob F <.0001, with
this model variation of the dependent variable can be explained well by all variable predictors; and
statistically significant below 1%. So, the model can
be used as a predictor of bank earnings behavior, the estimation result of each independent variable to earnings dependent variable can be seen in Table 1.
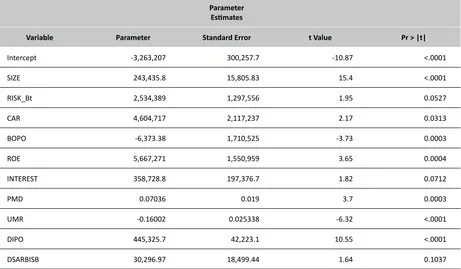
Based on Table 2, the probability of t distribution is generally below 1%, below 5%, and below 10%. Thus, the estimation of all independent
variables is positively and significantly influenced to bank earnings, namely Bank size (SIZE), Bank business risk (RISK_Bt), CAR, ROE, FLOWER, PMD,
DIPO and DSARBISB, except BOPO and UMR that are
affected negatively and significantly to the bank's profit.
Interpretation of individual estimation using
multiple regression as explained by Sitepu & Sinaga (2006) tested the validity of model with base on R2 equal to 90.5% F Statistic equal to 137.31 and Probability F equal <.001, that built model can be
made to make estimation. Paramater estimation to
increase bank size (SIZE) 1% have positive effect to BPD bank profit of IDR243,435.8, increase of
bank business risk 1% have positive effect to BPD
bank profit that equals to IDR2,534,389, increase of CAR by 1% hence will increase profit equal to IDR4,604,717, a 1% increase in ROE will increase Table 2.
Regression Results Factors which affects the Earnings of BPD Bank in 2010-2015
Parameter
Estimates
Variable Parameter Standard Error t Value Pr > |t|
Intercept -3,263,207 300,257.7 -10.87 <.0001
SIZE 243,435.8 15,805.83 15.4 <.0001
RISK_Bt 2,534,389 1,297,556 1.95 0.0527
CAR 4,604,717 2,117,237 2.17 0.0313
BOPO -6,373.38 1,710,525 -3.73 0.0003
ROE 5,667,271 1,550,959 3.65 0.0004
INTEREST 358,728.8 197,376.7 1.82 0.0712
PMD 0.07036 0.019 3.7 0.0003
UMR -0.16002 0.025338 -6.32 <.0001
DIPO 445,325.7 42,223.1 10.55 <.0001
DSARBISB 30,296.97 18,499.44 1.64 0.1037
the profit of IDR5,667,271, the increase of bank interest 1 basis point will increase the profit of
IDR358,728.8, the increase of capital investment
of IDR1 will increase profit of IDR0.07036. Furthermore, the increase of BOPO IDR1 will decrease the bank's profit by IDR6,373.38, and the
increase the regional minimum wage of IDR1 will
decrease the bank profit by IDR0.16002, besides if
BPD Bank has conducted IPO in capital market, it
also has a positive effect to the profit as well as Bank
business target has a positive impact on BPD bank's
profit if its target is to productive business.
IV. Conclusion
The capital investment of 26 provincial governments in 26 regional development banks describes that the bank's performance is varied due to the size of the bank as measured by the total
asset logarithm. The large positive influence of the independent variable on the profit of BPD Bank as shown in Table 1 indicates that bank profit is highly
dependent on variable of factors affecting earnings,
namely bank size (SIZE), risk (RISK_Bt), capital adequacy ratio (CAR), operational cost compared to operating income (BOPO), return of (ROE), bank interest rate (INTEREST), local capital investment (PMD), regional minimum wage (UMR), Initial public Offering (IPO) dummy, bank business target (DSARBISB) dummy.
Those affecting factors, economically if the BOPO and UMR are raised or increased, then the bank's earnings will decrease. Otherwise, if lowered
then the bank profit will be better. Other factors
that are entirely positive if raised or increased,
then the bank's profit will increase. The increase of bank profits then causes an expectation that the
provincial government will increase dividends. The capital investment of regional banks in order to increase local revenue, however, by looking at regional economic developments, every capital investment should be associated with regional economic growth as well as the provision of goods/ services for the community, thus the performance indicators of banks need to be a concern when going to capital investment such as CAR, BOPO,
and NPL as well as general indicators of companies such as profit, business risk, ROE, ROA, and even
bank business target need to be the attention
of the owners of capital. Local governments,
both provincial and district/city in doing capital investment should be more focused on the welfare of the community. This is in accordance with the
positive DSARBISB dummy coefficient if the bank business target to productivity sector rose (above 51%) then the bank's profit increased.
Acknowledgement
We thank our colleagues for who provided insight and expertise that greatly assisted the research, although they may not agree with all of the interpretations/conclusions of this paper.
We would also like to show our gratitude to the Business school Bogor Agricultural University for sharing their pearls of wisdom with us during the course of this research. We are also immensely grateful to the reviewer of Jurnal Bina Praja for their comments on an earlier version of the manuscript, although any errors are our own and should not tarnish the reputations of these esteemed persons.
V. References
Ahmad, K., & Wajid, S. (2013). What Matters for Economic Growth in Pakistan: Fiscal Policy
or Its Composition? Asian Economic and Financial Review, 3(2), 196–215. Retrieved from http://www.aessweb.com/journals/
February2013/5002/1771
Al-Subhiri, F. N. (2013). Analysis the Relationship Between Liquidity, Credit Risk and Market Value in Commercial Jordanian Banking. International Journal of Academic Research, 5(5), 109–113.
Bank Indonesia Regulation Number 15/12/ PBI/2013 concerning the Minimum Capital
Requirement for Commercial Banks, Pub. L. No. 15 (2013). Indonesia.
Bank Indonesia Regulation Number 17/11/ PBI/2015 Concerning Amendment to Bank Indonesia Regulation Number 15/15/ PBI/2013 Concerning Reserves of Banks in
Rupiah and Foreign Currency for Commercial Banks, Pub. L. No. 17 (2015). Indonesia. Bodie, Z., Kane, A., & Marcus, A. J. (2010). Investments
(9th ed.). McGraw-Hill/Irwin.
Claessens, S., Fan, J. P. H., Djankov, S., & Lang, L. H. P. (1999). Expropriation of Minority Shareholders: Evidence from East Asia (Policy Research Working Paper No. WPS2088). Retrieved from
http://documents.worldbank.org/curated/
en/283121468771272365/Expropriation-of-
minority-shareholders-evidence-from-East-Asia
Coronado, J. L., Engen, E. M., & Knight, B. (2003). Public Funds and Private Capital Markets: The
Investment Practices and Performance of State
and Local Pension Funds. National Tax Journal,
56(3), 579–594. Retrieved from http://www.
jstor.org/stable/41790124
Damodaran, A. (2015). Applied Corporate Finance
(4th ed.). Wiley.
David, I. Ben. (2010). Dividend Policy Decisions. In H. K. Baker & J. R. Nofsinger (Eds.), Behavioral Finance: Investors, Corporations, and Markets.
http://doi.org/10.1002/9781118258415. ch23
Deo, M., & Sundar, V. (2015). Gender Difference:
Investment Behavior and Risk Taking. SCMS Journal of Indian Management, 74–81. Retrieved from https://www.scms.edu.in/
journal/article?journal_id=17
Donaldson, G. (1961). Corporate Debt Capacity:
A Study of Corporate Debt Policy and the Determination of Corporate Debt Capacity (Reprinted). Washington, D.C.: Beard Books. Durand, D. (1959). The Cost of Capital, Corporation
Finance, and the Theory of Investment:
Comment. The American Economic Review,
49(4), 639–655. Retrieved from http://www.
jstor.org/stable/1812918
Government Regulation of the Republic of Indonesia Number 1 of 2008 on Government Investment,
Pub. L. No. 1 (2008). Indonesia.
Jaiyeoba, H. B., & Haron, R. (2016). A Qualitative
Inquiry into the Investment Decision Behaviour of the Malaysian Stock Market Investors. Qualitative Research in Financial Markets, 8(3), 246–267.
http://doi.org/10.1108/QRFM-07-2015-0027
Jensen, M. C., & Meckling, W. H. (1976). Theory of the Firm: Managerial Behavior, Agency Costs
and Ownership Structure. Journal of Financial Economics, 3(4), 305–360. http://doi. org/10.1016/0304-405X(76)90026-X
Kun, Q., & Duo, M. (2014). Credit Risk Management
of Commercial Bank. Journal of Chemical and Pharmaceutical Research, 6(5), 1784–1788. Retrieved from http://www.jocpr.com/ archive/jocpr-volume-6-issue-5-year-2014. html
La Porta, R., Lopez-de-Silanes, F., Shleifer, A., & Vishny, R. (2000). Investor Protection and Corporate
Governance. Journal of Financial Economics,
58(1–2), 3–27. http://doi.org/10.1016/
S0304-405X(00)00065-9
Li, M.-Y. L., & Miu, P. (2010). A Hybrid Bankruptcy Prediction Model with Dynamic Loadings on
Accounting-ratio-based and Market-based
Information: A Binary Quantile Regression
Approach. Journal of Empirical Finance,
17(4), 818–833. http://doi.org/10.1016/j.
jempfin.2010.04.004
Lo, A. W. Y., Wong, R. M. K., & Firth, M. (2010). Tax, Financial Reporting, and Tunneling Incentives for Income Shifting: An Empirical Analysis
of the Transfer Pricing Behavior of
Chinese-Listed Companies. The Journal of the American
Taxation Association, 32(2), 1–26. http://doi. org/10.2308/jata.2010.32.2.1
Mahmudi, Hardani, W., & Sallama, N. I. (2010). Manajemen Keuangan Daerah. Jakarta:
Erlangga.
Margaretha, F., & Ramadhan, A. R. (2010).
Faktor-faktor yang Mempengaruhi Struktur Modal pada
Industri Manufaktur di Bursa Efek Indonesia. Jurnal Bisnis Dan Akuntansi, 12(2), 119–130. Retrieved from http://web.stietrisakti.ac.id/
JBA/5_artikel_JBA12.2Agustus2010.asp Mirdhani, L. P., & Budiyanto. (2014). Analisis Rasio
CAMEL untuk Menilai Kesehatan Bank pada Perusahaan LQ-45 di BEI. Jurnal Ilmu & Riset Manajemen, 3(5), 1–22. Retrieved from https:// ejournal.stiesia.ac.id/jirm/article/view/507
Myers, S. C. (1984). The Capital Structure Puzzle. The Journal of Finance, 39(3), 574–592. http:// doi.org/10.1111/j.1540-6261.1984.tb03646.x
Mzee, S. S., & Mohamed, M. R. (2014). Cost and Profit Efficiency and Management Behaviour of Commercial Banks (Evidence from
Tanzania). Asian Economic and Financial
Review, 4(10), 1447–1460. Retrieved from http://www.aessweb.com/journals/ October2014/5002/2812
Pappalardo, A. (1987). Government Equity Participation under the EEC Rules on State Aids:
Recent Developments. Fordham International Law Journal, 11(2). Retrieved from http:// ir.lawnet.fordham.edu/ilj/vol11/iss2/2/
Polimpung, E. S. F. W. (2014). Pengaturan Pelayanan
Publik dalam Rangka Otonomi Daerah. Lex et Societatis, 2(9), 18–26. Retrieved from https://ejournal.unsrat.ac.id/index.php/ lexetsocietatis/article/view/6383
Regulation of the Minister of Home Affairs of the Republic of Indonesia Number 52 of 2012 Regarding Guidelines for the Management of
Investments Regional Government, Pub. L. No. 52 (2012). Indonesia.
Romer, D. (2006). Advanced Macroeconomics (3rd
ed.). McGraw-Hill.
Ross, S. A. (1973). The Economic Theory of Agency:
The Principal’s Problem. The American Economic Review, 63(2), 134–139. Retrieved from http://www.jstor.org/stable/1817064
Sitepu, R. K. K., & Sinaga, B. M. (2006). Aplikasi Model Ekonometrika: Estimasi, Simulasi dan Peramalan Menggunakan Program SAS. Bogor:
Program Studi Ilmu Ekonomi Pertanian,
Sekolah Pascasarjana, IPB Bogor.
Triyonggo, Y., Maarif, M. S., Sukmawati, A., & Baga, L. M. (2015). Analisis Situasional Kompetensi
Praktisi Sumber Daya Manusia Indonesia
Menghadapi MEA 2015. Jurnal Manajemen
Teknologi, 14(1), 100–112. http://doi. org/10.12695/jmt.2015.14.1.7
Waymire, T. R., & Cefaratti, M. (2014). Underwriting
of Municipal Bonds in School Districts:
An Opportunity to Emphasize Operating
Performance. Internal Auditing, 29(4), 27–37. Zikmund, W. G., Babin, B. J., Carr, J. C., & Griffin, M.