290 ISBN (Vietnam): 978-604-73-4020-0
ANALYSIS OF FACTORS AFFECTING THE CAPITAL STRUCTURE
IN INDONESIA STOCK EXCHANGE
Indira Kurniasari
Werner R. Murhadi Mudji Utami
Faculty of Business and Economics, University of Surabaya [email protected]
Abstract
This study aimed to analyze the factors affecting the capital structure of the enterprise. Variables used profitability, size, tangibility, growth, earnings volatility, liquidity, and business risk. This study uses a quantitative approach to the analysis of multiple linear models. This study used a sample of manufacturing business entity registered in Indonesia Stock Exchange period 2009 - 2013. The samples used in this study were 328 observations. The results showed that the variables of profitability and earnings volatility significantly negative effect on the capital structure (debt). Variable size, tangibility, and positively affect growth significantly to capital structure (debt). However, the study also found that variable liquidity and business risk significantly negative effect on the capital structure (debt).
Keywords: capital structure, pecking order theory, trade – off theory, agency theory.
JEL Classification: G32
RESEARCH BACKGROUND
ISBN (Indonesia): 978-602-73852-0-7 291 been done on the factors affecting capital structure. Research conducted Sheikh and Wang (2011) using the 7 independent variables, namely profitability, size, non - debt tax Shield, tangibility, growth opportunities, earnings volatility, and liquidity. The results showed that the profitability, liquidity, earnings volatility, and tangibility (asset structure) significantly negative effect, while firm size significant positive effect on the debt ratio. However, non - debt tax shield and growth opportunities not appear significantly to debt ratio. While the research conducted Chen et al. (2014) on a non - financial in China is only using six independent variables, namely: size, growth, profitability, assets tangibility, tax shields, and business risk (risk). The results showed that the size, intangibility, and business risk significant positive effect on the capital structure, whereas a negative effect on profitability. However, the variable Growth and the tax shield do not significantly influence the capital structure. Murhadi (2011) conducted a study on company trade sector in ASEAN countries. The study uses six independent variables, namely: profitability, firm size, asset tangibility, growth companies, and non - debt tax shield. The research proves the existence of significant positive effect between asset tangibility and size of the company's debt, while profitability and growth has a significant negative effect on the debt. However, non - debt tax shield is not significantly positive result. Research Seftianne & Hand (2011) using 8 independent variables are profitability, liquidity, company size, business risk, growth opportunity, managerial ownership, and asset structure. The results showed that the growth opportunity and the size of the company influence the capital structure. However, this study found the profitability, liquidity, business risk, managerial ownership, and asset structure did not affect the capital structure.
ISBN (Indonesia): 978-602-73852-0-7 293 The next variable is the volatility of earnings. Chen and Jiang (2001) mentions that the work of poor management will increase earnings volatility thus increasing the chances of financial failure, and this will result in companies experiencing difficulties to obtain additional external funding (debt). Mahadwarta (2002) reported earnings volatility often associated with the condition of instability or level of business risk. Companies with high earnings volatility will lead to uncertainty about the outlook for the future. The presence of high revenue volatility will increase the cost of bankruptcy. Bradley et al. (1984) in Mahadwarta (2002) also states the increased volatility of earnings will impact the rising cost of bankruptcy of the company. Therefore, as a consequence of management will reduce the use of debt. Research Sheikh & Wang (2011), also proves there is a negative relationship between earnings volatility with debt. High earnings volatility indicates a high risk enterprise, so that the creditor does not provide loans to companies.
Liquidity indicates the level of the company's ability to meet short-term liabilities using current assets owned (Seftianne & Hand, 2011). Research Sheikh & Wang (2011) proves there is a negative relationship between liquidity with debt, this is because the liquid assets the company is able to cover the short-term debt. Results of this research was supported by the Pecking Order Theory, where companies with high liquidity prefer internal financing to fund new investments in order to avoid the agency problems caused by external funding.
Business risk is the risk when the company was unable to cover its operational costs (Gitman 2006: 215). The company with high business risks tends to avoid the use of debt financing compared with companies with lower business risk. Results of the study Chen et al (2014) suggest there is a relationship which varies between business risks with debt.
Based on the above explanation, the purpose of this study is to determine: (1) whether there is a negative influence between profitability and debt ?; (2) whether there is a positive influence between size and debt; (3) whether there is a positive influence between asset tangibility and debt; (4) whether there are negative effects between growth and debt; (5) whether there is a negative influence between earnings volatility and debt; (6) whether there is a negative influence between liquidity and debt; and (7) whether there is a negative influence between business risk and debt.
RESEARCH METHODS
294 ISBN (Vietnam): 978-604-73-4020-0 research used a sample of 82 companies that meet the criteria of the sample. The independent variables consist of: profitability, firm size, asset tangibility, growth opportunities, earnings volatility, liquidity, and business risk, while the dependent variable is capital structure.
This study uses multiple linear regression data processing to meet the classical assumptions. The research model as follows:
DEBT=α+β1PROF+β2SIZE+β3TANG+β4GROW+β5EVOLT+β6LIQ+β7RISK+e
Capital structure is measured by using a debt ratio (Debt). Profitability (Prof) is measured using return on assets (Sheikh & Wang, 2011). Size is measured by using the natural logarithm of total assets (Seftianne & Hand, 2011). Tangibility of assets (Tang) is measured by dividing the fixed assets to total assets (Murhadi, 2011). Growth (grow) is measured by the percentage change in total assets (Murhadi, 2011). Earnings volatility (evolt) measured by the standard deviation of EBIT to total assets (Sheikh & Wang, 2011). Liquidity (liq) is measured by using a current ratio. Business risk (risk) is measured by the standard deviation of stock returns on a monthly basis for one year (Seftianne & Hand, 2011).
RESULT AND DISCUSSION
Descriptive Statistics
Table 1 presents descriptive statistics
Table 1. Descriptive Statistics
N Minimum Maximum Mean Std. Deviation
DEBT 328 ,00 ,73 ,1320 ,12951
PROF 328 -,62 ,56 ,1062 ,12950
SIZE 328 21,19 32,90 27,9050 1,99332
TANG 328 ,05 ,95 ,3862 ,19013
GROWTH 328 -,59 3,27 ,1655 ,25760
EVOL 328 ,00 ,49 ,0329 ,05238
LIQ 328 ,15 75,42 2,5860 4,63939
RISK 328 ,00 ,84 ,1413 ,11057
Valid N (listwise) 328
ISBN (Indonesia): 978-602-73852-0-7 295 Classical assumption test for multicollinearity produce VIF value for all the independent variables is less than 5, means free multicolinearity. Autocorrelation to generate value DW 1.977, these results are in the quadrant free autocorrelation. For heteroscedasticity test using Park Test, where the results show is free to the problem of heteroscedasticity.
The next in Table 2 are presented the test results of inferential statistics
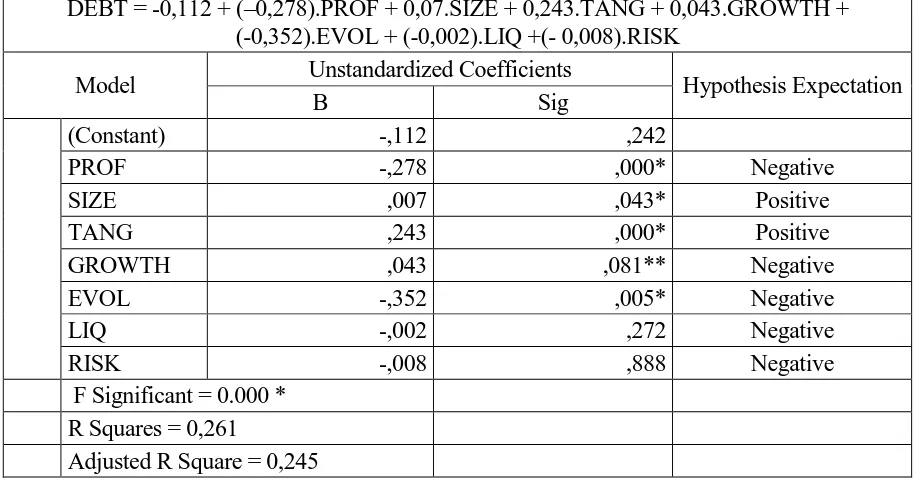
Table 2. Statistics Result
DEBT = -0,112 + (–0,278).PROF + 0,07.SIZE + 0,243.TANG + 0,043.GROWTH + (-0,352).EVOL + (-0,002).LIQ +(- 0,008).RISK
Model Unstandardized Coefficients Hypothesis Expectation
B Sig
(Constant) -,112 ,242
PROF -,278 ,000* Negative
SIZE ,007 ,043* Positive
TANG ,243 ,000* Positive
GROWTH ,043 ,081** Negative
EVOL -,352 ,005* Negative
LIQ -,002 ,272 Negative
RISK -,008 ,888 Negative
F Significant = 0.000 * R Squares = 0,261
Adjusted R Square = 0,245
* Significant at 5% ** Significant at 10%
Based on the table 2 above proved that the independent variables (profitability, size, tangibility, growth, earnings volatility, liquidity, and business risk) simultaneously affect the dependent variable (capital structure) significantly. The coefficient of determination (R2) of 0.261, indicating that changes in the capital structure (debt) can be explained by profitability, size, tangibility, growth, earnings volatility, liquidity, and risk by 26.1% while the remaining 73.9% is explained by variables outside variable profitability, size, tangibility, growth, earnings volatility, liquidity and business risk.
296 ISBN (Vietnam): 978-604-73-4020-0 reinvestment internal funding less risky when compared to external funding. This is consistent with studies Sheikh & Wang (2011), Chen et al (2014), and Murhadi (2011) which states there is a significant negative effect on the profitability of the debt.
Variable sizes have significant positive effect on the debt. This means that the bigger the size of the company, companies tend to use more debt. Companies that have large size will allow the company to get a loan because it has a great asset as collateral; in addition the company also has a low probability of financial distress. This is consistent with studies Sheikh & Wang (2011), Chen et al (2014), Murhadi (2011), and Seftanne & Hand (2011).
Variable asset tangibility has a significant positive effect on debt. This means the company has large real assets that are expected to be lower risk of failure and allows obtaining greater debt. The issuance of debt secured by the assets will reduce asymmetric information in connection with the financing costs. Differences in information between the parties involved allowing the moral hazard problem. In other words, the debt that is secured by the assets can reduce asymmetric information so that the impact on the positive relationship between real assets and debts. Gitman (2008) also argues: companies with large fixed assets tend to use more debt than companies with smaller fixed assets. This is consistent with studies of Chen et al (2014) and Murhadi (2011) which states that there is a significant positive relationship between asset tangibility and debt.
Variable growth proved significant positive effect on the debt. Song (2005) in Indrajaya (2011) state companies with a high growth rate would imply a higher demand would need external funding. This is consistent with the Pecking Order Theory, when the company requires external funding to meet the needs investment, and then the company would prefer to use the debt first rather than by issuing new shares. The higher the growth opportunities will lead to the higher information asymmetry occurs, so that according to Myers and Majluf (1997), the company will use the debt to suppress the information asymmetry that may occur.
ISBN (Indonesia): 978-602-73852-0-7 297 (2011) which states that there is a significant negative correlation between earnings volatility with debt.
Liquidity variables proved negative but not significant effect on the debt. Pecking order theory, stating that the business entity that has a high level of liquidity will tend to use internal funds rather than external funding in the form of debt, as companies with a high level of liquidity has a large internal funding to advance used to finance investments before use of external financing in the form of debt. Business risk variables do not have a significant effect on the debt. This means that companies with high business risks will tend to avoid using debt financing compared with a company that has a lower business risk. Companies with highly fluctuating cash flow will be aware that the use of risky debt will be less favorable than with equity, so companies are forced to use the equity to meet its financing in order to avoid financial difficulties in the company. This is consistent with the Pecking Order Theory, which states that the company prefers the use of internal funds, the funds derived from cash flow, retained earnings, and depreciation.
CONCLUSION
Based on F test proved that the variable profitability, size, tangibility, growth, earnings volatility, liquidity and business risk jointly significant effect on the company's debt Manufacturing listed on the Indonesia Stock Exchange during the period 2009 - 2013. The coefficient of determination (R2 ) of 0.261, indicating that the debt can be explained by changes in profitability, size, asset tangibility, growth, earnings volatility, liquidity and business risk by 26.1%, while the remaining 73.9% is explained by other variables. Based on t test shows five variables (profitability, size, asset tangibility, growth, and earnings volatility) proved a significant effect on the debt. While variable liquidity and business risk partially no proven effect on the debt. This study has limitations where the coefficient of determination is low enough, so it is possible to do further research, either using other independent variables or increasing the number of independent variables. Moreover, it can use a larger sample that all companies listed on the Indonesia Stock Exchange in order to reflect the overall capital market.
REFERENCES
1. Brigham, Eugene F. dan Joel F. Houston. 2001. Manajemen Keuangan, Edisi 8, Erlangga, Jakarta.
2. Chen,J., Jiang.C., danLin.Y. 2014. What Determine Firm’s Capital Strukture in China?,
Journal of Managerial Finance, Vol. 40 No. 10:1024-1039.
3. Chung, K.H.1993. Asset characteristics and corporate debt policy: an empirical test,
298 ISBN (Vietnam): 978-604-73-4020-0 4. Indrajay,G., Herlina., danSetiadi, R. 2011. Pengaruh Struktur Aktiva, Ukuran Perusahaan, Tingkat Pertumbuhan, Profitabilitas dan Risiko Bisnis Terhadap Struktur Modal: Studi Empiris Pada Perusahaan Sektor Pertambangan yang Listing di Bursa Efek Indonesia Periode 2004-2007, Jurnal Ilmiah Akuntansi, Vol. 6 No.2.
5. Mahadwartha, P.A. 2002. Interdepensi antara Kebijakan Laverage dengan Kebijakan Dividen : Perspektif Teori Keagenan, Jurnal Riset Akuntansi, Manajemen dan Ekonomi, Vol. 2 No.2.
6. Murhadi, W.R., 2011. Determinan Struktur Modal: Studi di Asia Tenggara, Jurnal Manajemen dan kewirausahaan, UK Petra, Terakreditasi DIKTI, September 2011.
7. Myers, S. 1984. The capital structure Puzzle, The Journal of Finance, 39, 575-592.
8. Myers, S. C., and Majulif, N. 1984. Corporate financing and investment decisions when firms have information that investors do not have, Journal of Financial Economics, 13,
187−221.
9. Rajan R.G., dan Zingales L. 1995. What do we know about Capital Structure? Some evidence from international data, Journal of Finance 50 (5), 1421-1460.
10. Seftianne dan Handayani. 2011. Faktor – Faktor yang Mempengaruhi Struktur Modal pada Perusahaan Publik Sektor Manufaktur, Jurnal Bisnis dan Akuntansi, Vol. 13 No. 1:39-56.
11. Sheikh, N.A. dan Wang, Zongjun. 2011. Determinants of Capital Structure : An Empirical Study of Capital Firms in Manufacturing industry of Pakistan, Journal of Managerial Finance Vol. 37 No. 2: 117-133.
12. Titman, S., dan Wessels, R. 1988. The determinants of capital Structure Choice, Journal of Finance, 43, 1-19.
13. Um T. 2001. Determination of Capital Structure and Prediction of Bankruptcy in Korea,