CHAPTER III
RESERACH METHODOLOGY
This chapter consists of : research type, research design, variable of the study, population and sample, research instruments of the study, data collection procedure and data analysis procedure.
A.Research Type
This study uses the quantitative research design which makes use of numbers and statistical data to analyze and present the results. The writer investigated how the cause which would be an independent variable (in this study the use of using picture crossword) affected the dependent variable (learning vocabulary). Experimental design was used because the writer has to draw the cause-effect relationship between the dependent and independent variables.
The type of study used is Experimental Study. It utilizes One group pre-Test/Post-Test Design. Creswell stated that this design includes a pre-test measure followed by a treatment and a post test for a single Group.1 This Design Can be diagrammed as follows :
Where:
O1 : Pre-test
X : Treatment
1
John W. Creswell, Qualitative And Quantitative Approach (California: SAGE Publications, inc,1994), P.132.
O2 : Post-test
In this study, the writer taught the students directly. Firstly, the writer gave the students pre-test in order to measure the students’ vocabulary in learning vocabulary before using picture crossword as an instructional media. In this case, the students had learnt vocabulary before. Secondly, the writer gave treatment. The writer taught the students for four times by using picture crossword. Third, there was post test. The result of pre-test and post-test was compared to look for the scores and to find out whether their abilities in learning vocabulary increase or not after picture crossword was taught. In this research, the writer collected, processed, analyzed the data to get conclusion of the research.
B.Research Design
In this study, the writer used quasi experimental design. Quasi experimental design is similar to randomized experimental research in that involves manipulation of independent variable but differ in that subjects are not randomly assigned to treatment group. There are many situations in educational research in which it is not possible to conduct a true experiment. This design is compatible with the writer’s purpose who wants to evaluate the use of using picture crossword game
in teaching vocabulary.
for experimental group only ( X ). Post test was given for both of groups to measure the score of students after the treatment is given ( Y1 and Y2 ). The scheme of this model is : 2
Table 3.1
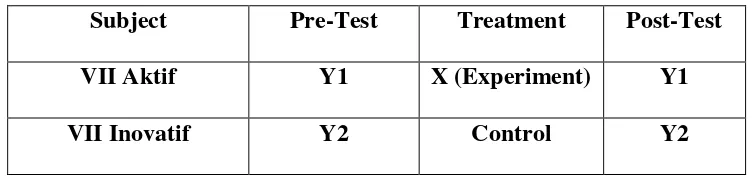
The Scheme of Quasi Experimental Design
Subject Pre-Test Treatment Post-Test
VII Aktif Y1 X (Experiment) Y1
VII Inovatif Y2 Control Y2
Where :
E : Experimental group C : Control group X : Treatment Y1 : Pre-test Y2 : Post-test
In this experiment, the writer taught the students directly with the same material. Therefore, the use of picture crossword game to teach vocabulary would be applied on experimental group only. Meanwhile, the control group would not be given the treatment.
2
C.Variable of The Study
Variable is a property or characteristic which may differ from individual to individual or from group to group. A great deal of research is carried out in order to identify or test the strength of relationships between variables. When one variable influences or affects a second variable, the first variable is called an independent variable, and the second is called a dependent variable. There are two variables in this study, they are:
1. Independent variable : Independent variable of this study is picture crosswords as a media in teaching vocabulary (X).
2. Dependent variable : Dependent variable of this study is the result of the student’s vocabulary score who involve in this study (Y).
D.Population and Sample
a. Population
A population is defined as all members of any well defined class of people, events, or objects. If someone wants to research all of the elements in research area, his/her research is called population research on census study.3
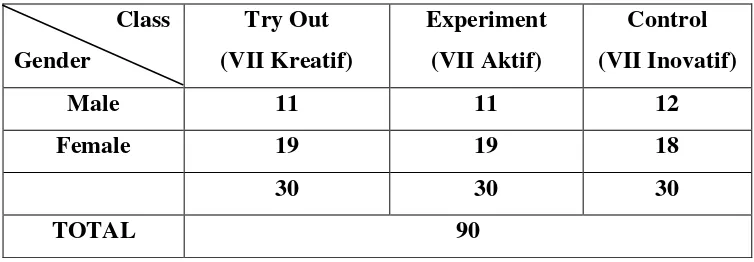
The population of this study was all of the seventh grade students of MTsN Katingan Tengah amount 90 Students in three classes; VII Aktif, VII Kreatif and VII Inovatif.
31
Table 3.2
Population of Seventh Grade Students of MTsN Katingan Tengah
Class
Sample is a subset of individuals or case from within a population.4 Sugiyono states, “Sampel adalah sebagian dari jumlah dan
karakteristik yang dimiliki oleh populasi tersebut “. 5 ( Sample is a half of numbers and characteristics in the population).
Cluster sampling is used if the population does not consist of individuals, but groups or cluster.6 Because the population of this study was the students of the seventh grade students of MTsN Katingan Tengah. Which they consist of three classes. The VII Aktif class became the experiment class and VII Inovatif became the control class.
32
David Nunan, Research Methods in Language Learning,Cambridge: Cambridge University Press,1992 , p. 232
5
Ibid., p. 118
6
E. Research Instruments
1. Research Instruments
The writer collected the main data from pre-test and post-test. From the two test the writer was able to find out the students’ vocabulary scores.
A pre-test was given to the experiment group and control group before any teaching conducted. By giving this pre-test, the writer wanted to find out how balance these groups to each other in vocabulary, and also to compare its score to the posttest scores which would be given after the treatment. A post-test as the last test also given to both groups to get the quantitative data.
The writer collected the data of this study by using test and the result of the test was used to measure the students’ vocabulary scores. The
test will be in multiple choice test form and there were 30 items. The allocated time to do each vocabulary test were 90 minutes.
For the test type, the writer used the opinion from J.B Heaton. He stated that many types of test that could be used to test vocabulary. The writer took type 1 as reference. 7
In these type of recognition items is replaced by picture. The testes see the picture and have to select the most appropriate word.
Example :
7
1. In the class Ani sit on...?
a. Table
b. Chair
c. Book
d. Window
2. “Tas” in English is...?
a. Shoes
b. Bag
c. Shoes
d. Table
3. “t-e-b-l-a”
The correct word is...?
a. Table
b. Chair
c. Pencil
d. Teacher
2. Research Instruments Try Out
result of the try out test was there were 13 items was invalid and there were 37 items was valid. The researcher used 30 items to give the pre-test.
3. Research Instrument Validity
a. Content Validity
According to Heaton, a good test should posses’ validity: that is
it should measure what is intended to measure and nothing else.8 If a test does this, it said to be valid. All of the test must be related to what students learned. In this study the instruments are equal and proportional in their distribution as the indicators of test. The following table shows the content specification of the instrument where the item distributed to the students.
To measure the validity of the instrument, the writer was use the formulation of Product Moment by Pearson as follows:9
r
xy=
Where:
rxy : Total coefficient of correlation
X : Total Value of Score X Y : Total Value of Score Y
XY : Multiplication Result between Score X and Y N : Number of students
8
J. B. Heaton, English Language Test, San Francisco: Longman, 1974, p. x.
9
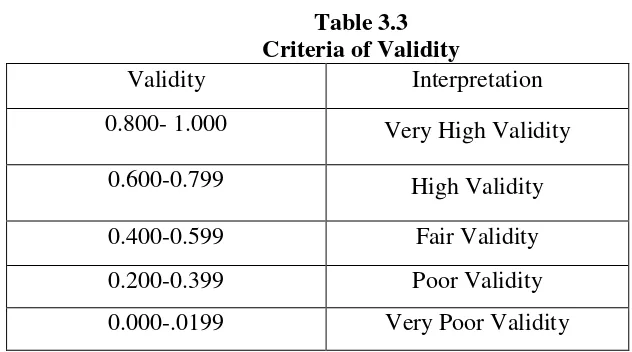
To know the level of validity of instrument, the value will be interpreted based on the qualification of validity as follows:
t-test>t-table = Valid
t-test<t-table= Not Valid
Table 3.3 Criteria of Validity
Validity Interpretation
0.800- 1.000 Very High Validity
0.600-0.799 High Validity
0.400-0.599 Fair Validity
0.200-0.399 Poor Validity
0.000-.0199 Very Poor Validity
b. Face Validity
To face validity of the test items as follows:
a.)Vocabularies of the test was taken by the picture crossword. b.)Kinds of the test items consist of vocabularies.
c.)Language is used English.
d.)The test items are suitable with syllabus of English subject of the MTsN Katingan Tengah.
b. Construct validity
4. Research Instrument Reliability
Reliability is a necessary of any good test: for to be valid at all, a test must first be reliable as a measuring instrument. The writer used formula of Kuder and Richardson to measure the reliability of the whole test10
11
r11 = reliability of instrument k = number of items
M = the mean score on the test for all the testers Vt = the standard deviation of all the testers’ score
The steps in determining the reliability of the test were: a. Making tabulating of tests scores.
b. Measuring the mean of the testees’s scores with the formula :
M=
N Y
c. Measuring the total variants with the formula:
Tt= ∑
( ∑ )
Where: Where:
Tt = the total variants
10
X = the total of score X2
= the square of score total N = the number of testers
d. Calculated the instrument reliability using KR-21. e. The last decision is comparing the value of 11 and t
11
> r
table = Reliable
11
<r
table= Not Reliable
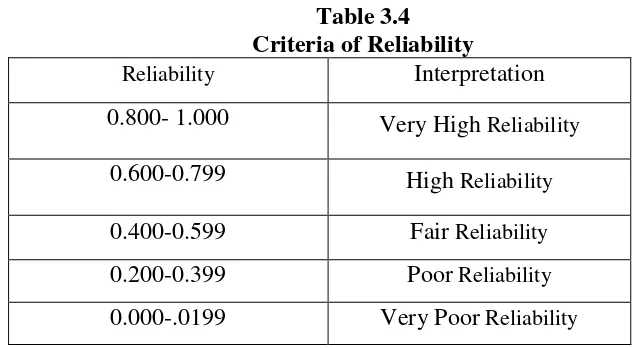
f. To know the level of reliability of instrument, the value of 11 was interpret based on the qualification of reliability as follows:
Table 3.4 Criteria of Reliability
Reliability Interpretation
0.800- 1.000 Very High Reliability
0.600-0.799 High Reliability
0.400-0.599 Fair Reliability
0.200-0.399 Poor Reliability
0.000-.0199 Very Poor Reliability
F. Data Collection Procedures
The writer collected the data by implementing some procedures. There were some steps in the procedures as follow :
a. The writer will observed the class
English, to know how the students’ attitude while teaching learning process was going on. The observation was purposed to get specific data, they were: 1. The general description of the location of the study
2. The syllabus and lesson plan of the school 3. The number of class
4. The number of students and students’ name
5. The number of English teacher
6. The process of teaching learning English
b. The writer gave try out test to try out class (VII creative)
c. The writer determined two classes from the population into experiment group (VII active) and control group (VII innovative).
d. The writer gave a pre-test to the experiment group (VII active) and control group (VII innovative).
e. The writer taught the experiment group (VII active) by using picture crossword .
f. The writer taught the control group (VII innovative) by using matching word.
g. The writer gave a post-test to experiment group (VII active) and control group (VII innovative).
h. The writer gave score to the main data from experiment group (VII active) and control group (VII innovative).
j. The writer interpreted the analysis result. Based on the scores obtained from pre test and post test, it was analyzed by finding the mean of the students’ post test score to test the hypothesis.
G. Data Analysis Procedures
The data of this study were students’ vocabulary ability score. Therefore,
the data were quantitative. The pretest and post-test raw score were converted into percentages. In order to analyze the data that had been collected. The mean, standard deviation and standard error of students’ score becomputed for
the pretest and post-test scores of the experiment and control groups. The writer used statistical ttest to answer the problem of the study. In Order to
analyze the data, the writer did some way procedures:
1. Gave tests to the students of the seventh grade students of MTsN Katingan Tengah.
2. Collected the data of the students work sheet test result. 3. Scored the students’ answers using the formula:
S=
Where:
S= Students’ score
n= number of true answere N= number of test items
variable X1 (Experimental group) and X2 (Control group) by using the formulas bellow:
a. Mean of students’ score
̅=∑
Where:
∑ = total of score n = total of the students b. Standard deviation11
S= √ ∑ ∑
c. Standard Error12
SEmd=
Where:
S= Standard deviation
n1= the number of the experimental group
n2= the number of the control group
SEmd= Standard error
N= Number of Case 5. Normality Test
It was used to know the normality of the data that was going to be analyzed whether both groups have normal distribution or not. Chi square is used here13
11
Riduwan, Metode dan teknik Menyusun Thesis, p. 351
12
X2observed= ∑
Notice:
X2observed = Chi square
= frequency from observation = expected frequency
Calculation result of X2observedwass compared with by 5% degree of significance. If X2observed was lower than so the distribution list was normal.
6. Homogenity Test
It was used to know wether experimental group and control group, that were decided, come from population that has relatively same variant or not. The formula was:14
∑
Where: B= ( ∑
Notice:
≤ , is homogeneity.
≥ , is not homogeneity.
If calculation result of was lower than by 5% degree of significance, it meat both groups had same variant.
13
Ibid, p.179.
14
7. Calculated the data by using ttest to test the hypothesis of the study, whether
the using of picture crossword gave effect to the students’ vocabulary scores
or not. To examined the hypothesis, the writer used ttest formula as follows:15
tobserved=
√ ( )
Where:
Mn1 = the mean score of experimental group
Mn2 = the mean score of control group S12= variance of experimental group
S22= variance of control group
n1= total of experimental group students
n2= total of control group students
To know the hypothesis was accepted or rejected using the criterion: If tobserved (the value) ≥ttable, it means Ha is accepted and Ho is rejected.If tobserved (the value) ≤ttable, it means Ha is rejected and Ho is
accepted.
8. Interpreted the result of ttest. Previously, the writer accounted the degrees of
freedom (df) with the formula:16 df = (N1+N2-2)
Where:
df: degrees of freedom
N1: Number of subject group 1
15
Ibid, p. 273
16
N2: Number of subject group 2 2: Number of variable
After that, the value of ttest will be consulted on the ttable at the level of
significance 1% and 5%. In this research, the writer uses the level of significance at 5%. If the result or ttest was higher than ttable, it meat Ha was
accepted. But if the result of ttest was lower than ttable, it means Ho was