25 (2001) 561}592
Experimental analysis of the e
$
ciency
of uniform-price versus discriminatory
auctions in the England and Wales
electricity market
qJohn Bower, Derek Bunn
*
London Business School, Regent's Park, Sussex Place, London NW1 4SA, UK
Abstract
The question of whether the uniform price or discriminatory auction format is the better multi-unit auction mechanism is addressed in the context of the 1999 debate on reforming the England & Wales electricity market. Each generator is modelled as an autonomous adaptive agent capable of endogenously developing its own bidding strat-egies using a naive reinforcement learning algorithm. The discriminatory auction results in higher market prices than the uniform-price auction. This is because market prices are not publicly available and agents with a large market share gain a signi"cant informational advantage in a discriminatory auction, thereby facing less competitive pressure. ( 2001 Elsevier Science B.V. All rights reserved.
JEL classixcation: C63; C7; D43; D44; L94
Keywords: Agent-based computational economics; Auction design; Electricity markets; Market power
q
This research was partly funded by ESRC Postgraduate Training Award No. R00429724400 and a London Business School Financial Award.
*Corresponding author. Tel.:#44(0)20-7262-5050; fax:#44(0)20-7724-7875. E-mail address:[email protected] (D. Bunn).
1. Introduction
Auction mechanisms have been attracting increasing attention in recent years, motivated in part by their increasing use in selling network access rights, and creating competitive markets, in telecommunications, gas and electric utilities, as well as in periodic auctions of various government securities. Research into alternative designs for auctions is mainly concerned with understanding how the di!erent rules which govern the auction process, the number of items on o!er, and the timing and quantity of information available to bidders, a!ect the market price. However, most of this is theoretical research and assumes that bidders will be making competitive bids, that these bidders are symmetrical in size, that they bid once only, for a unique good, and that they are risk neutral. In reality, however, many auctions involve an oligopoly of asymmetric bidders who meet repeatedly, and frequently, to bid for the same commodity. Under these circumstances, bidding is unlikely to be competitive, but strategic in nature, with bidders seeking out opportunities to exercise market power. As a result, oligopolistic bidders will have a powerful incentive to exploit, or&game', any auction mechanism and, as a result, cause price ine$ciency. Despite the frequent occurrence of multi-period, multi-unit, auctions, it is therefore still an open question as to which mechanism is most e$cient, especially when the auction involves an oligopoly of bidders.
In this paper, we attempt address this question by using a novel agent-based computational economic (ACE) approach to simulate the behaviour of an oligopoly of bidders in a range of multi-unit, multi-period, auction settings. The application of ACE to the analysis of imperfect competition is a particularly promising area of research, because of the obvious potential for emergent learning and collusive behaviour as "rms interact through time. In this case, we are interested in understanding what behavioural e!ects alternative bidding rules may have on bidders of di!erent sizes, how that impacts their ability to exercise market power, and what happens to market price as a result. In terms of a practical application, we have been particularly motivated by the 1999 proposal to transform the 10 yr old England & Wales wholesale electricity market, which had been run as a uniform-price auction, into a commodity market operating as a discriminatory auction. We have therefore developed a detailed model of electricity trading in England and Wales, and used this to experiment with di!erent auction market mechanisms.
results in summarised in Section 5. Finally, the wider theoretical and economic implications of our"ndings are discussed in Section 6.
2. Background
Game theoretic analysis of various auction types (e.g. &First Price', &Second Price',&English',&Dutch') generally assume abenchmark modelwhere bidders:
f are risk neutral;
f have their own private valuations of the good (the & independent-private-values' assumption);
f are symmetric; and
f make or receive payments as a function of bids alone.
As a result, the general results are that the"nal price achieved is invariant to the auction mechanism (see Eatwell et al., 1998; Rothkopf and Harstad, 1994; McAfee and McMillan, 1987). However, despite being a cornerstone of modern auction theory, this Revenue Equivalence Theoremonly applies where a single unit of an indivisible good is being auctioned, in a single-period setting. In contrast, theory is much less well-developed where these conditions are relaxed, and particularly where multi-unit, multi-period bidding occurs between an oligopoly of asymmetric bidders.
The multi-unit auction analogue of the"rst-price auction is thediscriminatory auction where bidders make sealed bids indicating the quantity of goods they are willing to buy at a range of prices. The auctioneer allocates the goods to the highest bid "rst, according to the quantity demanded, and so on down the sequence of received bids until all the goods have been allocated. In some cases, the seller may reserve the right to increase the total number of goods allocated, for example to take advantage of unexpectedly high demand, or to scale back the sale if bids fall below some reserve price. Bidders pay for the goods at the price equal to their individual bids (&Pay Bid'). Likewise, the uniform-price auction is the multi-unit analogue of the second-price auction which is run in the same way as a discriminatory auction except that successful bidders all pay the same price regardless of the bids they actually made. This price is equal to the highest (marginal) bid price accepted (&Pay Marginal').
theoretically, there are always discriminatory auction equilibria that dominate uniform-price equilibria, and vice versa. However, as Das and Sundaram (1997) point out even this conclusion is not clear cut. Not all equilibria are equally plausible; auction markets do not work in isolation and often interact with forward markets, and other secondary markets; and the impact of non-competi-tive bidders creates noise that a!ects the actions of competitive bidders.
Nevertheless, largely as a result of the early theoretical research described above, a number of governments began experimenting with uniform-price auctions. However, analysis of their results presents a mixed picture. For example, when the US Treasury switched to uniform-price auctions, for 2 and 5 yr treasury note sales in 1992, the results were inconclusive. A study by Simon (1994) argues that the uniform-price auction cost the US Treasury money while Nyborg and Sundaresan (1996), compared actual bids and market price data, before and after the switch, and found no signi"cant di!erence in prices under the two di!erent sets of trading arrangements. Their explanation for the appar-ent revenue equivalence related to the fact that both a &when issued' forward market and a secondary market, operated in parallel with the regular auctions. This signi"cantly contributed to the dissemination of information between potential bidders and helped relieve information asymmetries that would other-wise create market ine$ciencies.
Similar analysis in other markets include a Nyborg et al. (1997) study of bid price data during 1990}1994 for the Swedish Treasury market. This suggested that the government might be better switching to a uniform-price auction from the current discriminatory auction, although the results were not conclusive. Umlauf (1993) and Tenorio (1993) studied Mexican treasury and Zambian Foreign exchange auctions, respectively. Both studies report higher seller rev-enues under a uniform-price auction format. A subject that has recently become topical is the sale of gold reserves by European central banks in preparation for the Euro, and by the IMF to fund debt relief to third world nations. When, in 1959, the IMF sold some of its reserves in a series of 35 discriminatory auctions and 10 uniform-price auctions signi"cantly higher revenue was achieved from the discriminatory auctions. Interestingly, when the UK Treasury began selling its gold reserves in 1999 it chose to use a uniform-price format (Bank of England, 1999). Though it is too early to tell what e!ect the choice of auction mechanism has had on revenues, the Treasury has reserved the right to change this format in later auctions. This clearly suggests there is still some uncertainty on its e! ec-tiveness. Indeed, the UK authorities decided against introducing uniform-price auctions for treasury securities, a few years earlier, because of the inconclusive results from the US treasury note auctions described above (Bank of England, 1995).
prompted, at least in part, by concerns raised by the 1991 Salomon bond trading scandal. Here, one large broker-dealer, Salomon Brothers, made unauthorised use of client accounts to secretly acquire substantial quantities of bonds, in 2 yr treasury note auctions, which exceeded explicit US Treasury limits that prohibit any one bidder acquiring more than 35% of an issue (see Jegadeesh, 1993 for further details). Nyborg et al. (1997) also note there are only 16 dealers in Swedish treasuries and that one dealer will frequently succeed in bidding for the entire auction. The possibility of implicit, or explicit, collusive behaviour devel-oping among a relatively small number of bidders who compete regularly at these auctions, or even one bidder dominating the entire auction, is an impor-tant factor not so far considered. Indeed, one explanation for the inconclusive results of the empirical studies on auctions in"nancial markets may be in part due to the concentration of large dealers that dominate these markets. Smith (1990) addresses the possibility of non-competitive behaviour in auctions, from a sociological rather than economic point of view, and suggests that bidders should be thought of as social groups with norms, values, and behavioural rules. He provides empirical evidence from New York jewellery auctions, where regularly repeated auctions are attended by an essentially closed group of bidders who have come to clear understandings about how and when they will compete for particular lots on o!er. These resulted in bids, and prices, which
"tted the group's notion of&worth', in contrast to the typically assumed reserva-tion price. The importance of behavioural learning, through repetireserva-tion, in auctions is further illustrated in experiments carried out by Cox et al. (1984). These show that subjects often do not follow the dominant bidding strategy, to begin with, but gradually learn to adopt the strategy over time as their experi-ence increases through repetition. Laboratory experiments by Isaac and Walker (1985), where subjects were allowed to discuss and coordinate bidding strategies, over many di!erent auction types including multi-unit auctions, also resulted in a signi"cant level of collusion in many cases.
Overall, the literature therefore presents a confusing picture. Studies of treasury and other"nancial market auctions are rather inconclusive and this is often taken to imply that there may be no signi"cant di!erence between uniform-price and discriminatory auctions. However, the existence of forward
1OFFER amalgamated with the O$ce of Gas Regulation (OFGAS) in 1999, creating the O$ce of Gas and Electricity Market Regulation (OFGEM) but for clarity we shall continue to refer to OFFER throughout.
small group of participants bidding, it is possible that implicit collusion may be masking underlying di!erences between auction mechanisms that would otherwise become apparent in a more competitive environment. In fact, the only really clear cut conclusion that we can draw from the literature is that single-unit auction theory cannot successfully be applied to multi-unit auctions.
A new set of auction markets, that may help resolve these issues, has become available in the last few years due to the deregulation of the global electricity industry. Electricity market auctions are of particular interest, because they involve multi-unit bidding, often by relatively concentrated groups of bidders, some of whom have very signi"cant market shares. Not only that, the rules which govern these markets usually require the same bidders to compete regularly, at least daily, in order to o!er their output through a centralised auction process which o!ers signi"cant potential for learning and implicit collusion.
Rothkopf (1999) highlights the central importance of repetition in electricity auctions, a fact that has often been ignored in traditional auction theory, and stresses the fact that tacit collusion is a much greater problem when bidders meet repeatedly, whichever auction method is chosen. To combat these implicit and explicit collusion problems, he recommends delaying the release of informa-tion about bids and aucinforma-tion outcomes, particularly from sealed-bid aucinforma-tions, and stresses the need for e!ectively enforced prohibitions on active conspiracy between bidders. However, delaying information is at odds with the common belief that extra transparency and information availability will improve market e$ciency. The conclusion he draws about electricity trading arrangements in California is that a sealed-bid auction is better than a progressive auction but to avoid collusion, care must be taken in deciding which information to release. For the remainder of this paper we will focus on the wholesale electricity market in England and Wales and the proposal made by the O$ce of Electricity Regulation (OFFER)1 to transform the day-ahead market, which has been a uniform-price auction (the&Pool'), into a discriminatory auction (&the bilateral model').
3. Electricity trading in England and Wales
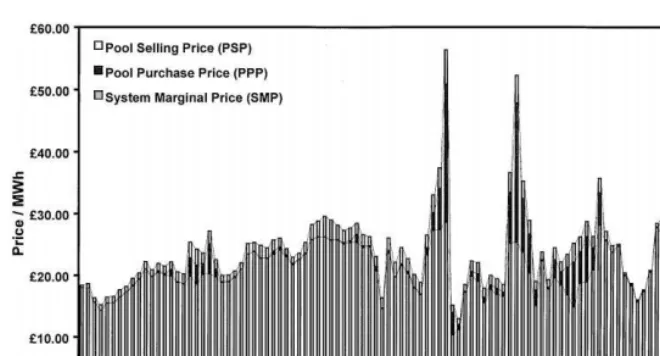
Fig. 1. Monthly time-weighted average Pool prices.
physical supplies of bulk electricity are traded, and which many other countries have since copied. However, in 1998, OFFER launched an industry-wide review of the trading arrangements because of the widely held belief that the market mechanism might be creating, or at least contributing to, generator market power in the Pool and as a result allowing them to keep market prices well above their marginal production costs.
2All of this documentation, including more detailed descriptions of the Pool mechanism can be downloaded from http://elecpool.com, http://www.open.gov.uk/o!er, and http://www.reta.org.uk, respectively.
3Bids and market prices are quoted inC/Megawatt hour (C/MWh) and quantities in Megawatts (MW).
Empirical analysis of the strategic bidding behaviour of generators in the Pool, Wolfram (1998), shows that strategic bid increases are indeed occurring and that this is particularly prevalent for bidders with large portfolios of plant. They tend to bid higher than other bidders, all else equal, because they receive a larger payo!on all their lower price units, have the necessary spare capacity, and biggest incentive to bid in such a way as to raise the marginal price setting bid. This is also consistent with the"ndings of Bunn et al. (1998) that, even in the absence of collusion, generators could still exercise market power in the current Pool. The importance of generators'ability to in#uence the marginal bid price was also investigated in the early days of the Pool by von der Fehr (1991) who believed that a small changes to the auction mechanism could make a signi"cant di!erence to the"nal market price. However, despite the conviction with which new trading arrangements were proposed by OFFER and the UK government in 1999, there has been no substantial theoretical, or empirical, evidence that changing the Pool's trading mechanism from a uniform-price to a discrimina-tory auction would reduce market prices.
In the remainder of the section we give a brief overview of the Pool and bilateral models. Extensive documentation covering current Pool trading ar-rangements, and OFFER's bilateral model proposal can be found at the web sites of the Electricity Pool of England & Wales, OFFER, and the RETA Group2(see particularly the comprehensive summary in OFGEM, 1999b, c). Here, we will limit ourselves to identifying those elements of the Pool that the bilateral model would replace.
3.1. The Pool
The focal point of the Pool is the day-ahead market that sets a price3 for electricity in each of the 48 half-hourly periods of the next day. This is closely tied to a forward market which generators and consumers use to hedge their exposure to volatile prices in the day-ahead market.
4NGC noti"es all relevant Pool members electronically at 4.00 p.m. and prices are also made publicly available in the Financial Times, published on the following day.
submit their bids by 10.00 a.m. each day. Once submitted, these bids cannot be changed and apply to the whole 24 h period, starting at 5.00 a.m. on the next day. However, generators are allowed to withdraw their bids at any time by re-declaring their gensets unavailable right up to the moment of despatch.
On receipt of the price and quantity bids from the generators, NGC con-structs a supply curve by stacking the bids in price merit order, and identi"es the optimal, lowest cost, combination of gensets that will meet its forecast of demand in each half-hour of the next day. This process creates the Uncon-strained Schedule that NGC uses to begin planning the operational despatch of plants and to calculate the half-hourly system marginal price (SMP). This is e!ectively the bid price of the most expensive generating set that NGC has forecast will run in each half-hour of the next day. At around 4.00 p.m., on the day-ahead, NGC publishes4 SMP and also the Pool Purchase Price (PPP), which is SMP plus a Capacity Element (CE). This covers capacity payments made to all gensets included in the Unconstrained Schedule, and is meant to encourage investment in new plant designed to meet peak loads. CE rises exponentially when forecast demand begins to approach total system capacity and can make up a signi"cant proportion of a generator's "nal revenue. Consumers also pay a uniform price, the Pool Selling Price (PSP) which, in low-demand periods (the so-called&Table B') is equal to PPP. In high-demand periods (the so-called &Table A') PSP includes an additional element, called Uplift, which is made up of Energy Uplift and Unscheduled Availability Pay-ments. Energy Uplift covers the cost of calling additional plants to run, not originally included in the Unconstrained Schedule, to meet deviations from forecast demand, and replace plant that has become unavailable through out-ages or generators'availability redeclarations. Unscheduled Availability Pay-ments are made to gensets which were not included in the Unconstrained Schedule, but which were bid into the day-ahead market, to encourage invest-ment in peaking plant in the same way as capacity payinvest-ments operate. Con-sumers have no direct involvement in the price setting mechanism except for a few very large power users, who are permitted to make demand reduction bids, but the quantities involved typically amount to less than 2% of winter peak demand.
5See Hoare (1995) for a detailed description of CFD and EFA forward markets.
mandatory nature of the day-ahead market means that both of the main contracts traded, Contracts for Di!erence (CFDs), and Electricity Forward Agreements (EFAs), must be "nancially settled against prices set in the day-ahead market, usually PPP.5 The CFD market covers long-term forward contracts, with durations stretching from six months up to 15 yr and beyond, while the EFA market is for much shorter-term contracts, usually one week to six months in duration. In contrast to the day-ahead market, EFA and CFD market prices are not publicly quoted and, despite the large volumes of power being contracted for, both markets are also highly illiquid.
3.2. The bilateral model
The proposed bilateral model has the following key components:
(i) voluntary forward market as required by consumers and generators; (ii) voluntary screen-based, half-hourly balancing market operating from 4 h
before despatch right through the particular half-hour in question; and (iii) mandatory settlement process for imbalances.
Under this arrangement generators and consumers who have contracted for physical deliveries of power in any given half-hour, through the forward or short-term market, would be responsible for self-despatching those contracts. Their only other responsibility would be to provide their &Final Physical Noti"cation'(FPN) to the ISO before the&gate closure'point has been reached, some four hours prior to each half-hourly despatch period. The ISO will assume full responsibility for any further contracting necessary to maintain system security until despatch is completed. This will be achieved partly by buying in ancillary services, probably under long term contracts similar to those which NGC now has for frequency response and black-start capabilities, and partly by buying and selling in the balancing market to cover any imbalances between noti"ed positions and actual demand and supply.
6The price that generators wish to be paid for an increase in output or consumers are willing to pay for an increase in demand.
7The price that generators are willing to pay for a decrease in output or consumers wish to be paid for a decrease in demand.
also the UK gas market. Here generators and consumers will be able to make location-speci"c bids and o!ers to ISO, presumably also on a screen-based system, for increments6and decrements7to their FPN positions. The balancing market will therefore create an explicit market mechanism for allocating the cost of maintaining an energy balance on the transmission system, and replace the complex and opaque process that NGC currently uses to calculate and allocate Energy Uplift. By applying a market price to imbalances, it is also hoped that this will make supply and demand much more responsive to short-term changes in the operational status of the system.
4. Modelling the Pool and bilateral mechanisms
We have developed anagent-based simulation(ABS) model of the wholesale market for electricity market in England and Wales which allows us to compare market prices, and the bidding strategies of individual generators under the di!erent trading arrangements. The key feature of this simulation approach is that it uses a micro-level, bottom-up, representation of the market with each generating "rm represented, at the level of its individual power plants, by a separate computer-generatedautonomous adaptive agent(&agent'). The agents are capable of developing their own bidding strategies, to explore and exploit the capacity and technical constraints of plant, market demand, and di!erent market clearing and settlement arrangements.
4.1. Modelling objective
The crucial focus of comparison is the Pool's day-ahead market versus the bilateral short-term market. We model both as a daily repeated auction and compare the market clearing prices set under the four di!erent combinations of trading, and settlement, arrangements set out in Table 1.
Clearly these are stylised models, ignoring much of the complexity of the real Pool day-ahead and bilateral short-term markets but they allow us to isolate the following key issues:
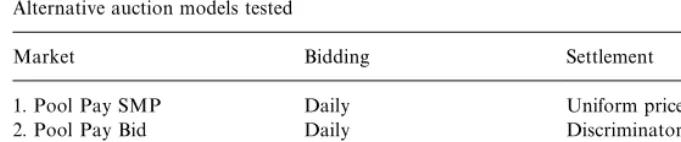
Table 1
Alternative auction models tested
Market Bidding Settlement
1. Pool Pay SMP Daily Uniform price
2. Pool Pay Bid Daily Discriminatory
3. Bilateral Pay SMP Hourly Uniform price 4. Bilateral Pay Bid Hourly Discriminatory
4.2. Modelling architecture
The ABS model we have developed has a trading environment, a set of agents, and an economic environment. The trading environment is a daily repeated auction upon which di!erent combinations of bidding, clearing and settlement arrangements, described above, are exogenously imposed along with any regula-tory controls on allowed agent bidding behaviour. Each agent represents one of the generating"rms operating in the Pool during 1998, and which is endowed with a portfolio of plants characterised by capacity, fuel type, e$ciency, avail-ability, etc. The economic environment de"nes the demand pattern for electric-ity, and the input costs, both of which are imposed exogenously as static variables.
4.2.1. The trading environment
At the start of each simulated trading day, each agent is allowed to submit one bid for each plant in its portfolio and we assume that all the expected available capacity makes a&"rm'bid for the whole day. Each bid is therefore linked to a speci"c plant capacity, which means that agents are, in e!ect, submitting"rm bid supply functions. This is consistent with the work of Klemperer and Meyer (1989), later used by Green and Newbery (1992) and Green (1996a) in their analysis of the bidding behaviour of generators in the Pool.
8See Sutton and Barto (1998) for a de"nition and fuller discussion of the many di!erent forms of reinforcement learning which have been developed.
9In all the simulations discussed here, agents draw their random percentage values from a uni-form distribution with a range$10% and a mean of 0% though we have tested other distributions with little e!ect o the relative level of prices among the auction mechanisms tested.
trading day, and even where separate hourly bids are submitted there is no opportunity to observe the outcome of these until trading is completed.
4.2.2. The agents
The agents, summarised in Appendix A, represent the di!erent generating
"rms, and centrally despatched plant capacities, marginal production costs, and expected plant availabilities, during 1998. These were synthesised from a range of public, and private, sources as well as our own estimates.
The ABS approach allows us to avoid making the usual restrictive assump-tions that are required by traditional economic analysis of imperfect competi-tion. Instead, the agents use simple internal decision rules, summarised in Table 2, that allow them to&discover'and&learn'strategic solutions which satisfy their pro"t and market share objectives over time. Taken together, these rules constitute what is essentially a naive reinforcement learning algorithm8 that seeks out and exploits successful bidding strategies while discarding unsuccess-ful bidding strategies. As a result, the behaviour of the simulated market is almost entirely emergent as it is created endogenously by the aggregate interac-tion between agents and their environment.
The agents'bidding strategies are therefore not speci"ed exogenously by the modeller but are developed by the agents themselves. The model also has the advantage of allowing bidding strategies to be observed for asymmetric bidders, right down to the individual plant level. ABS is therefore a distinctly bottom-up approach focussing on individual strategic decision-making behaviour, rather than top-down aggregate market behaviour.
Strategic learning is driven by each agent attempting to jointly satisfy the two objectives of:
(i) continuously increasing its own overall pro"tability, from one day to the next; and
(ii) reaching a target utilisation rate on its plant portfolio every day.
To reach these objectives, agents may follow either a&price-raising'strategy, by adding a random percentage to the bid(s) they submitted in the previous trading day or a&price-lowering'strategy, by subtracting a random percentage.9
Table 2
Summary of agent bidding rules and objectives
Rule 1. Self awareness
Agents receive feedback data from their own trading activities for the previous two trading days: (i) Plant avoidable costs of production
(ii) Plant bid prices (iii) Plant sales prices
(iv) Plant and total portfolio expected available capacity (v) Plant and total portfolio sales volume
(vi) Plant and portfolio rate of utilisation (vii) Plant and portfolio pro"t
(viii) Portfolio target utilisation (ix) Portfolio target pro"t
Rule 2: Information restrictions
Agents do not know the past, current, or future, actions of other agents or the state of the market.
Rule 3: Objective functions
Agents have common objectives for each new trading day which are to achieve: (i) At least their target rate of utilisation for their whole plant portfolio
(ii) A higher pro"t on their own plant portfolio, than for the previous trading day
Rule 4: Strategy selection
Agents submit bid price(s) for each plant in their portfolio, at the beginning of the current trading day, using decision criteria in the following order of precedence:
(i) If the target rate of utilisation was not reached across the portfolio, on the previous trading day, then randomly subtract a percentage from the previous day's bid price for each plant in the portfolio
(ii) If any plant sold output for a lower price than other plants across the portfolio, on previous trading day, then raise the bid price of that plant to the next highest bid price submitted (iii) If total pro"t did not increase across the portfolio, on the previous trading day, then
randomly add or subtract a percentage from the previous day's bid price for each plant in the portfolio
(iv) If pro"t and utilisation objectives were achieved across the portfolio, on the previous trading day, then repeat the previous trading day's decision
Rule 5. Strategy restrictions
Agents can follow any strategy on condition that the bid prices in their plant portfolio are always: (i) No less thanC0.00
(ii) No more thanC1000.00 (iii) Rounded to two decimal places
(iv) Higher for high marginal production cost plant than for low marginal production cost plant in the portfolio
point of view of the simulation, if an agent failed to reach its target utilisation rate on the previous trading day, then it lowers the bid price(s) on all of its plants for the current trading day. Though this response disregards the potential impact on pro"tability, and the success of previous strategies, the target utilis-ation rate is attached to an agent's portfolio, not to particular plant(s), so they are still free to explore a wide range of bidding strategies which will satisfy both pro"t and utilisation objectives. Finally, an agent can transfer a successful bidding strategy, from one of its plants, to all other plants in its portfolio. This favours agents with large plant portfolios as they naturally have more oppor-tunities to experiment with, identify and adopt successful bidding strategies than a single plant operator does. This is achieved by allowing agents to automati-cally raise the bid price on any plant, to the level of the next highest bid price submitted, if it sold its output for less the marginal sales price achieved in the portfolio on the previous trading day.
In practice each agent is continuously updating its pro"t objective, as the simulation progresses, always using the previous trading day's pro"t as a benchmark against which it compares the current day's pro"ts. By continuously updating their pro"t objective, at the end of each trading period, agents are forced to continuously compete against each other. As in the real world, not all the agents can increase their pro"ts inde"nitely and, at some point, a pro"t increase by one agent will cause a pro"t decrease for another agent. When an agent su!ers a pro"t decrease it is prompted to abandon its current bidding strategy and randomly look for a more successful one. When it eventually"nds a better strategy, which might mean taking pro"t from another agent, this would trigger a new strategy search by the a!ected agent, and so on.
A criticism of the proposed bilateral model is that less information will be available to participants than is currently available in the Pool. We have eliminated this potential informational di!erence in our model so that we can focus purely on the impact of alternative bidding and settlement arrangements. We do this by assuming that agents know everything about their own portfolio of plants, bids, output levels, and pro"ts, but nothing about other agents or the state of the market. Their ability to capture and retain data is very limited, they have no powers of strategic reasoning, and hence they exhibit a high degree of bounded rationality.
4.2.3. The economic environment
10Agents are modelled as data arrays in Excel 97 and manipulated with Visual Basic. This allows run speeds of approximately 8 min for 1000 working days (Pool), and 24 min per 1000 working days (bilateral model), on a standard desktop PC equipped with a 400 MHz Pentium processor and 128 MB of RAM.
We know that demand response to increasing prices is very low in the Pool day-ahead market, which is one of the major criticisms of it, because of the limited amount of demand-side bidding that occurs. Typically, about 750 MW of demand-side bids are usually submitted betweenC80/MWh and 250/MWh. An uncertain amount of private load management also occurs, which we assume accounts for another 4000 MW of demand response, which is also likely to be from industrial customers. For the purposes of our simulations, we have there-fore assumed a linear load-shedding response of 25 MW for everyC1 MWh that SMP rises aboveC75/MWh. Therefore, at a SMP ofC175/MWh we are assum-ing that a total of 2500 MW of demand-side response occurs. Our estimate of short-term demand-side elasticity is much lower than that used by Green and Newbery (1992), who assumed a load drop of 500 MW perC1/MWh. However, it is close to the empirical estimates of Patrick and Wolak (1997) who calculate demand elasticities between !0.1 and !0.3 for large industrial customers. Given that they contribute about 15,000 MW of demand in the Pool this would be equivalent to a load drop of 15}45 MW perC1/MWh on-peak on typical winter day. Appendix B shows the daily load pro"le, as it would be at prices belowC75/MWh.
5. Simulation results
Using the agents, demand curve and hedging pro"le above, we simulated 750 working days of trading under the four di!erent sets of trading arrangements, with summary statistics for each of the 24 h settlement periods calculated from the"nal 250 working days of data. For the Pool model this means that over 50,000 separate daily bids decisions were simulated, while the bilateral model simulates over 1.2 million hourly bids.10
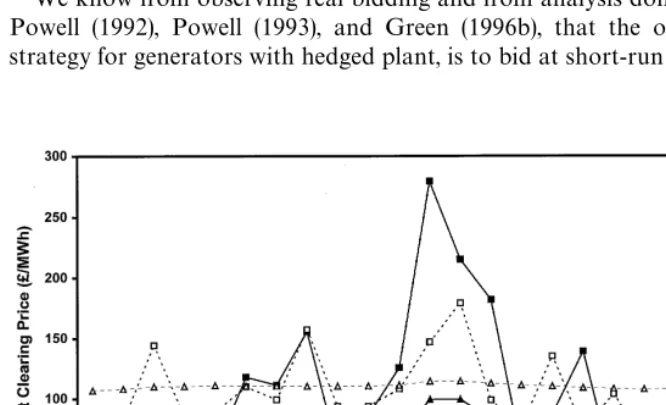
Fig. 2. Simulated market-clearing prices for alternative trading arrangements. Simulated market-clearing prices, for each of the four trading arrange-ments, are summarised in Fig. 2. These show that the Pool with Pay SMP settlement and single daily bids, as per the current trading arrangements, produced the lowest peak clearing price atC99.22. In contrast, Pay Bid settle-ment with and hourly bids, as per the bilateral model produced the highest peak clearing prices of C279.34. The two alternative sets of trading arrangements produced intermediate peak clearing prices of C147.05 for Pay SMP settle-ment with hourly bids of C147.05 and for Pay Bid settlement with daily bids ofC114.42.
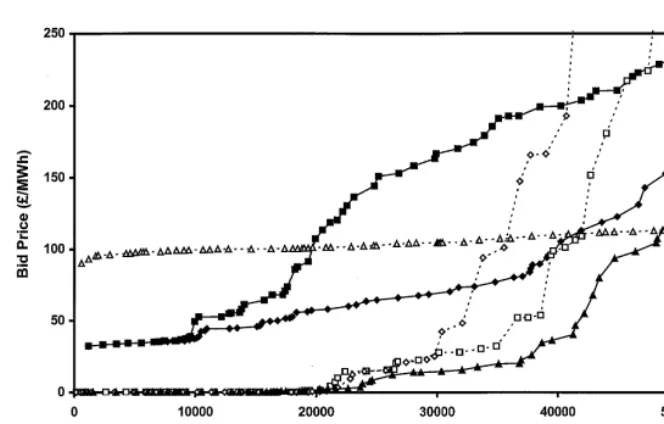
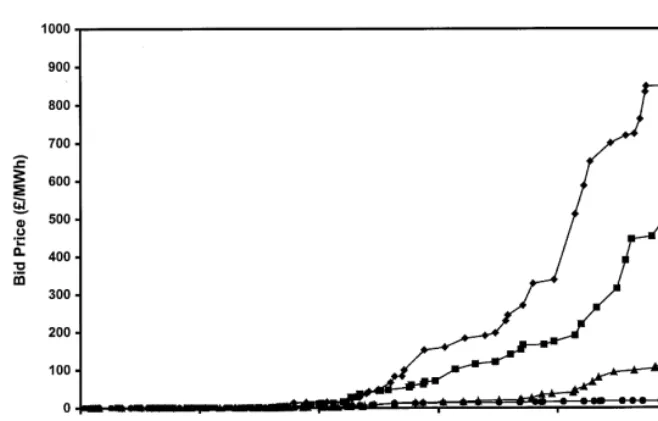
Fig. 3 shows the aggregate supply functions bid by agents under the four di!erent sets of trading arrangements. Both of the Pay SMP settlement simulations show most low cost plant is bidding at close to zero, a strategy seen in the real Pool day-ahead market, which is truly emergent from the model because this behaviour is not explicitly speci"ed in the agents'decision rules. In contrast, using exactly the same decision rules, agents quickly learn to bid a much #atter supply function, well above zero, when Pay Bid settlement applies. This gives us con"dence that the model is capable of successfully replicating both the actual, and potential, micro-level strategic behaviour in this market.
Fig. 3. Simulated supply functions for alternative trading arrangements.
Therefore, prices in the Pool day-ahead market do not re#ect purely competitive bidding, because forward contract cover limits generator's ability to exercise market power. In general, therefore, the higher the level of contract-ing, the lower the expected level of prices. We have been able to replicate these well-known "ndings, summarised in Fig. 4, by changing the target rate of utilisation for Eastern, PowerGen, and National Power. For both, the Pool day-ahead simulation, and the bilateral model simulation, prices fall as the target rate of utilisation (i.e. generators' desire for market share) rises.
The results, described above, seem to contradict OFFER's expectation that prices will fall as a result of the introduction of the bilateral model. Closer inspection of the bidding strategies of individual plants in our simulations reveals that this is due to two separate, but complementary, phenomena that result in:
(i) Pay Bid settlement increasing the risk of overbidding by baseload gener-ators, especially IPPs with small plant portfolios, which reduces competitive pressure on generators with mid-merit plant; and
Fig. 4. Impact of target utilisation rate on simulated supply functions for Pool Pay SMP.
Table 3
Sales weighted average o!-peak and on-peak bid prices under alternative trading arrangements
Generator Current pool Pool Pay Bid Bilateral Pay SMP Bilateral Model All hours All hours
O!-Peak On-Peak O!-Peak On-Peak
Eastern C23.30 C104.13 C16.25 C76.53 C54.34 C183.49
EDF C0.05 C98.53 C0.05 C0.05 C42.75 C52.68
IPP/Other C1.76 C98.46 C4.96 C0.68 C45.81 C71.78 Magnox Electric C0.62 C99.07 C1.02 C3.00 C35.66 C35.93 Mission Energy C38.67 C120.42 N/A C96.45 N/A C68.60 National Power C13.89 C101.69 C10.13 C65.47 C83.14 C164.83 Nuclear Electric C1.19 C83.89 C3.12 C19.81 C30.09 C28.41 Power Gen C12.59 C104.34 C5.97 C70.15 C51.21 C208.36 Scot'& Southern C1.65 C102.29 C0.37 C9.53 C43.25 C54.20 Scottish Power C13.94 C97.78 C25.30 C16.13 C47.00 C120.51
5.1. Analysis of Pay Bidversus Pay SMP ewect on price
Conversely, under Pay Bid settlement simulation, the sales weighted average bid price of baseload generators rises to a level similar to the mid-merit generators because they are being forced to bid closer to the market clearing price in order maximise their pro"ts. This change in behaviour is exactly what OFFER wants to encourage, rather than allowing baseload plant to just bid zero and leave the market price setting to mid-merit plant.
However, Table 4 shows that Eastern, National Power, and PowerGen produce a greater percentage of total output under Pay Bid than under Pay SMP settlement. It seems that moving to Pay Bid settlement does not increase competitive pressure on the marginal plant, as is hoped, rather it diminishes it, because the probability of baseload plant being underbid by mid-merit plant is increased. Baseload generators bid zero in the current Pool day-ahead market in order to eliminate this risk, and to guarantee that their plants keep running at all times. This reduction in market share under Pay Bid settlement for baseload generators is compounded by the fact that, on average, they are achieving a sales price which is approximately 10}15% lower than mid-merit generators. This suggests that baseload generators would have to shade their bids in order to ensure their plants were able to run continuously in the bilateral model. Although simulated market prices are higher under Pay Bid, suggesting all generators would bene"t the expense of consumers, mid-merit generators could gain disproportionately more because of their gain in market share and their higher average sales price.
These"ndings are consistent with the earlier conclusion that OFFER drew after its previous inquiry into trading arrangements when it noted that:
In sum, paying generators their bid prices would represent a major change which seems likely to have disadvantages in terms of increasing risks, particularly to smaller generators, without a strong likelihood that prices will be lower. In the longer term it could lead to higher prices. (OFFER, 1994).
5.2. Hourlyversus daily bidding ewect on price
Simulated prices for on-peak hours in the bilateral model are higher than in the Pool day-ahead market for Pay SMP settlement. A similar pattern emerges for Pay Bid settlement which shows that, regardless of the settlement method used, a shift to hourly bidding in the bilateral model produces a rise in price.
Table 4
Generator average daily output under alternative trading arrangements
Generator Current Pool Pool Pay Bid Bilateral Pay SMP Bilateral Model
MWh % Total MWh % Total MWh % Total MWh % Total
Eastern 92,994 9.72 88,307 9.41 87,329 9.30 87,227 9.28 EDF 45,326 4.74 40,017 4.26 45,303 4.83 44,585 4.74 IPP/Other 139,064 14.54 123,599 13.17 139,053 14.82 135,966 14.46 Magnox Electric 71,143 7.44 70,562 7.52 71,136 7.58 70,770 7.53 Mission Energy 11,823 1.24 39 0.00 7,673 0.82 12,072 1.28 National Power 207,048 21.65 220,804 23.52 203,007 21.63 204,319 21.74 Nuclear Electric 159,305 16.66 157,151 16.74 159,350 16.98 158,510 16.86 Power Gen 192,052 20.08 204,115 21.75 187,868 20.02 189,519 20.16 Scot'& Southern 22,969 2.40 20,779 2.21 22,957 2.45 22,471 2.39 Scottish Power 14,687 1.54 13,285 1.42 14,872 1.58 14,532 1.55
Bower,
D.
Bunn
/
Journal
of
Economic
Dynamics
&
Control
25
(2001)
561
}
592
on-peak and o!-peak. Moreover, under SMP settlement it seems that one generator can more easily dominate the price setting process, with hourly bidding, than with daily bidding. Daily bidding forces generators to try and optimise their bids horizontally, across 24 h, but with hourly bidding it seems they can more easily optimise, and perhaps even tacitly collude, in any given hour.
Economic theory tells us that "rms should try and charge more to those customers who are willing to pay more for their goods, by segmenting the demand curve and di!erentiating their product o!ering, hence extracting the consumer surplus that would be lost if a single price were charged. Dis-criminating between customers on the basis of their willingness to pay is very easy in the electricity market because domestic customers are almost entirely unresponsive to price but demand proportionately more during on-peak hours, while industrial customers are sensitive to price and demand proportionately more at o!-peak times. In this case, customers clearly signal their willingness to pay by the time at which they use the product. Allowing generators to bid signi"cantly di!erent prices, on the same plant, at di!erent times allows them to exploit this information. It seems that the bilateral model could disproportionately increase generator market power, especially during on-peak hours when demand is highest, raising demand weighted average prices signi"cantly. This could also signi" -cantly increases the risk of very large price spikes, if unexpected plant out-ages occur, and especially during very cold weather when plant margin is naturally low.
5.3. Validation against classical models
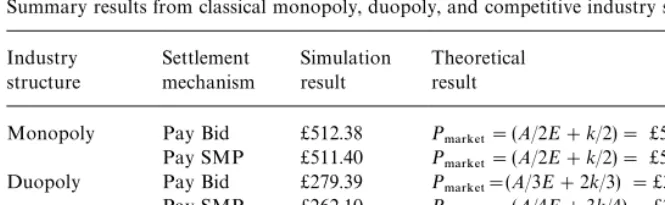
To test the validity of the results presented above, simulations of classical economic models of monopoly, duopoly, and perfect competition were also run. Table 5 summarises results from these alternative industry structure simulations with agents speci"ed as follows:
(i) a monopolist with one 50,0000 MW plant;
(ii) a duopoly of"rms each with one 25,0000 MW plant; and
(iii) a competitive industry with 50 "rms each running a single 1000 MW plant.
Demand is modelled as downward sloping demand curve of the form X"A!PE where X"demand, A"constant 50,000 MW, P"price, and E"50 MW/C1 demand response. In each simulation, all agents have target utilisation rates of 1% on the assumption that they will wish to produce at least some output. The marginal cost of production (k)"C10.00.
Table 5
Summary results from classical monopoly, duopoly, and competitive industry simulations Industry Monopoly Pay Bid C512.38 P
.!3,%5"(A/2E#k/2)"C505.00
Pay SMP C511.40 P
.!3,%5"(A/2E#k/2)"C505.00
Duopoly Pay Bid C279.39 P
.!3,%5"(A/3E#2k/3)"C340.00
Pay SMP C262.10 P
.!3,%5"(A/4E#3k/4)"C257.50
Competitive Pay Bid C10.02 P
.!3,%5"k"C10.00
Pay SMP C10.01 P
.!3,%5"k"C10.00
classical models there is a close match in each case. For monopoly and perfectly competitive simulations the choice of Pay SMP or Pay Bid makes no di!erence to the "nal market price and the expected classical model result is produced. However, for the duopoly simulations Pay SMP produces a lower market clearing price than Pay Bid though both remain well above marginal cost. This di!erence in outcomes between Pay SMP and Pay Bid replicates that is seen in the Pool and bilateral model simulations seen above.
6. Conclusion
We have shown that, where an oligopoly of bidders exists, their market power cannot be negated by a simple change to the auction mechanism, and we have shown that where bidders meet frequently, and repeatedly, the opportunity for tacit collusion is signi"cant. The classical economic model of a perfectly com-petitive market assumes that agents cannot adopt any strategy that is superior to bidding at or just below the marginal cost of the marginal capacity that is required to meet demand. The only way that agents are able to achieve higher prices, as they do in this model, is by collectively learning and enforcing more complex bidding strategies which allow them to tacitly collude and so maintain prices above marginal cost.
We have also shown that in these circumstances, revenues are not equivalent in multi-unit, multi-period, auctions because changing the auction mechanism had a signi"cant impact on market prices. Changing the biding procedure (i.e. daily to hourly bids) and the Settlement procedure (i.e. Pay SMP to Pay Bid) both induce a rise in prices. Precisely how big an impact each factor has depends on the demand in the particular settlement period and what combination of Bidding and Settlement procedures is in place. These results are at odds with the empirical studies of Treasury auctions, which show no consistent di!erence occurs in market prices under uniform-price and discriminatory auctions. They are also in con#ict with"ndings from other studies, including a number done on the Pool, which suggest that uniform-price auctions allow oligopolists to raise overall market prices by strategically bidding their marginal capacity. However, despite these apparent contradictions we believe that these results can be reconciled if close attention is paid to the impact of information asymmetry on agent behaviour.
Information in the bilateral forward markets attached to the England & Wales Pool, and many other commodity markets (e.g. rare metals where an oligopoly of producers also operates) is either not readily available or only after some considerable time lag. Moreover, anecdotal evidence from the new bilateral electricity market in Germany has emerged which shows that large generators do indeed have access to market information that other smaller operators do not have. This has resulted in individual trades being struck within minutes of each other at widely divergent prices suggesting that the traders involved did not have the same access to market price information. It is also true that there is some lagged price reporting in the German market but this information is not available in real time when the trades are being struck. Furthermore, this historic price data is reported by the major generators themselves (e.g. the SWEP and CEPI indices) and its accuracy cannot be veri"ed. There is no evidence to suggest that the accuracy, transparency, or timeliness of price data will be any better in the proposed bilateral model in England & Wales.
Broadly speaking, auction theory supports the view that increasing the amount of information available to bidders increases the e$ciency of the auction but only at the expense of making any collusive agreement between bidders easier to enforce. This view is also supported by many studies of imperfect competition which show that widespread advertising of prices by competitors, backed up by a price promise to match any lower o!er, is a com-mon means of maintaining price discipline. However, in the case study presented here it seem that more transparent publication of competitors' prices would increase competition in the bilateral model while not make any di!erence in the Pool. Large bidders can gain a signi"cant advantage where information is not published in a discriminatory auction but lose that advantage entirely in the uniform-price auction. It is this result which may help to explain the apparent observed equivalence of uniform price and discriminatory auctions in empirical studies of treasury auctions. These markets are among the most liquid"nancial markets in the world, and near real-time price reports are widely available from many news services. By making market price information widely, and instan-taneously available, especially where a parallel forward and secondary exists, prices in any auction should be equivalent. Ignoring the possibility of a squeeze on the forward market, or default risk, bidders should therefore be indi!erent between paying the appropriately discounted value of a security for delivery today or in a week's time. Joskow et al. (1996) who studied auctions of sulphur dioxide emission allowances also suggest revenue equivalence in the presence of forward or secondary markets. They discuss the private bilateral market, that has largely superseded the public auctions held by the Environmental Protec-tion Agency (EPA), and show that attempts to in#uence prices through strategic
In contrast, the Pool has an opaque forward market which lacks reliable, and timely, publicly available prices. Moreover, there is no after market because electricity must generally be consumed in the same instant that it is produced. Although a day-ahead price is widely published, generators and consumers can only get more extensive forward price data by engaging in regular trading activity. We are therefore, concerned that the bilateral model is being introduced without any formal regulatory provision to ensure market prices are made widely available, and that the lack of transparency currently only seen in the forward market would permeate the entire bilateral model. Our results also show that large generators would have an interest in preventing price transpar-ency because of the competitive (and regulatory) advantage it would a!ord them. In this respect, some consumers have complained that generators force them to pay a premium, over day-ahead prices in the forward market. The lack of transparency in the current forward market, combined with the fact that trading is on the basis of discriminatory pricing, is consistent with our"ndings that prices should be higher than in a corresponding uniform-price auction. As it stands, the bilateral model could therefore potentially leave the control of market price information, and hence market price itself,"rmly in the hands of the large generators.
Globally, annual sales of wholesale electricity amount to approximately $750 billion so, from an international perspective, the choice between bilateral and pool-based trading models for deregulated electricity markets is a crucial economic issue. In the US, various forms of bilateral model and pool-based trading coexist in di!erent regions and, if the Comprehensive Electricity Competition Act is passed, all states will soon have to make the choice. The European Union's Electricity Market Directive will have a similar impact, and purpose, in Europe but again leaves the choice of trading arrangements to individual states as does the National Electricity Market proposal in Australia. From these examples, it is clear that many countries and states have, or are about to, face complex decisions about what form of trading arrangements they should choose. The results presented here suggest that pool-based markets should produce lower prices than bilateral markets.
utilise the computational power of this approach for policy issues that have so far eluded more conventional economic methods of inquiry.
Appendix A. Agent speci5cation
Centrally despatched plant data taken from NGC Seven Year Statement 1997/98 (Figs. 3.4}3.6) and includes all plant operating by 31 December, 1997 with estimates of real operational capacity and reliability during 1998. Marginal fuel costs are based on open market prices prevailing during 1998. Long term,
Appendix B. Load pro5le based on NGC Winter Peak 1 December 1997
References
Back, K., Zender, J.F., 1993. Auctions of divisible goods: on rationale for the treasury experiment. Review of Financial Studies 6, 733}764.
Bank of England, 1995. Report of debt management review. Bank of England, Threadneedle Street, London EC2, http://www.bankofengland.co.uk.
Bank of England, 1999. Information Memorandum: Bank of England on behalf of The Lords Commissioners of Her Majesty's Treasury: HM Government Gold Auction Programme. Bank of England, Threadneedle Street, London EC2, http://www.bankofengland.co.uk/goldinfmem.pdf. Bartolini, L., Cottarelli, C., 1997. Designing e!ective auctions for treasury securities. Current Issues
in Economics and Finance 3, 9, Federal Reserve Bank of New York, http://www.ny.frb.org. Bikhchandani, S., Huang, C., 1993. The economics of treasury securities markets. Journal of
Economic Perspectives 7 (3), 117}134.
Bunn, D.W., Day, C., Vlahos, K., 1998. Understanding latent market power in the electricity pool of England and Wales. In: Pricing Energy in a Competitive Market. Electric Power Research Institute, 3412 Hillview Ave, Palo Alto, CA 94304, USA.
Cox, J., Smith, V., Walker, J., 1984. Theory and behaviour of multiple unit discriminative auctions. Journal of Finance 39 (4), 983}1010.
Das, S.R., Sundaram, R.K., 1997. Auction theory: a summary with applications to treasury markets, NBER Working Paper Series, No. 5873, National Bureau of Economic Research, Cambridge MA, http://www.nber.org/papers.html.
von der Fehr, N-H.M., 1991. An auction approach to the study of spot market competition in a deregulated electricity industry. Discussion Papers in Economics.
Eatwell, J., Milgate, M., Loeb, L., Newman, P., 1998. New Palgrave: A Dictionary of Economics. McMillan, New York.
Green, R.J., 1996a. Increasing competition in the British electricity spot market. The Journal of Industrial Economics XLIV(2), 205}216.
Green, R.J., 1996b. The electricity contract market. DAE Working Papers Amalgamated Series, No. 9616, Department of Applied Economics, University of Cambridge.
Green, R.J., Newbery, D.M., 1992. Competition in the British electricity spot market. Journal of Political Economy 100 (5), 929}953.
Helm, D., Powell, A., 1992. Pool prices, contracts and regulation in the British electricity supply industry. Fiscal Studies 13 (1), 89}105.
Hoare, J., 1995. The UK electricity market. In: Managing Energy Price Risk. Risk Publications, London.
Isaac, R.M., Walker, J.M., 1985. Information and conspiracy in sealed bid auctions. Journal of Economic Behaviour and Organization 6, 139}159.
Jegadeesh, N., 1993. Treasury auction bids and the Salomon squeeze. Journal of Finance 48, 1403}1419.
Joskow, P.L., Schmalensee, R., Bailey E.M., 1996. Auction design and the market for sulphur dioxide emissions. NBER Working Paper Series, No. 5745, National Bureau of Economic Research, Cambridge, MA, http://www.nber.org/papers.html.
Klemperer, P.D., Meyer, M.A., 1989. Supply function equilibria in oligopoly under uncertainty. Econometrica 57, 1243}1277.
Kreps, D., Scheinkman, J., 1983. Quantity precommitment and bertrand competition yield cournot outcomes. Bell Journal of Economics 14, 326}337.
McAfee, P., McMillan, J., 1987. Auctions and bidding. Journal of Economic Literature XXV(2), 699}738.
Milgrom, P., 1989. Auctions and bidding: a primer. Journal of Economic Perspectives 3, 3}22. Monopolies and Mergers Commission (MMC), 1996a. National Power and Southern Electric:
A report on the proposed merger, CM 3230 HMSO, London SW8 5DT.
Monopolies and Mergers Commission (MMC), 1996b. PowerGen and Midlands Electricity plc: A report on the proposed merger, CM 3231. HMSO, London SW8 5DT.
National Grid Company Plc (NGC), 1998. 1998 Seven Year Statement for the years 1998/9 to 2004/5. The National Grid Company Plc, National Grid House, Kirby Corner Road, Coventry, CV4 8JY.
Nyborg, K.G., Rydqvist, K., Sundaresan, S., 1997. Bidder behaviour in multiple unit auctions: evidence from swedish treasury auctions. IFA Working Paper, No. 257-1997, Institute of Finance and Accounting, London Business School, Sussex Place Regent's Park London NW1 4SA, http://www.lbs.ac.uk/ifa/research/working}papers/257.pdf.
Nyborg, K.G., Sundaresan, S., 1996. Discriminatory versus uniform treasury auctions: Evidence from when-issued transactions. Journal of Financial Economics 42, 63}104.
O$ce of Electricity Regulation (OFFER), 1994. Report on Trading Outside the Pool. OFFER Hagley House, Birmingham B16 8QG.
O$ce of Electricity Regulation (OFFER), 1998. Report on Pool Price Increases in Winter1997/98, O$ce of Electricity Regulation. OFFER Hagley House, Birmingham B16 8QG.
O$ce of Electricity Regulation. (OFFER), 1999. Pool Price: A Consultation Paper by O!er, O$ce of Electricity Regulation. OFFER Hagley House, Birmingham B16 8QG.
O$ce of Gas and Electricity Markets Regulation (OFGEM), 1999a. OFGEM consultation on rises in pool prices in July. OFGEM, 130 Wilton Road, London SW1.
O$ce of Gas and Electricity Markets Regulation (OFGEM), 1999b. The New Electricity Trading Arrangements, Vol. 1. OFGEM, 130 Wilton Road, London SW1.
Patrick, R.H., Wolak, F.A., 1997. Estimating the customer-led demand for electricity under real-time market prices, Preliminary Draft, http://www.stanford.edu/&wolak/
Powell, A., 1993. Trading forward in an imperfect market the case of electricity in Britain. The Economic Journal, 444}453.
Rothkopf, M.H., 1999. Daily repetition: a neglected factor in the analysis of electricity auctions. The Electricity Journal, 61}70.
Rothkopf, M.H., Harstad, R.M., 1994. Modelling competitive bidding: a critical essay. Management Science 40 (3), 364}384.
Simon, D.P., 1994. The treasury's experiment with single-price auctions in the mid-1970s: winner's or taxpayer's curse? Review of Economics and Statistics 76, 754}760.
Smith, C.W., 1990. Auctions: the Social Constriction of Value. University of California Press, Berkley, CA.
Sutton, R.S., Barto, A.G., 1998. Reinforcement Learning. MIT Press, Cambridge MA.
Taylor, A., 1999. Wholesale electricity prices to fall by at least 13%. Financial Times, No. 33977, Wednesday August 4 1999, p. 6, Financial Times Limited, London. http://www.ft.com. Tenorio, R., 1993. Revenue Equivalence and bidding behaviour in a multi-unit auction market: an
empirical analysis. Review of Economics and Statistics 75, 302}314.
Umlauf, S., 1993. An empirical study of the Mexican treasury bill auction. Journal of Financial Economics 33, 313}340.
Wang, J., Zender, J., 1994. Auctioning divisible goods. Working Paper, University of Utah. Wolfram, C.D., 1998. Strategic Bidding in a Multi-unit Auction: An Empirical Analysis of Bids to