MANAGEMENT OF ENVIRONMENTAL RISKS IN COASTAL AREAS
M. Caprioli a *, R.Trizzino b , R. Pagliarulo b, M. Scarano c, F. Mazzone c, A. Scognamiglio a,
a
Dept. DICATECh, Polytechnic of Bari, Bari, Italy – (mauro.caprioli, a.scognamiglio)@poliba.it b
CNR, IRPI, Bari, Italy – (r.pagliarulo, r.trizzino)@ ba.irpi.cnr.it c
University of Napoli “Parthenope”, Napoli, Italy – (f.mazzone, m.scarano)@uniparthenope.it
Commission IV, WG IV/7
KEY WORDS: Environment, Risk Management, GIS, UAV, Photogrammetry
ABSTRACT:
The present work deals with the assessment and management of environmental risk conditions in a typical costal area of Southern Italy. This area, located in the Salento peninsula, is subject to recurrent widespread instability phenomena due to the presence of steep rocky cliffs. Along the coast there are numerous beach resorts that are very crowded in the summer season. The environmental hazard deriving from the possible rock falls is unacceptably high for the people safety. Moreover, the land-based mapping of the dangerous natural structures is very difficult and time and resources expending. In this context, we carried out an UAV survey along about 1 km of coast, near the towns of San Foca, Torre dell’Orso and Sant’ Andrea ( Lecce, Southern Italy). The UAV platform was equipped with a photogrammetric measurement system that allowed us to obtain a mobile mapping of the fractured fronts of dangerous rocky cliffs. UAV-images data have been processed using dedicated software (Agisoft Photoscan). The total error obtained was of centimeter-order that is a very satisfactory result. The environmental information has been arranged in an ArcGIS platform in order to assess the risk levels. The possibility to repeat the survey at time intervals more or less close together depending on the measured levels of risk and to compare the output allows following the trend of the dangerous phenomena. In conclusion, for inaccessible locations of dangerous rocky bodies the UAV survey coupled with a GIS methodology proved to be a key engineering tool for the management of environmental risks.
1. INTRODUCTION
Over the last four decades Geographical Information Systems (GIS) have emerged as the predominant medium for graphic representation of geospatial data, including geotechnical, geologic and hydrologic information routinely used by geotechnical and geo-environmental engineers. Moreover, GIS makes it possible to mix or integrate information that would otherwise be difficult to associate through other means. Often, the hydro-mechanical conditions of geomaterials involved in instability phenomena within urban centres are not known. Often only a few geological, hydrogeological and mechanical measurements are available within the body of the unstable soil mass at the time of the failure from monitoring activities. After the landslide occurrence, the short time to take decisions during the state of emergency and the possible disastrous evolution of the landsliding phenomenon suggest to take advantage of the pre-existing territorial information. Geographical Information System (GIS), then, can represent a useful tool to provide a representative description of spatially variable soil conditions, that triggered the failure, and to collect information that can be used to design engineering structures for civil protection purposes. In this study, an application of the working strategy implemented in GIS environment for managing spatial geo-mechanical information has been proposed.
GIS allows unlimited forms of spatial data to be co-mingled, weighted and sorted with any number of physical or environmental factors. These data can also be combined with weighted political and aesthetic values to create hybrid graphic products capable of swaying public perceptions and decision making (Rogers et al., 2004).
Most soil maps were originally constructed on ortho-rectified aerial photos. Unmanned Aerial Vehicle (UAV) systems are increasingly seen as an attractive low-cost alternative or supplement to aerial and terrestrial photogrammetry due to their low cost, flexibility, availability and readiness for duty. In addition, UAVs can be operated in hazardous or temporarily inaccessible locations. The UAV is an acronym for Unmanned Aerial Vehicle, which is an aircraft with no pilot on board. These vehicles are remotely controlled, semi-autonomous, autonomous, or have a combination of these capabilities. The new terminology UAV photogrammetry describes a photogrammetric measurement platform, which operates remotely controlled (Eisenbeiss, 2008; Eisenbeiss et al., 2005). The combination of photogrammetric aerial and terrestrial recording methods using a mini UAV (also known as “drone”) opens a broad range of applications, such as surveillance and monitoring of the environment and infrastructural assets (Zhang, 2009; Caprioli et al., 2015).
In recent years, many researchers have focused on the impacts and interrelationships between factors controlling the erosional processes of rocky coasts (Griggs and Trenhaile, 1994; Sunamura, 1992; Trenhaile, 2002).
Factors controlling the instability processes depend on lithology, physical and mechanical properties, structural set up, discontinuity pattern and density, degree of weathering of rock masses, sea level changes/uplift, meteo-marine conditions, meteoric rains and climate, wind erosion, sea actions (wave motion, marine spray), thermal stresses and last but not least human activity. All these factors are responsible for present coast morphology and play an important role in the assessment of the retreating mechanism and the location of sites most susceptible to erosion. Although the force of wave action and rock mass strength are the main factors to be considered in coastal retreat processes, especially in coastal landslides and cliff recession, other factors often are decisive in shore platform down wearing and cliff retreat (Andriani et al., 2014).
These phenomena generated an environmental hazard for the population because along the coastal strip numerous beach resorts are located, that are very crowded in the summer season. There is a very very high risk of rock falls that undermines the physical safety of people. The aim of the present work is to experiment a speedy and effective tool for failure data collection and risk management.
2. GEOLOGICAL OUTLINE OF THE SALENTO PENINSULA
The Salento peninsula is the southernmost part of Apulia which represents the foreland domain of the southern Apennines to the
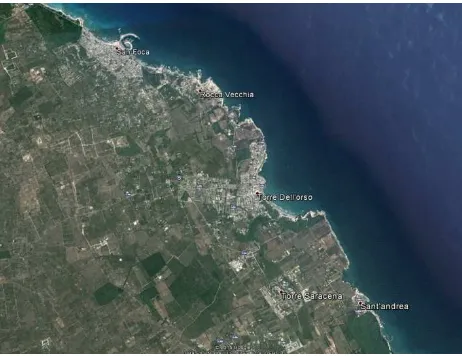
Figure 1. The study area (Google Earth)
west and the Dinarides to the east. This region belongs to the Mesozoic Apulia carbonate platform, located on the southwest margin of the Adriatic block in the central Mediterranean. The geological structure of Salento comprises a Variscan basement covered by a thick Mesozoic carbonate sequence overlain by thin deposits of Neogene and Quaternary age. The most ancient rocks of this cover are related to several transgressions after the definitive emergence of the Apulian carbonate platform at the end of the Cretaceous. Middle Pleistocene deposits crop out widely in the area at different altitudes and belong to several stratigraphic units. The youngest deposits belong to the Marine Terraced Deposits and are related to a staircase of marine
terraces arranged between 160 m and the sea level which marks the local coastal landscape.
The rocky cliffs are made up of fine-grained, intensely fractured and weathered calcarenites, belonging to the geological Formation of “Calcareniti del Salento” (Plio-Pleistocene). The general fabric is referred to a relatively loose packing calcarenite, poorly to moderately sorted with a self-supporting framework of skeletal grains of marine organisms and with sub- rounded and rarely sub-angular terrigenous lithic fragments of limestones. Bioclasts comprise fossil remains such as benthic foraminifera, bryozoa, lamellibranchs, gastropods, echinoderms, calcareous algae and serpulid worm tubes. All the calcarenite types reveal an open porosity with intercomunicating voids, as the narrow throats at grain contacts are not closed by the irregular crystalline cementation. It is possible to classify these calcarenites as lithobioclastic grainstone and biolithoclastic packstone.
The main types of erosional and landslide processes observed along the coastal stretch investigated are related to slides, falls and topples. The waves attack the weak part of the rock and leave the resistant areas to form the different features. Processes of erosion are more active along joint systems. Wave energy causes gouge or hollow forming caves and arches which are continually widened by erosion and weathering. The roof becomes too heavy and collapses forming a stack. The stack is then eroded and may form a stump. Falls of blocks and big slices of rocks are triggered by undercutting at the base of the cliff. Tension cracks and fractures control their detachment. Toppling of blocks mainly occurs along failures parallel to the coastline causing cliff retreating (Fig. 2).
Figure 2. Toppling failure mechanism (after Hoek et al., 1977)
3. DATA COLLECTION
The Apulian coast, with the exception of the Tremiti islands, extends for about 940 km and consists of high rocky cliffs areas for 33% of its extension.
In the study area the environmental hazard derives from the possibility of rock falls. So, to assess the risk level of this kind of coastal area it is necessary to map the structural set up, the discontinuity pattern and density and the degree of weathering of rock masses. Moreover, in this context the land-based mapping of the dangerous natural structures is very difficult and time and resources expending.
laser scanners (Briggs, 1974; Smith et al., 1990; Zischinsky et al., 2000).
To test the reliability of UAV data acquisition we carried out an UAV survey along about 1 km of coast, near the towns of S.Foca, Torre dell’Orso and San Andrea ( Lecce, Southern Italy). The UAV platform was equipped with a shot measurement system that allowed us to obtain a mobile mapping of the fractured fronts of dangerous rocky cliffs.
3.1 The UAV survey
The UAV survey was executed on 22th January 2015 in collaboration with SAL Engineering (Modena, Italy) which carried out three flights at about 69 m of altitude with a “esacopter” equipped with a brushless electric motor and a GNSS satellite positioning system.
Nearly 1053 nadiral and inclined images have been taken with CANON EOS 550D cameras with 18 mpx APS-C sensor. In Table 1 the technical features of the cameras mounted on the platform are specified, whereas in Table 2 the specifications of the flights are reported.
Cameras Resolution Focal Length
Pixel Size Pre- calibrated Canon
EOS 550D (25 mm)
5184 x 3456
25 mm
4.4036 x 4.4036 um
NO
Table 1. Cameras mounted on the vehicle
Number of images: 1053 Flying altitude: 69.2571 m Ground resolution: 0.0106382 m/pix Coverage area: 0.0655779 sq km
Table 2. Flight specifications
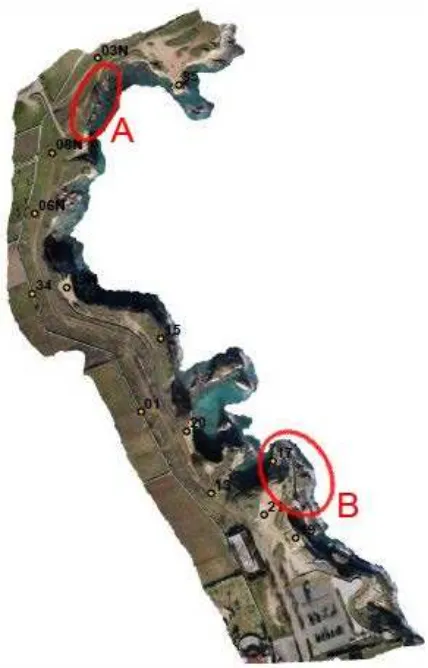
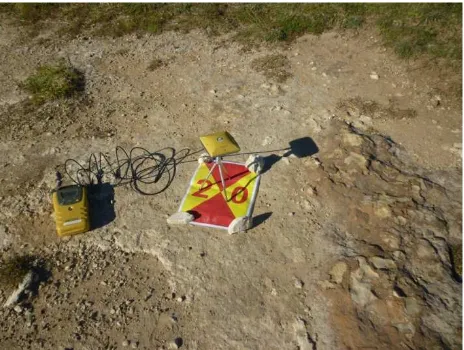
Thanks to the GPS-Position-Hold technology a framework of 10 Ground Control Point (GCP) has been set on the study area and, for internal use and further error checking, 3 more points (check points) were collected using dual frequency Trimble GPS receivers. The location of Ground Control Point (GCP) and surrounding check points are reported in Figure 3.
Next Tables 3 and 4 show the location errors of GCP and Check points. Note that the total error obtained is in the order of centimeter that is a very satisfactory result.
Label X error Y error Z error Error 01 0.003912 -0.007111 -0.001639 0.008280 03N -.001863 -0.000717 -0.000876 0.002180 06N -.009810 0.007450 -0.003736 0.012872 15 -.005640 -0.004398 0.017697 0.019087 17 0.002842 -0.006080 -0.004569 0.008119 19 0.004529 0.014796 0.013495 0.020532 20 0.009807 -0.004052 -0.008285 0.013463 21 -.004756 -0.004852 -0.011466 0.013328 34 0.008306 0.005744 0.002214 0.010339 35 0.001356 -0.000489 -0.000960 0.001731 Total 0.006042 0.006745 0.008600 0.012488
Table 3. Ground Control Point location errors (m)
Figure 3. Orthophoto of the surveyed area with GPC location
Label X error Y error Z error Error 08N 0.010654 -0.007635 -0.011089 0.017169
13 0.008762 0.0087 0.010332 0.016119 19N -0.006440 0.001394 -0.011438 0.013200 Total 0.008789 0.006746 0.010963 0.015587
Table 4. Check Point location errors (m)
4. DATA MODELLING AND GIS
A GIS is very effective at recognizing and analysing spatial relationships between mapped features. In order to model aerial surveyed data combining them with other kinds of data, such as geologic maps, we imported the UAV and geo-structural information in GIS layers, to form maps that can display trends or predict various responses of the dangerous rocky cliffs to climatic changes (Burrough, 1986).
A major goal of real-time monitoring was to enable discernment between relatively low risk slope creep from higher-risk accelerating motion, which usually precedes catastrophic detachment.
5. RESULTS
After the field survey, the collected data have been processed with computation methods of visible-surface representation (Terzopoulos, 1988; Watson et al., 1985).
The image processing has been carried out with Agisoft PhotoScan dedicated software. As a result, starting from 1053 nadiral and inclined images, a cloud of 1226867 tie-points with a 0.0106382 m/pix ground resolution was calculated.
The output data have been digitized and georeferenced, and easily put into a GIS and ortho-rectified.
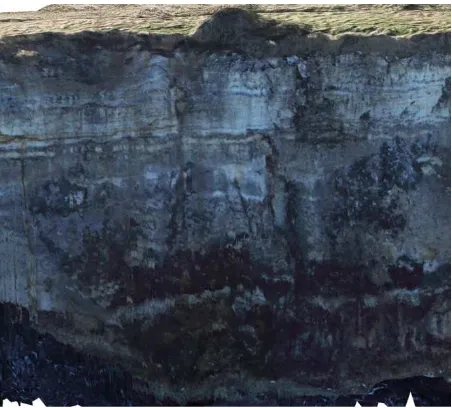
In Figure 4 the orthophoto of a coastal strip of the rocky cliff is shown (zone A in Figure 3). The processed image highlights the presence of a longitudinal fracture that heavily risks the stability of the rocky blocks.
Figure 4. Orthophoto of the study area A (marked in Fig. 3)
Figures 5, 6, and 7 show details of the ortho-projections of the rocky front. Note the presence of an arched cavity (Fig. 5), generated by the erosional processes that affect the entire coast, and of a crumbling block (Fig. 6).
Figure 5. Orthophoto with an arched cavity
Figure 6. Detail of the tumbledown mass
Figure 7. Details of the discontinuity line
In the next step of analysis, the LAS data obtained from AGISOFT PhotoScan have been imported in ArcGis environment. With ArcGis 10.3 a LAS data set has been created. The LAS data have been handled using ArcScene 10.3 and LAS tools (e.g. LAS-clip) provided by RapidolassoGmbH software.
After obtaining the digital model of the coastline (Oliver, 1990), it is possible to extract the “features” of structural evidence within the geomorphological evolution and then to evaluate instability and rock fall risks.
Another interesting component of GIS is its ability to produce pleasing graphics that convey analyses to decision makers and the public at-large. Results are shown in the following.
Figures 8 and 9 refer to another investigated area (area B in Fig. 4) that in the summer season is very popular with bathers so it represents a dangerous zone for people safety. Figure 8 is an axonometric view of the point clouds and Figure 9 shows the 3D model obtained. Note the access stairs and the little beach very popular with young people.
Figure 8. 3D point cloud
Figure 9. 3D model from LAS data
Figure 10 shows the LAS point cloud imported in ArcGis with 9 classes of elevation.
Figure 10. LAS point cloud imported in ArcGis (9 classes)
In order to highlight the structural features responsible for the instability of rock masses different layers have been created including different metric characteristics (Figs. 11 and 12). As an example in Figure 13 three layers are marked: open fractures
(red lines), surface unevenness (yellow line) and crumbling mass (green line).
Figure 11: GIS layers with open fractures
Figure 12. Unevenness line (yellow), fractures (red) and crumbling mass (green)
Analysing these measurements from a geo-structural point of view, the evaluation of the risk of collapse of rock masses can be made and therefore it will be possible to assess the conditions of risk for the safety of people.
Furthermore, establishing a reference topographic network based on Ground Control Points (Fig.13,) that can be assumed stable with respect to the crumbling phenomena, the methodology presented here allows for in time monitoring the evolution of the dangerous elements and then the prediction and prevention of the natural “disasters”.
As a matter of fact, georeferencing the UAV survey, with the same or better accuracy, it is possible to measure the changes of the characteristic parameters and to identify the trend of dangerous phenomena.
6. CONCLUSIONS
To cope the objective of predicting the mechanical behaviour of the entire unstable zone, the authors tried to integrate the available information layers (historical, geographical, geo-lithological, hydrological, geo-mechanical) into a multi-layered map to support the civil protection decisions during the emergency time after the landslide movement.
As for the field survey, UAV photogrammetry opens various new applications in the close range domain, combining aerial and terrestrial photogrammetry, but also introduces low-cost alternatives to the classical manned aerial photogrammetry. Major advantages of UAVs compared to manned aircraft systems are that UAVs can be used in high risk situations without endangering a human life and inaccessible areas, at low altitude and at flight profiles close to the objects where manned systems cannot be flown.
For management of environmental risks in dangerous inaccessible areas UAV survey proved to be an essential tool for data collection, whereas GIS method of data handling enhanced the geotechnical interpretation and allows us to advise clients, as city planning commissions, with some reasonable measure of reliability.
In the study case, the UAV survey output has been imported and handled with GIS routines in order to analyse and report on situations as they develop in the field. The resulting procedure, bringing together UAV survey data and geological information on the structural features that generate the hazard, allows for in time monitoring the evolution of the dangerous phenomena and then it reveals to be a key engineering tool for the prediction and prevention of natural “disasters”. As a matter of fact, GIS allows obtaining a “social value composite map”, which can be then compared with maps showing geologic and other natural hazard considerations to convey risk analyses to decision makers and to the public at-large.
Finally, the procedure proposed here enhances the recognition of higher-risk accelerating motion, which usually precedes catastrophic detachment, and could supply an “alert” procedure that allows the authorities to organize evacuations and other safety measurements.
7. REFERENCES
Andriani, G. F., Lollino, P. and Pagliarulo, R., 2014. Rock cliff instability mechanisms and erosional processes along the Adriatic Salento coast (Southern Italy). Rend. Online SGI, 31, 182 DOI: 10.3301/ROL.2014.140.
Briggs,I.C., 1974. Machine contouring using minimum curvature. Geophysics, 39: 39–48.
Burrough,,P.A., 1986. Principles of Geographical Information Systems for Land Resources Assessment. Oxford University, New York.
Caprioli, M., Mancini, F., Mazzone, F., Scarano, M., Trizzino, R., 2015. UAV Surveys for Representing and Document the Cultural Heritage. XIII International Forum “Le Vie dei
Mercanti” Heritage and Technology. Aversa-Capri, Italy, June 11-13, 477-484.
Eisenbeiss, H., 2008. The Autonomous Mini Helicopter: A powerful Platform for Mobile Mapping. In: The International Archives of the Photogrammetry, Remote Sensing and Spatial Information Sciences, ISPRS Congress, Beijing, China, XXXVII. Part B1, 977-983.
Eisenbeiss, H., Lambers, K., Sauerbier, M. and Zhang, L., 2005. Photogrammetric documentation of an archaeological site (Palpa, Peru) using an autonomous model helicopter. International Archives of Photogrammetry, Remote Sensing and Spatial Information Sciences, CIPA, Torino, Italy, Vol XXXIV-5/C34, 238-243.
Griggs, G. B., and Trenhaile, A.S., 1994. Coastal cliff and platform. In: Carter, R.W.G., Woodroffe, C.D. (Eds.), Coastal Evolution. Cambridge Univ. Press, Cambridge, UK, 425–450.
Hoek, E., and Bray, J., 1977. Rock Slope Engineerin., 1st Edition IMM, London.
Oliver, M. A., 1990. Kriging: A Method of Interpolation for Geographical Information Systems. International Journal of Geographic Information Systems, 4: 313–332.
Rogers, J.D., and Luna, R., 2004. Impact of Geographical Information Systems on Geotechnical Engineering. Proc. Fifth International Conference on Case Histories in Geotechnical Engineering, New York, NY, April 13-17.
Smith, W. H. F., Wessel P., 1990. Gridding with continuous curvature splines in tension. Geophysics, 55: 293–305.
Sunamura, T., 1992. Geomorphology of Rocky Coast. Wiley, New York, p. 302.
Terzopoulos,D., 1988. The computation of visible-surface representations. IEEE Transactions on Pattern Analysis and Machine Intelligence, 10: 417–438.
Trenhaile, A.S., 2002. Rock coasts, with particular emphasis on shore platform. Geomorphology 48, 7–22.
Watson D. F., Philip, G. M., 1985. A Refinement of Inverse Distance Weighted Interpolation. Geoprocessing, 2:315–327.
Zhang, C., 2009. Photogrammetric processing of low-altitude UAV imagery. ASPRS 2009 Annual Conference, Baltimore, Maryland (U.S.).