PRIORITISING CARBON SEQUESTRATION AREAS IN SOUTHERN QUEENSLAND
USING TIME SERIES MODIS NET PRIMARY PRODUCTIVITY (NPP) IMAGERY
A. Apan a,b, L.A. Suarez Cadavid a,b, L. Richardson c, T. Maraseni b
a School of Civil Engineering and Surveying, University of Southern Queensland - (apana, luz.suarezcadavid)@usq.edu.au b International Centre for Applied Climate Science, University of Southern Queensland – [email protected]
c Condamine Alliance - [email protected]
KEY WORDS: Carbon, MODIS, Net Primary Productivity, Ecosystem, Change, Spatial, Dynamic
ABSTRACT:
The aim of this study was to develop a method that will use satellite imagery to identify areas of high forest growth and productivity, as a primary input in prioritising revegetation sites for carbon sequestration. Using the Moderate Resolution Imaging Spectroradiometer (MODIS) satellite data, this study analysed the annual net primary production (NPP) values (gC/m2) of images acquired from 2000 to 2013, covering the Condamine Catchment in southeast Queensland, Australia. With the analysis of annual rainfall data during the same period, three transitions of “normal to dry” years were identified to represent the future climate scenario considered in this study. The difference in the corresponding NPP values for each year was calculated, and subsequently averaged to the get the “Mean of Annual NPP Difference” (MAND) map. This layer identified the areas with increased net primary production despite the drought condition in those years. Combined with key thematic maps (i.e. regional ecosystems, land use, and tree canopy cover), the priority areas were mapped. The results have shown that there are over 42 regional ecosystem (RE) types in the study area that exhibited positive vegetation growth and productivity despite the decrease in annual rainfall. However, seven (7) of these RE types represents the majority (79%) of the total high productivity area. A total of 10,736 ha were mapped as priority revegetation areas. This study demonstrated the use of MODIS-NPP imagery to map vegetation with high carbon sequestration rates necessary in prioritising revegetation sites.
1. INTRODUCTION
In the short term, the fastest way to reduce carbon emissions and increase carbon sinks on land is to stop deforestation and expand the area of forests (Houghton, 2014). Reforestation or afforestation is seen by many as one of the best natural means to sequester carbon and minimise the impact of rising CO2 levels (Cseke et al, 2013). The establishment of forests, either by natural or artificial methods, provides equally important benefits to soil, water and biodiversity conservation. Consequently, revegetation is becoming an integral component of natural resource planning and management (e.g. Manjaribe et al., 2013).
Identifying and prioritising suitable sites for reforestation and afforestation is crucial. However, the tasks involved can be complex – it entails the assessment of various factors pertaining to the biophysical and socio-economic characteristics of the area (Apan and Peterson, 1997). For revegetation tasks that seek to optimise carbon sequestration benefits, the identification of areas of high forest growth and productivity is essential. Different plants and vegetation communities respond to diverse growth factors as defined by their genetic traits and external environment (see, for example, Cseke et al, 2013).
Net primary productivity (NPP) represents the net amount of carbon added to plant biomass per unit of space and time (Liu et al., 1999). Over a region with varying climatic types and edaphic characteristics, the spatial and temporal variability of NPP can significantly vary. Thus, it has the potential to be used as a dataset to quantify growth and productivity of forest areas.
The aim of this study was to develop a method that will use satellite imagery to identify areas of high forest growth and
productivity, as a primary input in prioritising revegetation sites for carbon sequestration. Specifically, the objectives of this study were to a) identify regional ecosystems that exhibited increased interannual net primary production (NPP) despite the decrease in interannual rainfall, and b) to map carbon sequestration areas that will be prioritised for revegetation efforts.
2. STUDY AREA
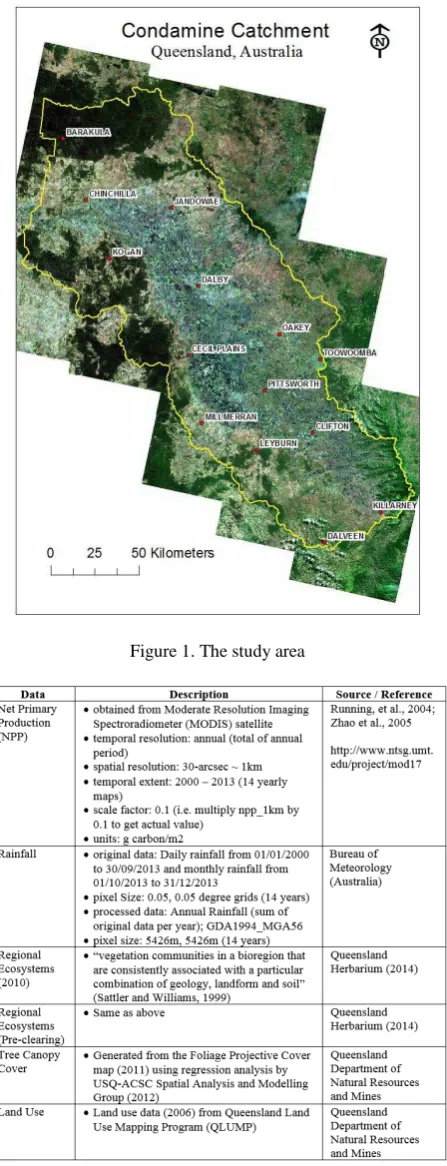
The study area covers the Condamine Catchment (Figure 1). The catchment is located west of the Great Dividing Range in southern Queensland, covering an area of 24,434 km2. The area has a highly variable subtropical climate, with average annual rainfall of 682-955mm, and average temperatures ranging from 3°C to 30°C.
The vegetation in the basalt hills is dominated by mountain coolibah (Eucalyptus orgadophila), narrow-leaved ironbark (Eucalyptus crebra) and silver leaf ironbark (Eucalyptus melanophloia). In soils associated with sandstone areas, patches of brigalow (Acacia harpophylla), poplar box (Eucalyptus populnea), ironbark, bulloak (Allocasuarina luehmannii) and cypress pine (Callitris rhomboidea) are common. The extensive use of the area for agriculture and pasture has resulted in the loss of much of the original vegetation.
3. RESEARCH METHODS
3.1. Data acquisition
Digital maps relevant to the pre-identified variables were acquired from various data custodians, of which a total of 6 map
layers were generated (Table 1 and Figure 2). Since datasets were received from disparate sources, in various formats and extent, it became essential to perform various pre-processing techniques. The tasks included projection and coordinate transformation, clipping, vector-to-raster conversion, feature selection, reclassification, etc. The datasets were processed using ArcGIS 10.2 with Spatial Analyst extension.
Figure 1. The study area
Table 1. Spatial datasets used for the study
Figure 2. MODIS NPP image (1km x 1km cell size) of the study area. Values in units of g carbon/m2, with a scale factor of 0.1.
3.2. Data processing and analysis
The main data processing and analysis steps conducted in this study is presented in Figure 3.
Identification of Dry, Normal and Wet Years Rainfall
Data
Nor al to Dry
Transition Years
MODIS NPP (MOD17)
NPP Map Layers of
Nor al to Dry
Transition Years
Map of A ual NPP
Differe ce AND Map of Mea of A ual NPP Differe ce MAND
Map of Increased NPP (Increased Carbon
Sequestration) Regional
Ecosystems (Current)
Regional Ecosystems (Pre-Clearing)
Land Use
Tree Canopy Cover
Categorised into Levels of Carbon Sequestration
Regional Ecosystems with Increased Carbon Sequestration
Pre-clearing Extent of Regional Ecosystems with
Increased Carbon Sequestration
Suitable Land Use for Revegetation
Suitable Tree Canopy Cover for Revegetation
Priority Revegetation Areas for Carbon
Sequestration
Figure 3. Main data processing and analysis steps conducted in this study
The rainfall datasets covering the Condamine Catchment area, for the period 2000-2013, were downloaded from the Bureau of Meteorology web site. The total (sum) of rainfall values for
each year were calculated to produce 14 layers (2000-2013) of
close to the 14-year average were called “normal” years.
Figure 4. Mean of annual rainfall. Values above and below the average (627 mm)
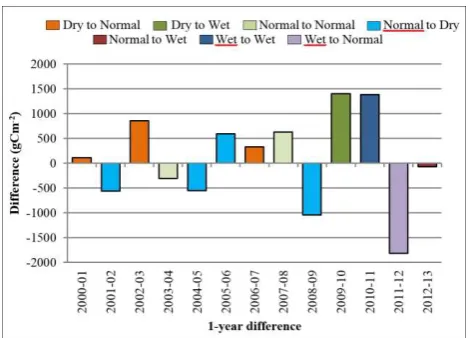
Different transitions between two (2) years of rainfall regimes were identified to represent the future climate scenario considered in this study: “normal to wet”, “normal to dry”, “dry to normal”, “dry to wet”, etc. This study identified and selected
the “normal to dry” transitions (i.e. 2001-2002, 2004-2005, and
2008-2009).
Using Moderate Resolution Imaging Spectroradiometer (MODIS) satellite imagery products, this study analysed the annual net primary production (NPP) values (gC/m2) of 1-km grid images acquired from 2000 to 2013.
The “Annual NPP Difference” (Figure 5) for the selected
transition years (i.e. 2001-2002, 2004-2005, and 2008-2009) were calculated to determine the relative changes in the NPP values that vary spatially depending on vegetation/land cover types. Then, the mean (average) value of the “Annual NPP
Difference” was derived to produce the “Mean of Annual NPP
Difference” (MAND) map.
This MAND map can be interpreted as follows: zero value
means “no change”; negative value means “increased NPP”;
and positive value means “decreased NPP”. For this study, all
the grid cells with negative values (i.e. the areas with increased net primary production, or those sites with high carbon sequestration rates) were selected. Furthermore, this MAND map was categorised into 3 classes (1=high; 2=medium; and
3=low) using Jenk’s optimisation technique available in
ArcGIS.
A major focus of this study was to identify which vegetation communities would exhibit increased NPPs despite the decline in annual rainfall. Conceptually these are the resilient vegetation areas that would show relatively high forest growth and productivity despite drought condition. For this purpose, Regional Ecosystems (RE) maps (Queensland Herbarium, 2014) were used. Regional ecosystems are “vegetation communities in a bioregion that are consistently associated with a particular combination of geology, landform and soil” (Sattler and Williams, 1999).
Figure 5. Annual NPP Difference. Zero value means “no change”, negative value means “increased NPP” and positive
value means “decreased NPP”
Consequently, the “Mean of Annual NPP Difference” (MAND) map and current regional ecosystems (RE) map were combined using “combinatorial overlay” in ArcGIS. This allowed the identification of regional ecosystems areas that demonstrated higher NPP values despite the reduction in rainfall. With that information, those RE classes (vegetation communities) were identified in the “pre-clearing” RE map to identify the estimated original extent of vegetation before 1750 (i.e. pre-European).
The output map from the above process, which carried the selected information on vegetation communities of pre-clearing extent, was overlaid with other thematic maps to refine the mapping of priority areas. Land use map was used to identify those areas unsuitable for revegetation (i.e. cropping lands, built-up area, water bodies, etc.), while the tree canopy cover map was used to identify the non-forested (or non-tree) areas by masking out those sites with ≥ 20% canopy cover. This process is sometimes called “sieve mapping”, where selection criteria (variables) were imposed to filter out unsuitable areas.
4. RESULTS AND DISCUSSION
The results have shown that there are over 42 regional ecosystem (RE) types and 62 Pre-clearing RE types in the study area that exhibited positive vegetation growth and productivity despite the decrease in annual rainfall. However, seven (7) of these RE types represents the majority (79%) of the total high productivity area. Those REs that dominate (Table 2) the priority areas include the following:
Dichanthium sericeum and/or Astrebla spp. grassland on alluvial plains;
Eucalyptus orgadophila open woodland on Cainozoic igneous rocks;
E. populnea woodland on alluvial plains;
Acacia harpophylla and/or Casuarina cristata open forest on alluvial plains; and
E. populnea woodland with A. harpophylla and/or C. cristata on alluvial plains.
Most of these identified ecosystems represent those areas that are located on alluvial plains, characterised by their relatively
flat lands adjacent to rivers and creeks, with variable soil types dominated by cracking clays and deep uniform clays. The relatively higher amount of water in the soil profile in these areas could possibly explain their positive growth despite the reduction in rainfall.
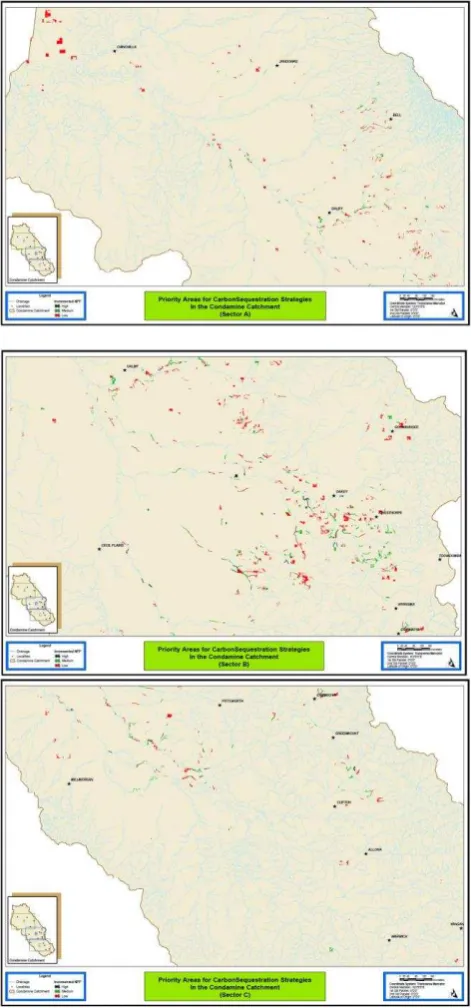
Figure 6. Priority revegetation areas for carbon sequestration
This study mapped 10,736 ha of carbon sequestration (revegetation) priority areas, representing 0.44% of the total 2.4 million ha catchment area (Figure 6). This low figure was expected since land uses unsuitable for revegetation, such as cropping lands, built-up area, water bodies, etc., were excluded and rendered totally unsuited for the purpose of this study. The candidate areas were further refined by the tree canopy cover criterion (i.e. exclude those with ≥ 20% canopy cover), as it was assumed in this study that priority be given to areas without tree
cover. Therefore, within this methodical framework, it is possible to include or exclude other factors, as desired.
Table 2. Area-ranked regional ecosystems (RE) with increased NPP during drought years.
5. CONCLUSION
The effective use of time-series MODIS-NPP imagery, combined with other thematic maps, enabled the development of analytical framework to identify and map vegetation communities with high carbon sequestration rates. Such information provided the impetus to successfully pursue site suitability assessment needed in prioritising revegetation areas.
ACKNOWLEDGEMENTS
We thank the Australian Federal Government (specifically the then Department of Climate Change and Energy Efficiency) for providing funding support for this project. The Condamine Alliance provided some datasets used in this study.
REFERENCES
Apan, A. and Peterson, J. 1997. Site Suitability of Reforestation Projects: A Post-Facto GIS-based Evaluation in the Philippines. Asian Journal of Environmental Management, 5 (2), pp. 109-123.
Cseke, L. J., Wullschleger, S.D., Sreedasyam, A., Trivedi, G., Larsen, P.E., and Collart, F.R., 2013. Carbon Sequestration. In: Genomics and Breeding for Climate-Resilient Crops, Vol. 2, DOI 10.1007/978-3-642-37048-9_12, Springer-Verlag, Berlin Heidelberg.
Houghton, R.A. 2012. Land management options for mitigation and adaptation to climate change. In: Global Environmental Change, Springer Science+Buisness Media, Dordrecht, pp. 389-398.
Liu, J., Chen, J.M., Cihlar, J., Chen, W., 1999. Net primary productivity distribution in the BOREAS region from a process model using satellite and surface data. Journal of Geophysical Research, 104 (D22), pp. 27735–27754.
Manjaribe, C., Frasier, C.L., Rakouth, B. and Louis, E.E., 2013. Ecological Restoration and Reforestation of Fragmented Forests in Kianjavato, Madagascar. International Journal of Ecology, pp. 1-12.
Queensland Herbarium, 2009. Survey and Mapping of Pre-clearing Vegetation Communities and Regional Ecosystems of Queensland, Version 6.0b (November 2009). Department of Environment and Resource Management, Brisbane.
Queensland Herbarium, 2014. Regional Ecosystem Description Database (REDD). Version 8.1 (April 2014). Queensland Department of Science, Information Technology, Innovation and the Arts, Brisbane.
Running, S., R. R. Nemani, F. A. Heinsch, M. Zhao, M. Reeves, and H. Hashimoto, 2004. A continuous satellite-derived measure of global terrestrial primary production. BioScience. 54(6), pp. 547-560.
Sattler P.S, and Williams, R., 1999. The Conservation Status of Queensland’s Bioregional Ecosystems. EPA, Brisbane.
USQ-ACSC Spatial Analysis and Modelling Group, 2012. Mapping and Analysis of Nature and Land Asset Health for the Condamine Catchment, Final Report Submitted to Condamine Alliance, Toowoomba, Queensland.
Zhao, M., F. A. Heinsch, R. R. Nemani, and S. W. Running (2005). Improvements of the MODIS terrestrial gross and net primary production global data set. Remote Sensing of Environment, 95, pp. 164–176.