SPATIO-TEMPORAL ANALYSIS OF UHI USING GEO-SPATIAL TECHNIQUES:
A CASE STUDY OF AHMEDABAD CITY
Anjana Vyas
1, B. Shastri
2, Y. Joshi
21
Professor and Acting Dean, Faculty of Technology, CEPT University, Ahmedabad, Gujarat, India
,
[email protected]
2Students,
Faculty of Technology, CEPT University, Ahmedabad, Gujarat, India
.
Commission VIII
KEYWORDS:
Urban Heat Island (UHI) , Mono window algorithm, Land Surface Temperature (LST), NDVI, Urban Thermal
Field Variance Index (UTFVI)
ABSTRACT
As per the current estimates, nearly half of the world’s population lives in the cities, by 2030 it is cal
culated to increase to 70%.
This calls for a need of more sustainable structure in the urban areas as to support increase in the urban population. Urban Heat
Island is one such conspicuous phenomenon which has its significance at local regional and also at the global levels. It is a
micro-scale temperature variation between urban and rural areas, in which urban area are warmer compare to surrounding rural area. The
temperature difference between the urban and the rural areas are usually modest, averaging less than 1°C, but occasionally rising
to several degrees when urban, topographical and meteorological conditions are favorable for the UHI to develop. It is defined as
the phenomena where in the occurrence of surface and atmospheric modifications due to the urbanization causes modification in
the thermal climatic conditions which results into warmer areas as compared to the surrounding non urbanized areas, particularly
in night. In that case urban built forms such as buildings, roofs, pavements etc. absorb more solar heat/radiation and remain warmer
throughout the day time and slowly release energy during night time. The two major causes are rapid urbanization and
anthropogenic heat generated due to transport and industrial activities. Urban Heat Island is a crucial subject for global environment.
Urbanization has significant effects on local weather and climate. Among these effects one of the most popular is the urban heat
island, for which the temperatures of the central urban locations are several degrees higher than those of nearby rural areas of
similar elevation. Satellite data provides important inputs for estimating regional surface albedo and evapo-transpiration required
in the studies related to surface energy balance.
The phenomenon of UHI affects environment and population in so many ways it can also be considered as an active element that
cause vulnerabilities to human health, the marginal population affected largely as the natural environment is their only home or
their main shelter. Furthermore elderly people also affected in greater amount as their weakening immunes system. Major effects
of UHI on environment include: a) Air Quality, b) Energy consumption and c) Human health
To study the causes and effect of UHI of any urban area, the first step is to demarcate the spatial distribution of UHI and its intensity
over different time period of the day as well as difference in the temperature of urban area with the surrounding rural areas.
Secondly, study of land use land cover change in the area also helps in identifying causes of heat accumulation for particular region.
After marking up of intensity, analysis of different zones for understanding the relationship between UHI and urban morphological
features can be done which further became suggestive towards planning of urban center that mitigates the effect of UHI. Mainly
two approaches are there to demarcate UHI study as:
Field data collection and observations
Remote sensing data analysis
For a long period of time observations from interior of the city and outwards of it can analyze by a climatic methods, by observing
many days as well as many times of a day continuously to analyze the daily variation law of the heat island effects. As the city is
for its developmental approaches may cover an area of hundreds of square kilometers, the ground observation data is not able to
provide enough detail about the urban heat island distribution characteristics. The most precise method is the Satellite Remote
Sensing method. The UHI phenomenon can be analyzed by using the thermal infrared data obtained meteorological satellite
sensing. The atmospheric attenuation can be corrected for the remote sensing data by use of meteorological soundings and ground
observation data. Ideally the heat island effect over a city is not same for any other city.
Satellite images from AVHRR Advanced Very High Resolution Radiometer) or ENVISAT AATSR provides thermal infrared data
and comparatively easy to acquire, process and analyze. In the case of Ahmedabad city, land cover changes over the time is to be
studied by classifying the image and then temperature can be derived by using a quadratic regression model from Malaret at al.
(1985). Band 6 produces the images that show the relative difference emitted thermal energy that correlate in part with the effects
of solar heating on surface of varying composition and orientation. The surface temperatures are suitable to detect UHI at Urban
canopy level. Nichol (1996) found that surface temperatures extracted are moreover similar to the actual ambient air temperatures
recorded.
1.
INTRODUCTION
In recent years urban heat waves, extreme droughts and forest fires have been reported with increasing frequency, disturbing the environmental dynamics and the quality of life in the affected cities. These changes affect the absorption of solar radiation, surface temperature, evaporation rates, storage of heat, wind turbulence and can drastically alter the conditions of the near-surface atmosphere over the cities (Mallick et al., 2008).
Urban Heat Island (UHI) term was coined in the year 1940 which refers to the atmospheric warmth of the city as compared to the countryside. Traditionally, UHI is measured at the standard screen height which is 1-2 meter above the ground below the mean roof height of the city. The structures and the land covers of the urban and rural areas are different which causes the UHI effect. The city's structure is rough attributed to the high raised buildings and the soil is impervious because of the construction material spread across the soil and vegetation cover of the city. The human induced release of moisture and heat also contribute to the UHI effect of the city (Stewart and Oke, 2012). The natural surface energy and radiation balance gets disturbed by such activities making the cities warmer (Oke,1982, Lowry and Lowry, 2001).
The urban heat island (UHI) is a phenomenon whereby urbanization and density of anthropogenic structures and activities increase the earth surface and atmospheric temperature. The ever increasing earth's population has introduced numerous environmental changes such as deforestation, desertification, loss of biodiversity or warming due to greenhouse gases. Causes such as carbon dioxide emissions due to industrial processes, transportation and likewise activities, materials of related to buildings, roads and other infrastructure, and the changed morphology of the surface have distorted the energy and water exchanges along with the airflow (Sue Grimmond, 2007).
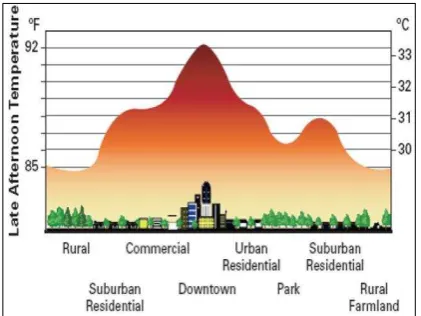
The asphalt roads and highways, being black, absorb significant amount of electromagnetic radiations and hence heat up which later radiates heat into the relatively cold night sky (Berdahl and Bretz, 1997). The geometric effects such as the height of the buildings which provide multiple surfaces for reflection and absorption of sunlight- "the urban canyon effect", the blocking of wind are the other reasons for formation of UHI. Many forms of pollution also tend to alter the radiative properties of the atmosphere (Oke, 1982). These are a few reasons that cause difference in temperature between the rural and urban areas.
Figure 1: UHI general trend
The main cause of the urban heat island is modification of the land surface by urban development which uses materials which effectively retain heat. Waste heat generated by energy usage is a
secondary contributor. As population centers grow they tend to modify a greater and greater area of land and have a corresponding increase in average temperature. The lesser-used term heat island refers to any area, populated or not, which is consistently hotter than the surrounding area (Glossary of Meteorology, 2009)
Using remote sensing techniques, it is possible to analyze the thermal and environmental information gathered by earth observation satellites to produce maps of the urban surface temperature, land use and vegetation index, which can help identifying areas that are susceptible to greater risk in case of occurrence of these weather anomalies. The purpose of this study is to analyze the spatial and temporal variation of land surface temperature with respect to the changing land cover, for Ahmedabad city.
2. DATA AND METHODS
2.1. Study area and data
Ahmedabad is located at 23.03°N 72.58°E in western India at an elevation of 53 metres (174 ft) from sea level on the banks of the Sabarmati river, in north-central Gujarat. It covers an area of 464 km2. Ahmedabad is the administrative headquarters of the Ahmedabad district with a population of more than 5.8 million and an extended population of 6.3 million; it is the fifth largest city and seventh largest metropolitan area of India. Ahmedabad is located on the banks of the River Sabarmati, 32 km from the state capital Gandhinagar.
For conducting the study satellite data of LANDSAT-5 TM (Jan. 4, 1999; Jan. 31, 2009; Jan. 14, 2011; May 23, 1999; May 16, 2009; May 6,2011) have been used.
All images bands 1–5 and 7 have a spatial resolution of 30 m, and the thermal infrared band (band6) has a spatial resolution of 120 m for Landsat 5 TM.
Figure 2: Study area
2.2. Image Processing
The LANDSAT-5 TM data was processed with layer stacking and the LST and other related parameters like NDVI and LULC were retrieved in order to study the spatio-temporal UHI effect over Ahmedabad city.
webpage that provides values for Transmittance, Upwelling Radiance, and Downwelling Radiance, for
Landsat data. (http://atmcorr.gsfc.nasa.gov/).
(1) Where,
CVR2 = atmospherically corrected cell value as radiance CVR1 = Cell value as radiance
L↑ = Upwelling Radiance L↓ = Downwelling Radiance τ = Transmittance
ε = Emissivity (typically 0.95)
Next, the radiance values hence obtained were converted into Kelvin values (At Sensor Brightness Temperature-TB). By applying the inverse of the Planck function, the temperature values can be derived as :
TB = K2 / ln (K1 / Lλ + 1) (2)
Where,
TB = at sensor brightness temperature, K1 = 607.76 W/m2 .Sr µm, K2 = 1260.56 K
2.3. Derivation of LST from Landsat 5 TM imagery
Urban heat island effect studies with LST derived from Landsat TM 5 data have been widely conducted. In 2001, Qin et al. proposed the mono-window algorithm for retrieving LST from Landsat TM 5 data. Based on thermal radiance transfer equation, the mono-window algorithm only requires three parameters - emissivity, transmittance and effective mean atmospheric temperature - to retrieve LST from Landsat TM 5.
τ = the total atmospheric transmissivity of the thermal band
ε (Emissivity)= 1.0094 + 0.047 ln (for NDVI ranging from 0.157 to 0.8)
2.4. Derivation of NDVI from Landsat 5 TM imagery
NDVI from Landsat-5 TM is calculated from reflectance measurements in the red and near infrared (NIR) portion of the spectrum. The formula for NDVI is given by:
NDVI=NIR–Red / NIR+Red (4)
The Normalized Difference Vegetation Index (NDVI) is one of the most widely applied vegetation indices. Normalized difference vegetation index [NDVI] is used to measure and monitor plant growth, vegetation cover and biomass production. Theoretically, NDVI values are represented as a ratio ranging in value from -1 to 1. A dense vegetation canopy (0.3 to 0.8), Soils (0.1 to 0.2) Reflects near-infrared spectral somewhat larger than the red spectral, Clear Water (very low positive or even slightly negative) low reflectance in both spectral bands.
2.5. Retrieval of land use/cover patterns
The Landsat-5 TM datasets were broadly classified into different classes of Built-up, Non Built-up, Water body and Vegetation. The process was run using ENVI 4.8, unsupervised classification.
3. RESULTS AND DISCUSSION
3.1. Spatio-temporal analysis of land use/cover patterns in Ahmedabad city
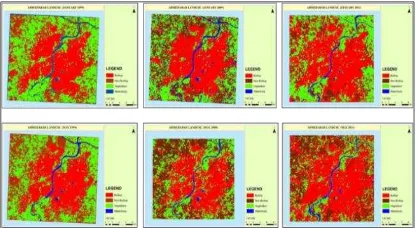
Landuse Landcover information for Ahmedabad city within the AMC(Ahmedabad Municipal Corporation) limit was retrieved from Landsat-5 TM data. This LULC classification was done for all datasets. The validation of the classification was done by the LULC file obtained from AMC and checked (Fig.3) . The classified data of May 2011 retrieved from Landsat-5-TM data was found to match with the former. Due to the seasonal change, the area under water-body and vegetation was observed to be decreased from January to May for all the three respective years. It was also observed that the area under non built up category increased in the month of May as compared to the month of January. No major changes were observed in the class built-up. However when considering the temporal pattern of LULC, the percentage area under considering the temporal pattern of LULC, the percentage area undervegetation, water body and the non built up was observed to decrease from 1999 to 2011, while the percentage of urban area showed a great rise (table 1).
Figure 3: Land use maps for January and May month of three different years
Table 1: statistics of LULC for January and May of different years
Temporal Land Use January 1999,2009,2011(%)
showed a great rise (table 1).were observed to decrease in percentage from 40% to 26%, 16% to 15% and 3.85% to 2.2% respectively.Spatially, an increasing urban growth was observed in the western and south-eastern parts of the city, with a decrease in vegetation in the same patch. The reasons for urban growth in both areas are mainly due to increased commercial and residential development in western areas of Ahmedabad, and industrial area development/expansion in the south eastern patch.
3. 2. Spatio-temporal analysis of NDVI calculated for the Ahmedabad city
In order to study the spatio-temporal changes in LST and the UHI effect, study of NDVI parameter becomes important. It allows determining the density of green on a patch of land based on observation of the distinct colours (wavelengths) of visible and near-infrared sunlight reflected by the plants. As seen in case of land use, the percentage of area under vegetation was found to decrease over time from 1999 to 2011.
On observing the NDVI parameter, a gradual decrease from 1999, 2009 to 2011 was observed in its value, from 0.24, 0.26 and 0.25 respectively. Spatially observing, higher NDVI values of about 0.4 to 1 were observed in the south western part and east northern parts of Ahmedabad. While the central areas, with dense urban areas, eastern and southern parts with high industrialization were observed to have very low NDVI values.
Figure 4: Spatio- temporal analysis of NDVI
Table 2: statistics of NDVI for January and May of different years
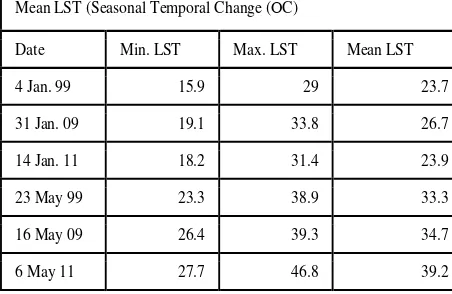
Mean LST (Seasonal Temporal Change (ОC)
Date Min. LST Max. LST Mean LST
4 Jan. 99 15.9 29 23.7
31 Jan. 09 19.1 33.8 26.7
14 Jan. 11 18.2 31.4 23.9
23 May 99 23.3 38.9 33.3
16 May 09 26.4 39.3 34.7
6 May 11 27.7 46.8 39.2
3.3. Spatio-temporal analysis of Land Surface Temperature patterns for Ahmedabad city
Land Surface Temperature can provide important information about the surface physical properties and climate which plays a role in many environmental processes (Dousset & Gourmelon, 2003). Land
Surface Temperature is the radiative skin temperature of land surface. LST is determined by the land surface energy balance and varies rapidly because of the low thermal inertia of the land surface.
LST may relate to the uppermost vegetation canopy or be a mixture of canopy and ground surface temperatures. It is how hot the
“surface” of the Earth would feel to the touch in a particular location.
From a satellite’s point of view, the “surface” is whatever it sees when it looks through the atmosphere to the ground. It could be snow and ice, the grass on a lawn, the roof of a building, or the leaves in the canopy of a forest. Thus, land surface temperature is not the same as the air temperature that is included in
the daily weather report
(http://earthobservatory.nasa.gov/GlobalMaps/view.php?d1=MOD 11C1_M_LSTDA]
Land Surface Temperature was computed using the Mono window algorithm for both winter and summer months of 1999, 2009 and 2011. Temporally, the mean surface temperature was observed to increase by about 1.5ᵒ to 2ᵒC, from about 28.5ᵒC in 1999, to 30.7ᵒC in 2009 and 31.6ᵒC in 2011. Also the range of minimum and maximum temperature showed an increase over time (table 4), thus indicating increased temperatures and an onset of Urban Heat Island effect. Spatially, the mean LST changes over time were found to be directly related to change in the LULC and NDVI.
Figure5: Spatio- temporal analysis of LST
Table 3: statistics of LST for January and May of different years
Table 4: Statistics of LST change for the years 1999, 2009 & 2011
Table 3 shows the minimum, maximum and mean surface temperature values for the months of January and May 1999, 2009 and 2011. Figure 6 represents the mean temperatures during January and May for all the three years, thus allowing to observe the trend of increasing or decreasing surface temperature. The winter months were observed to have more or less similar LST profiles, while in the month of May, increasing temperature trends from 33.3ᵒC in May 1999, to 34.7ᵒC May 2009 and 39.2ᵒC in May 2011 were observed. Thereafter mean LST was retrieved at Ahmedabad zone level in order to find out the comparatively higher temperature zones of the city.
Figure 7: Graph showing the spatio - temporal change in LST for the years1999, 2009 and 2011.
Table 5: Zonewise mean LST change for the years 1999, 2009 and 2011
Figure 8: Graph showing Zonewise LST for January and May for the years1999, 2009 and 2011
Table 6: Zonewise LST for January and May for the years1999, 2009 and 2011
On observing figure 7 and 8, table 5 and 6, it was found that South, East and New west zones had higher temperatures over all the three years and in both the seasons as compared to the other zones. The reason being increased industrial development in both South and East zone, which contribute to dense urban built-up (material
emissivity) and heavy pollution, thereby leading to higher temperatures and building of an Urban Heat Island zone. In case of New west zone, most of the areas are comprised of open lands that are now being constructed upon by residential and commercial plots. Keeping in mind the emissivity and reflective properties of the soil and sand, it adds on to higher temperatures in that area. On the contrary, the West, North, Airport and Central zones were found to be much cooler as compared to the Figure 8: Zone wise Mean LST plots for January and May 1999, 2009 and 2011 respectively Table 11: Zonewise Mean LST changes in January1999, 2009 and 2011 respectively Table 12: Zonewise Mean LST changes in May 1999, 2009 and 2011 respectively former. The reason being dense vegetation or more green cover in case of the West, North and Airport/ Cantonment zones, along with comparatively less urban/built-up density as compared to the other zones like central, south, and east zones respectively. In case of central zone of Ahmedabad (Old Ahmedabad), despite of maximum builtup density and minimum green cover, lower temperatures have been observed over the three time periods. The main reason in this case is observed to be building material property, building structures and height and roads types, all in turn affecting the amount of incoming solar radiation absorbed. The existence of Sabarmati river nearby the central and west zone, could also help in modifying the overall temperatures there.
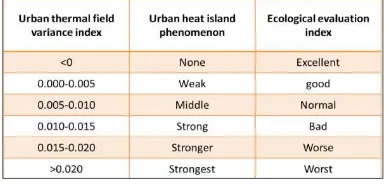
3.4. Urban Thermal Field Variance Index (UTFVI):
Figure 8:Temporal change in UTFVI values from 1999, 2009, to 2011
Table 7: Source- Urban Expansion in Wuxi City and Heat Island Response by RS Analysis
Two extreme levels of ecological evaluation had appeared for Ahmedabad city i.e. the excellent (<0) and the worst (>0.02). Temporally- based on UTFI and above results, the UHI phenomenon was found to increase quantitatively from 1999 to 2011 from weak to strong (Good to worst). Spatially, as observed in above results, the Southern and Eastern parts, followed by peripheral areas of New West Zone were the most UHI prone areas. Industrialization being the reason in former case, while large chunks of open land being the reason in NewWest.
4. CONCLUSIONS
NDVI values, the overall vegetation cover was observed to convert to open land or urban, thus impacting the surface temperature of those areas. From the ecological evaluation index calculation using the UTFVI classification, it was noted that over time, from 1999 to 2011, Ahmedabad showed an overall increase in the urban heat island phenomenon from normal/good to worst eco–environment, which strongly calls for more reasonable city layout and urban development plan in future.
ACKNOWLEDGEMENT
The objective, Climate Change, Variability and its Impact on Urban Heat Islands for Ahmedabad City, was funded under collaborative Pro
gramme to Study the Impacts of Climate Change on Human, Natural and Spatial Environments by the MoES.
REFERENCES
Berdahl P. and S. Bretz. 1997. Preliminary survey of the solar reflectance of cool roofing materials. Energy and Buildings 25:149-158.
Dousset, B. & Gourmelon, F., 2003. Satellite multi-sensor data analysis of urban surface temperatures and landcover, ISPRS Journal of Photogrammetry and RemoteSensing. 58, (1-2), 43-54
Glossary of Meteorology (2009). "Urban Heat Island". American Meteorological Society. Retrieved 2009-06-19
I.D. Stewart and T.R. Oke, 2012 Local Climate Zones for urban temperature studies
Javed Mallick, Yogesh Kant1 and B.D.Bharath1. Estimation of land surface temperature over Delhi using Landsat-7 ETM+, J. Ind. Geophys. Union ( July 2008 ),J. Ind. Geophys. Union ( July 2008 ).
Lowry, W. P., 1977: Empirical estimation of the urban effects on climate: A problem analysis. J. Appl.Meteor., 16, 129–135.
P. P. Lowry II, 2001: The Biological Environment. Vol. 2, Fundamentals of Biometeorology: Interactionsof Organisms and the Atmosphere. Peavine,680 pp. Ludwig, F.
Sue Grimmond, 2007 Urbanization and global environmental change: local effects of urban warming, The royal geographical society 83-88
T. R. Oke (1982). "The energetic basis of the urban heat island". Quarterly Journal of the Royal Meteorological Society 108 (455): 1–24.