MULTI-TEMPORAL ASSESSMENT OF LYCHEE TREE CROP STRUCTURE USING
MULTI-SPECTRAL RPAS IMAGERY
K. Johansen a, *, T. Raharjo a
a Remote Sensing Research Centre, School of Earth and Environmental Sciences, The University of Queensland, St Lucia, QLD
4072, Australia - [email protected], [email protected]
Commission VI, WG VI/4
KEY WORDS: RPAS, Multi-spectral, Lychee, Pruning, Tree structure, Change detection
ABSTRACT:
The lychee tree is native to China and produce small fleshy fruit up to 5 cm in diameter. Lychee production in Australia is worth >$20 million annually. Pruning of trees encourages new growth, has a positive effect on fruiting of lychee, makes fruit-picking easier, and may increase yield, as it increases light interception and tree crown surface area. The objective of this research was to assess changes in tree structure, i.e. tree crown circumference, width, height and Plant Projective Cover (PPC) using multi-spectral Remotely Piloted Aircraft System (RPAS) imagery collected before and after pruning of a lychee plantation. A secondary objective was to assess any variations in the results as a function of various flying heights (30, 50 and 70 m). Pre- and post-pruning results showed significant differences in all measured tree structural parameters, including an average decrease in: tree crown circumference of 1.94 m; tree crown width of 0.57 m; tree crown height of 0.62 m; and PPC of 14.8%. The different flying heights produced similar measurements of tree crown width and PPC, whereas tree crown circumference and height measurements decreased with increasing flying height. These results show that multi-spectral RPAS imagery can provide a suitable means of assessing pruning efforts undertaken by contractors based on changes in tree structure of lychee plantations and that it is important to collect imagery in a consistent manner, as varying flying heights may cause changes to tree structural measurements.
1. INTRODUCTION
Lychee is a popular fruit often used for dessert dishes, particularly in Asia, due to its juicy flesh and sweet taste. As reported by Lan (2014), 2.6 million tonnes of lychee was produced worldwide in 2014 with leading producers being China, India, Thailand, Taiwan, Nepal, and Bangladesh. While these countries are located in the northern hemisphere, Australia has the advantage of harvesting lychees in the northern hemisphere “off season”, i.e. December - March (Menzel and Waite, 2005; Papademetriou and Dent, 2002). According to an annual report by Horticulture Innovation Australia (2016), lychee production in Australia in 2014/2015 was 2.781 tonnes, and it was worth AUD 21.3 million. Good planting and production management are required to further increase production.
Such tasks include crop monitoring for assessing growth, stresses, pests, yield, and the state of fertiliser, water, or nutrient condition, irrigation, and post-harvesting handling such as tree pruning (Li-gang et al., 2012; Papademetriou and Dent, 2002). Pruning of trees encourages new growth, has a positive effect on fruiting of lychee, makes fruit-picking easier, and may increase yield, as it increases light interception and tree crown surface area. Remote sensing has the ability to be used for these monitoring tasks and provide multi-temporal information on tree structure and changes of these over time. However, as many lychee plantations are relatively small (1-100 ha), the use of high spatial resolution satellite and airborne imagery becomes cost-prohibitive.
The fast development of Remotely Piloted Aircraft Systems (RPAS) in the last decade is now offering an alternative to satellite and airborne based remote sensing (Bagheri, 2016).
RPASs are generally light-weight, easy to handle, low-cost, suitable for autonomous data collection, and highly flexible, allowing remotely sensed imagery to be collected at any time for smaller areas (< 1 km2) under suitable weather conditions (Zhang & Kovacs, 2012). Hence, RPAS imagery is well suited for collecting remotely sensed imagery on a frequent basis at low costs for lychee plantations. The mapping of tree structure such as tree height and crown size is essential, as tree structure can be used as an indicator for plant growth, biomass, yield, and for assessing pruning practices (Panagiotidis et al., 2016). As high spatial resolution imagery is required for assessing the structure of individual tree crowns, RPAS imagery is ideally suited for this task.
The objective of this research was to assess changes in tree structure, i.e. tree crown circumference, width, height and Plant Projective Cover (PPC), using multi-spectral RPAS imagery collected before and after pruning of a lychee plantation. A secondary objective was to assess any variations in the results as a function of various flying heights (30 m/4.1 cm pixels, 50 m/6.5 cm pixels and 70 m/8.8 cm pixels). While RPAS imagery has been used in many agricultural settings, no published literature exists on the use of RPAS imagery for assessing the tree structural changes of lychee plantations caused by pruning practices. Obtaining tree structural quantitative information on pruning practices may be used to assess pruning efforts undertaken by contractors as well as providing information that may be related to production and yield.
2. STUDY AREA
The study area was a private lychee plantation located 25 km southeast of Brisbane, Queensland, Australia (Figure 1). The lychee trees grown belong to the Kwai May Pink cultivar and The International Archives of the Photogrammetry, Remote Sensing and Spatial Information Sciences, Volume XLII-2/W6, 2017
were between 15 to 17 years of age besides a small number of newly replanted trees. The area has an elevation of 150 m above mean sea level and an average monthly mean temperature ranging from 15.1°C to 26.0° C, with an average annual rainfall of 1079 mm (Bureau of Meteorology, 2017). The orchard is surrounded by eucalypt forest.
Figure 1. Study area location and field photo of the lychee trees.
3. DATA AND METHODS 3.1 RPAS Data
RPAS multi-spectral (green, red, red edge and NIR bands) imagery was collected with the Parrot Sequoia sensor mounted to a 3DR Solo quadcopter for the lychee plantation on 11 February 2017 (pre-pruning) and 4 March 2017 (post-pruning). The Tower Beta Android application was used to undertake autonomous image data collection flown with 80% sideways overlap at a speed of 5 m/s and heights above ground level of 30, 50 and 70 m, taking photos once every second.
3.2 Field Data
Field based measurements of 89 lychee trees were collected on the 4 March 2017 of tree height, crown width and crown circumference. Tree height was measured as the longest distance from the ground to the top of the tree crown and was measured using a retractable measuring staff. Crown circumference was measured using a tape measure surrounding the widest part of the tree crown. Tree crown width was measured with a tape measure along the widest axis of each tree. Four representative photos were taken underneath each of the 89 trees looking straight up. The photos were taken close to the ground and approximately half way between the tree trunk and the perimeter edge. These photos were analysed to determine PPC, i.e. the vertically projected fraction of leaves and branches in relation to sky. Measurements of PPC were derived using a program written in IDL® (Scarth, 2003) to convert vertical digital photos to measurements of PPC based on the principle described by van Gardingen et al. (1999).
3.3 Image Processing
The Parrot Sequoia imagery was processed in Pix4D Mapper to produce an orthomosaic, a Digital Surface Model (DSM) and a Digital Terrain Model (DTM) for each of the six flights, i.e. at
30, 50 and 70 m above ground level before and after pruning. These flying heights produced pixel sizes of approximately 4.1 cm, 6.5 cm and 8.8 cm pixels, respectively. A Canopy Height Model (CHM) was produced by subtracting the DTM from the DSM. Ten AeroPoint ground control points were evenly spaced within the study area and used for geometric correction of the imagery (Figure 2). The location of each AeroPoint was recorded for more than 3 hours and subsequently post-processed using the Propeller® network correction based on a base station. Based on the 10 ground control points, a root mean square error (RMSE) of 6.1 cm was obtained.
Figure 2. Distribution and field photo of AeroPoints used for geometric correction of the RPAS imagery.
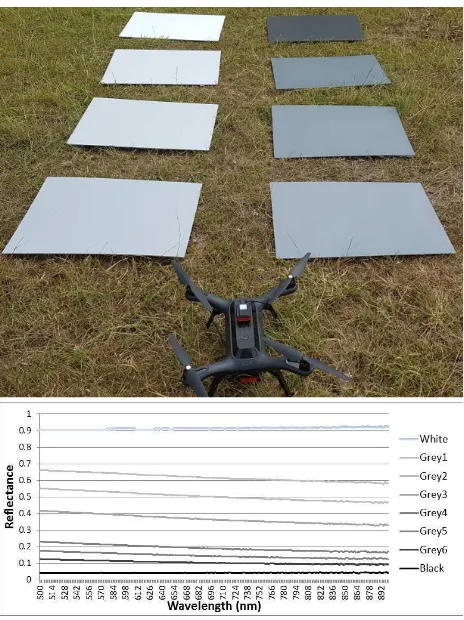
Eight radiometric calibration targets with known reflectance values measured by an ASD spectrometer (Figure 3) were used to convert the multi-spectral imagery to at-surface reflectance using an empirical line correction. The eight radiometric calibration targets were produced as recommended by Wang and Myint (2015). The ENVI 5.3 software was used to convert the imagery to at-surface reflectance.
Figure 3. Eight radiometric calibration targets and corresponding reflectance signatures between 500 and 900 nm.
Site
3.4 Object-Based Image Analysis
Object-based image analysis and the eCognition Developer 9.2 software were used to automatically delineate the individual tree crowns based on the CHM and the multi-spectral orthomosaic. An object-based mapping approach was deemed most suitable because of the small pixel size in relation to the tree objects being mapped (Blaschke, 2010). Tree crowns were initially identified if the CHM >1 m for objects with high vegetation index values. Objects were then grown outwards based on lower CHM thresholds. The tree crown edges were adjusted based on spectral information. Once the tree crown extent had been derived. The spectral bands, vegetation indices and co-occurrence texture measures were used to assess the correlation with the field derived PPC measurements.
3.5 Tree Crown Parameter Extraction
Based on the delineated tree crowns, a measure of their circumference, width and height could be automatically derived. The eCognition Developer software automatically calculates the object perimeter and maximum object width, which could be directly related to the field measured circumference and tree crown width. Although the maximum tree height was measured in the field, the 90 percentile of tree crown height was extracted at the individual tree crown object level to remove potential effects of the poles next to some of the trees used for placing protective nets over the trees (Figure 1). These poles were taller than the trees and hence had to be removed from the image based estimates of height. Using the 90 percentile of tree crown height solved this problem.
The spectral bands, vegetation indices and co-occurrence texture measures were used to assess the correlation with the field photo derived PPC measurements. The spectral bands included the green, red, red edge and NIR bands. The indices included the Normalized Difference Vegetation Index (NDVI), the Normalized Difference Red Edge Index (NDRE), the average brightness of all four spectral bands, and the average brightness of the red edge and NIR bands. The co-occurrence texture measures were calculated at the individual tree crown object level in the eCognition Developer software and included the Homogeneity, Contrast, Dissimilarity and Standard Deviation texture measures (Johansen et al., 2007). All of these object variables were extracted as a shapefile and joined with the field based measurements before analysing the relationship between the field derived PPC measurements and image derived layers in Excel.
4. RESULTS AND DISCUSSION 4.1 Tree Crown Delineation
The automated delineation of the tree crowns using object-based image analysis was an important step, as the derivation of tree structural parameters such as crown circumference and width relied on the accuracy of the delineation. As in other
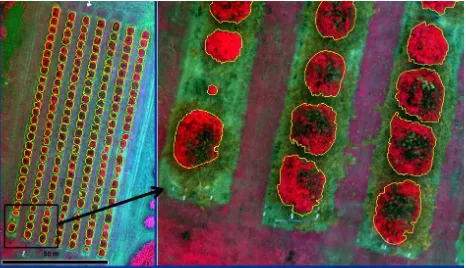
studies (Matese et al., 2017; Panagiotidis et al., 2016), the CHM was important for identifying individual tree crowns and determining where the edges of two adjoining tree crowns were. This was particularly the case pre-pruning. Post-pruning, most of the tree crowns did not adjoin, and hence fewer assumptions had to be made based on the CHM (Figure 4). For both tree crown delineations based on the imagery collected for the pre- and post-pruned lychee trees, all 189 lychee trees within the plantation were correctly identified.
Figure 4. Results of the lychee tree crown delineation (yellow outlines) produced using object-based image analysis.
4.2 Mapping of Tree Structure
Tree crown circumference and width relied directly on the accurately of the tree crown delineation. Tree crown circumference measurements decreased slightly with increasing flying height due to the larger pixel size, producing a smoother crown edge delineation. Flying at 70 m produced the highest R2 value of 0.95 (n = 89) and the lowest RMSE of 3.42 m for mapping tree crown circumference, as the smoothing of the tree crown delineation caused by the larger pixels corresponded to the way field based measurements of circumference were obtained. The different flying heights produced similar measurements of tree crown width with R2values of 0.90 - 0.93 (n = 89) and a RMSE of 0.62 - 0.65 m.
With increasing flying height, tree crown height was underestimated. A less accurate DTM and a DSM height lowering of tree crowns occurred with increasing flying height. The best R2value of 0.78 and RMSE of 0.19 m were produced at a flying height of 30 m for estimating tree height. At a flying height of 50 and 70 m, the R2value decreased to 0.61 and 0.59 with an RMSE of 0.25 m and 0.36 m, respectively.
The highest R2 values for estimating PPC were achieved using the red edge (R2 = 0.79-0.81, n = 89) and NIR (R2= 0.78-0.82, n = 89) bands, with the data collected at 70 m, producing a slightly better correlation. The red band showed a poor correlation with PPC (R2= 0.04 - 0.15, n = 89) due to little variation in red reflectance values in response to different PPC measurements. Hence, spectral vegetation indices such as the NDVI and NDRE did only produce R2values between 0.30 and 0.54. Using the co-occurrence texture measure of standard deviation of the red edge and NIR bands, R2values between 0.57 and 0.70 were achieved (Figure 5). At the tree crown level, higher R2 values for mapping PPC were obtained in most cases for the imagery collected at 70 m height.
To estimate PPC of the pre-pruned tree crowns, where no field data were collected, the best-fit equations between the post-The International Archives of the Photogrammetry, Remote Sensing and Spatial Information Sciences, Volume XLII-2/W6, 2017
pruned field derived PPC and the spectral bands, indices and texture measures were applied to the pre-pruned imagery to assess if these provided a realistic representation of PPC (Figure 6). The NIR band was found most useful for predicting PPC from the pre-pruning image based on a visual assessment of the tree crowns and their within tree crown gaps. The NDVI showed little variation in estimated PPC most likely because of saturation issues. The use of the red edge band significantly overestimated PPC for many of the tree crowns. Using the texture measures for estimating PPC provided unrealistically large PPC variations and in many cases significantly underestimated PPC based on what was expected (Figure 6).
Figure 5. Relationship between field measured PPC and image derived spectral bands, indices and texture measures produced
from imagery collected at 30, 50 and 70 m flying height.
Figure 6. Estimated PPC of the 89 pre-pruned tree crowns for which PPC was measured post-pruning. PPC for the pre-pruned
tree crowns was estimated using the best-fit equations based on the post-pruned image and field data.
4.3 Multi-Temporal Assessment
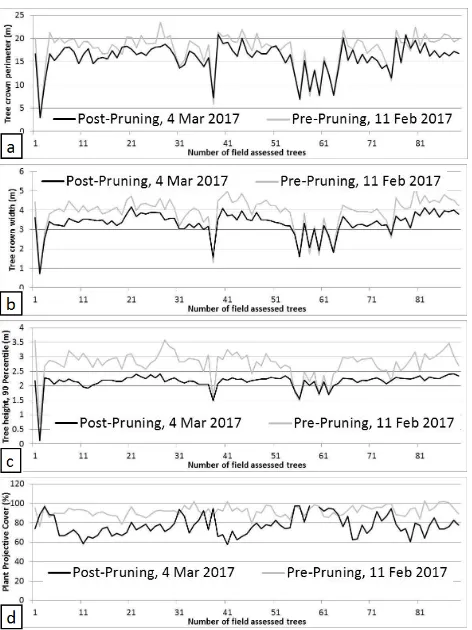
A significant decrease in the average value of the tree structural parameters could be observed for the 89 field assessed trees. The tree crown circumference, tree crown width, 90 percentile tree crown height and PPC decreased 1.94 m, 0.567 m, 0.616 m, and 14.8%, respectively (Figure 7). This equated to 10.9%, 14.7%, 22.3% and 15.2% decreases, respectively. According to Campbell & Diczbalis (2001), the recommended thinning size of a lychee tree is between 15% - 25% from its initial size. Hence, the pruning result showed a good agreement with the recommendation. In most cases, a decrease was observed in the tree structural measurements. However, some of the smaller and newly planted lychee trees were not pruned. Hence, the structural measurements stayed the same for those or slightly increased.
Figure 7. Pre- and post-pruning differences for the 89 field assessed lychee trees in (a) tree crown circumference, (b) tree crown width, (c) 90 percentile tree crown height, and (d) PPC measured from the RPAS imagery collected at 30 m height.
4.4 Effects of Flying Height Differences
Differences in flying height affected the multi-temporal results slightly (Figure 8). Tree crown height differences were highest when the image data were collected at 30 m height compared to 50 and 70 m height. The flying height of 30 m produced the most accurate height estimates, as the produced DSM and DTM were less accurate when collected at increasing flying heights. The measurements of circumference decreased with increasing flying height, because of the increasing pixel size, which made the automatically derived object perimeter smoother and hence shorter. The tree crown width measurements derived at difference flying heights were similar, just showing a slight decrease as the flying height and hence the pixel size increased (Figure 8).
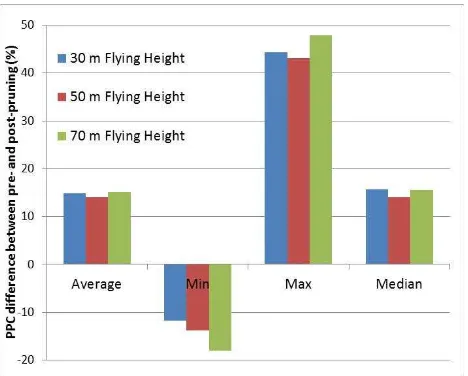
PPC was generally most accurately estimated based on the imagery collected at 70 m. The average PPC difference was similar for all three flying heights (Figure 9). However, at a flying height of 70 m, the average minimum and maximum differences were highest. This could be because of the larger pixel size, which may have caused mixed pixels along the edges of the delineated tree crowns. These mixed pixels may have included parts of the shaded areas caused by tree shadows on the one side of the trees and parts of the sunlit green grass on the other side of some of the trees.
Figure 8. Pre- and post-pruning differences for the 89 field assessed lychee trees in 90 percentile tree crown height, tree
crown circumference and tree crown width as a function of flying height.
Figure 9. Pre- and post-pruning differences for the 89 field assessed lychee trees in PPC as a function of flying height.
5. CONCLUSIONS
This research assessed the ability of using multi-spectral RPAS imagery collected at three different heights to measure tree structural differences pre- and post-pruning of a lychee plantation. The eCognition Developer software was found useful for delineating individual tree crowns and deriving object shape and spectral and textural information for correlation with field based measurements of tree structure. The Parrot Sequoia image data collected with a 3DR Solo quadcopter were found suitable for accurately assessing pre- and post-pruning tree crown structure, including tree crown circumference, width, height and PPC. Tree crown circumference was most accurately mapped at a flying height of 70 m. Tree crown width measurements were similar at flying heights of 30, 50 and 70 m. Tree height was most accurately mapped at a 30 m flying height, as larger flying heights affected the accuracy of the DSM and DTM derived in the Pix4D Mapper software. Imagery collected at 70 m height produced slightly higher correlation with field measured PPC for most predictor variables. These results show that multi-spectral RPAS imagery can provide a suitable means of assessing pruning efforts undertaken by contractors based on changes in tree structure of lychee
plantations and that it is important to collect imagery in a consistent manner, as varying flying heights may cause changes to tree structural measurements.
ACKNOWLEDGEMENTS
Thanks to Paul Thorne, the lychee grower and owner of the lychee plantation, for help in the field and for allowing us access to the study site. We would also like to acknowledge SPIRIT BAPPENAS-World Bank for awarding Tri Raharjo a scholarship to undertake part of this research.
REFERENCES
Bagheri, N., 2017. Development of a high-resolution aerial remote-sensing system for precision agriculture. International Journal of Remote Sensing, 38(8-10), pp. 2053-2065.
Blaschke, T., 2010. Object Based Image Analysis for Remote Sensing. ISPRS Journal of Photogrammetry and Remote Sensing, 65, pp. 2–16.
Bureau of Meteorology, 2017. Climate statistics for Australian locations. URL:
www.bom.gov.au/climate/averages/tables/cw_040854.shtml,
[last accessed 18 July 2017].
Campbell, T.P., Diczbalis, Y., 2001. Pruning to meet your lychee goals: a report for the Rural Industries Research and Development Corporation. Barton, A.C.T: Rural Industries Research and Development Corporation.
Horticulture Innovation Australia, 2016. Australian Horticulture Statistic Handbook 2014/2015 – Fruit. Sydney, Australia: Horticultural Innovation Australia Limited.
Johansen, K., Coops, N.C., Gergel, S.E., Stange, Y., 2007. Application of high spatial resolution satellite imagery for riparian and forest ecosystem classification. Remote Sensing of Environment, 110(1), pp 29-44.
Lan, T., 2014. 2014 Vietnam's lychee export - potentials and forecast - Part 1. Vietrade, Vietnam.
Li-gang, F., Shui-sen, C., Hong-li, L., 2012. Key remote sensing technology of precision fruits in Guangdong Province – A case study of lychee. Future Control and Automation, LNEE 172, pp. 129-135.
Matese, A., Di Gennaro, S.F., Berton, A., 2017. Assessment of a canopy height model (CHM) in a vineyard using UAV-based multispectral imaging. International Journal of Remote Sensing, 38(8-10), pp. 2150-2160.
Menzel, C.M., Waite, G.K., 2005. Litchi and longan: botany, production and uses (1st Ed.), Wallingford, Oxfordshire, UK: CABI Publishing.
Panagiotidis, D., Abdollahnejad, A., Surový, P., Chiteculo, V., 2017. Determining tree height and crown diameter from high-resolution UAV imagery. International Journal of Remote Sensing, 38(8-10), pp. 2392-2410.
Papademetriou, M.K., Dent, F.J., 2002. Lychee production in the Asia-Pacific Region (1st Ed.), Bangkok, Thailand: FAO Regional Office for Asia and the Pacific.
Scarth, P., 2003. A methodology for scaling biophysical models. Ph.D. thesis. The University of Queensland, Brisbane, Australia.
van Gardingen, P.R., Jackson, G.E., Hernandez-Daumas, S., Russel, G., Sharp, L., 1999. Leaf area index estimates obtained for clumped canopies using hemispherical photography.
Agricultural and Forest Meteorology, 94, pp. 243-257.
Wang, C., Myint, S.W., 2015. A simplified empirical line method of radiometric calibration for small Unmanned Aircraft Systems-based remote sensing. IEEE Journal of Selected Topics in Applied Earth Observations and Remote Sensing, 8(5), 1876-1885.
Zhang, C., Kovacs, J., 2012. The application of small Unmanned Aerial Systems for precision agriculture: A review.
Precision Agriculture, 13(6), 693-712.