MONITORING OF VIBRATIONS FOR THE CONSERVATION OF CULTURAL
HERITAGE
:
THE CASE OF THE SUMMER PALACE IN BEIJING
Xi Gao a, Long Zhang b, *, Gang Liu b, Zhenning Ba c
a International Engineering Institute, Tianjin University, Weijin Road, Tianjin, China - [email protected]
b School of Architecture, Tianjin University, Weijin Road, Tianjin, China - (arcdragon, lglgmike)@163.com
c School of Civil Engineering, Tianjin University, Weijin Road, Tianjin, China - [email protected]
KEY WORDS: Heritage Conservation, The Summer Palace, Real-time, Monitoring, Vibration, Multivariate Statistical Analysis
ABSTRACT:
In order to research the influence of the environmental vibration and the protection of the architectural heritage, CMG-5TCDE accelerometer was used to obtain the real-time vibration monitoring data of the Grand Stage in the Garden of Virtuous Harmony in Summer Palace. This paper employs the control variable method and the multivariate statistical analysis, integrating monitoring statistics with wind speed and transportation observation statistics to make interrelated analysis, in order to study the response rules and impact degree of the Grand Stage under the environmental vibration impact. The analyses of the vibration monitoring statistic of
the recent two years show that the vibration acceleration of the Grand Stage is below 10mm/s2, which is remarkable related with
factors such as visitors flow rate, transportation and weather.
* Corresponding author
1. INTRODUCTION
In recent years, with the development of economy and accelerating of city construction, the impact of ambient vibration on historic buildings in the city is becoming more and more serious. Long-term vibration can cause phenomenon such as wall peeling, floor cracks and even structural deformation of the ancient buildings which may eventually lead to overturn and damage. The crack of Villa Farnesina murals in 1953(Clemente P, 1998) and the collapse of Czech church in 1961(Bata M, 1971) are both related to the vibration of buildings, therefore, it is extremely urgent to carry out the vibration monitoring and protection t of cultural heritage.
The Summer Palace, located in China’s capital - Beijing, is
China’s largest royal garden, which persists for nearly three hundred years. In recent years, with the continuous expansion of Beijing city and the increasing number of visitors, traffic flow also increases. In addition, the Summer Palace is located near the subway line four and the influence of traffic vibration on Summer Palace attracts more and more attention. Meanwhile, Beijing, located in North China, is a seismically active area, and the Summer Palace is affected seriously by Tangshan
earthquake in 1976. What’s more, the Summer Palace is also affected by bad weather such as strong wind and heavy rain. In order to keep the ancient buildings in the Summer Palace in good condition, it is particularly important to monitor, analyse, and predict the vibration at real-time.
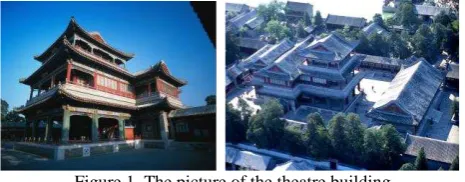
Then, we have carried out field investigation and the selection of monitoring points. There is Grand Stage in the large yard of Garden of Virtuous Harmony in the Summer Palace. It is located in northwest of the Hall of Benevolence and Longevity and in the east of the Hall of Fragrant Grass with a total height of about 22 meters which is only second to the highest the Tower of the Fragrance of the Buddha. It is currently the most complete and largest ancient drama stage in China with important artistic value and historical value. Considering the
protection of ancient buildings and equipment installation, the Grand Stage in the Garden of Virtuous Harmony next to the backside of the stage is finally selected as the monitoring site of
vibration. The Grand Stage is spacious and bright in a “convex”
shape with 7 building width, 5 porches and a height of 16 meters, which is a place where the actors prepared to go to the stage, stored and changed clothes and stage properties at that time (Figure 1).
Figure 1. The picture of the theatre building (©3lian10 Image Copyright 2015)
acceleration are selected separately each day to analyse the reason that causes the biggest change of vibration and vibration trend; The weekly data is compared and observe the data change in a week; Comparing special period (holiday or high winds) with normal weather conditions, determine its influence degree; The vibration source and trend are analysed according to the vibration change of ancient buildings in a year, in addition, the vibration characteristics are studied through the analysis in frequency domain for the vibration of ancient buildings. The research method in the paper has a significant effect on the heritage protection technology and may play an important role in the protection and study of ancient buildings. Meanwhile, the research results can give qualitative conclusions for the propagation law of ambient vibration and the response of buildings in vibration, which provide a basis for assessing the vibration level and damage degree of buildings. Thus the damage generated by ambient vibration and historic buildings can be controlled and reduced effectively, protect historic buildings, and provide important reference for taking anti-vibration and anti-vibration isolation measures to protect architectural heritages along traffic lines and in the downtown.
2. THE BRIEF OF MONITORING PROGRAM
2.1 Monitoring Apparatus
When the mass point vibrates, three physical parameters including acceleration, velocity, and displacement can be used to measure the vibration intensity, among which acceleration is the most commonly used one. At the moment, nearly all of the common vibration measuring sensors are acceleration sensors, and the acceleration values could be directly obtained with high precision. Meanwhile, the experiments show that the relevance between the performance of the apparatus and the environment vibration speed is sharply obvious. The utilization of the displacement sensors often occurs in the cases when the vibration displacement may emerge unfavorable impact. Considering these reasons and the performance of vibration meter, the acceleration values of the measuring points could be measured.
In this project, CMG-5TCDE accelerometer is selected (shown
in Figure 2). It’s a completely digitized integrative instrument.
This product is widely used in seismology, disaster prevention, security monitoring of bridges and large buildings. Its built-in Linux-based data collection module provides the monitoring and control apparatus with unparalleled flexibility.
Figure 2. The vibration monitoring apparatus
(CMG-5TCDE)
2.2 The Mechanism of Monitoring
CMG-5TCDE digital accelerometer is integrated with highly precise accelerometer and data collector. Its internal accelerometer contains three separate sensors used for measuring the fluctuation signal of the earth in the direction of
vertical, north-south, and east-west. When the ground is vibrating slightly, the sensor converts the detected vibration signals into electrical signals, and then through the amplifier circuit outputs the signal to the data via the data cable collector. There is a built-in data logger which then realizes the AD conversion to the obtained analog signal. With a unique algorithm and an embedded operating system, the output of the continuous vibration real-time signal can be obtained through the network cable.
2.3 Technical Ideals
Choose a typical ancient building and select a representative floor, and then fix the apparatus on the floor.
Maintain the power supply and make sure the apparatus monitor the building in real time.
By setting the save step to the save of data (which can be set to one minute or more), the saved data include the values of displacement, velocity and acceleration of monitoring position.
Monitoring data could be transmitted to the monitoring terminal in real-time without any restrictions.
By monitoring the terminal, the real-time information in the form of time history curve could be obtained. The software itself has the display and analysis functions. Graphic zoom can be achieved, and also the function of the corresponding analysis.
According to the three warning standards (10mm/s2, 200mm/s2,
2000mm/s2) that have been formulated, the automatic warning
function could come true.
2.4 The Arrangement of Measuring Points
Finally measuring points are set on the second floor of the theatre building (Figure 3.). Vibration monitoring apparatus on the second floor is fixed on the beam near the stairs at the hall (Figure 4.). Data transmission apparatus adopts the AP Bridge Point to Point transmission (Figure 5.).
Figure 3. The second floor of the theater building
Figure 5. The data transmission apparatus
3. THE MONITORING DATA ANALYSIS
3.1 Statistical analysis for the results in time domain
3.1.1 Annual vibration analysis: In order to analyse the
influence of season (climate change) on the vibration of historic buildings, the data of each month is collected to reflect the basic situation of the vibration of ancient buildings in a year. The monthly mean value is analysed for the data from February 2015 to November 2016 as shown in Figure 6 and Figure 7.
0
Jan Feb Mar Apr May Jun Jul Aug Sep Oct Nov Dec
Figure 6. Monthly vibration acceleration in 2015(mm/s2)
0
Jan Feb Mar Apr May Jun Jul Aug Sep Oct Nov Dec
Figure 7. Monthly vibration acceleration in 2016(mm/s2)
It can be seen from Figure 6 and Figure 7 that seasonal variation has a significant influence on the vibration of the Grand Stage. The annual vibration acceleration in horizontal direction is significantly larger than that in vertical direction. Affected by monsoon climate in Beijing, the vibration acceleration in east - west direction increases in summer but decreases in winter, and the variation trend in north - south direction goes conversely. In addition, the vertical vibration acceleration increases in spring and autumn with two peaks emerging, but decreases in summer and winter.
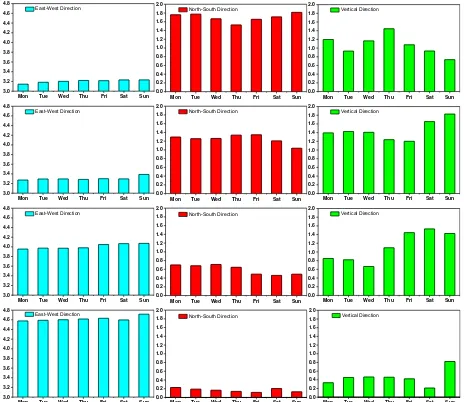
3.1.2 Daily variation analysis in a week: The vibration
monitoring data of the Grand Stage shall be divided in weeks and has comparison analysis, and the basic trends and changes of vibration acceleration in a week is analysed (Take the second week of each month from August to November 2016 as an
Mon Tue Wed Thu Fri Sat Sun
3.0
Mon Tue Wed Thu Fri Sat Sun
3.0
Mon Tue Wed Thu Fri Sat Sun
3.0
Mon Tue Wed Thu Fri Sat Sun
Figure 8. Daily vibration acceleration in a week(mm/s2)
Through analysis of daily mean variation in a week of four selected weeks, it found that the variation trends of three-dimensional vibration acceleration from Monday to Sunday in each week of different months were not the same. The vibration acceleration in east - west direction was on a rise basically and reached its maximum on Sunday; the change law in north - south direction was always different from that in vertical direction, but the change law was not clear; the vibration acceleration in east - west direction was significantly greater than that in north - south direction and vertical direction.
3.1.3 Analysis of special holidays: Take the mean value of
vibration acceleration on special holidays and the days before and after the holiday, which will reflect the change of vibration acceleration between holidays and the days before and after the holiday. Set the National Day as an example, selected regular time period (September 24-26 and October 8-10 (in line with the day of the week of National Day)) and special periods (October 1 - 3 (National Day)) to analyse, and the influence of increasing visitor flow on the vibration of buildings was studied during holidays.
9/24 9/25 9/26 10/01 10/02 10/03 10/08 10/09 10/10 3.4
Date0.4 9/24 9/25 9/26 10/01 10/02 10/03 10/08 10/09 10/10 0.6
0.8 1.0 1.2
North-South Direction
Date0.6 9/24 9/25 9/26 10/01 10/02 10/03 10/08 10/09 10/10 0.8
Figure 9. Daily vibration acceleration in special holidays(mm/s2)
3.1.4 Daily change of vibration acceleration in different seasons: In order to analyse the daily change of vibration acceleration in different seasons, four days of vernal equinox (March 20), summer solstice (June 21), autumnal equinox (September 23) and winter solstice (December 21) were selected to analyse the daily change of three-dimensional acceleration value.
Figure 10. Daily vibration acceleration in four seasons(mm/s2)
According to the daily change figure of three-dimensional vibration acceleration in different selected seasons, it showed that the change law of four seasons in north - south direction was similar, which reached the maximum value of vibration acceleration at about 12am and reached the minimum value of vibration acceleration at night. The acceleration value in vertical direction reached the maximum value at noon in spring, summer and winter. But the vibration acceleration in horizontal direction was still larger than that in vertical direction.
3.2 The Instantaneous Value Assessment
The apparatus, collecting the data with the frequency of 200Hz, monitors the old buildings in real time in order to observe the causal factors which can arise vibration. In order to take the fluctuation of the visitor flows in tourist peak season as the
specific factor, we select the test results in October the 1st as a
demonstration. Through the waveforms are displayed in real-time, it allows we could find the vibration of the building rules, and explore the causes of vibration in real-time.
Figure 11. Vibration waveform in real time
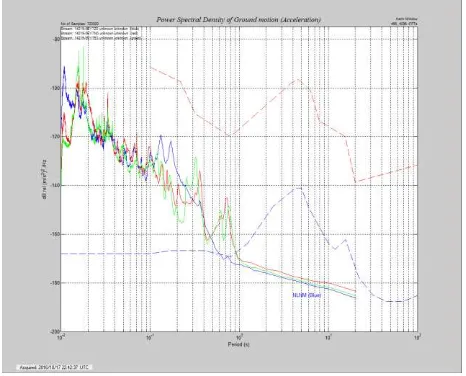
3.3 Statistical Analysis of the Results in Frequency Domain
The characteristic of the frequency domain analysis is that the time domain equation of the system is transformed into the frequency domain equation by Fourier transform, and the solution in frequency domain is converted to the one in time domain by using the Fourier inverse transform. The frequency domain analysis is conducive to the observation of the frequency range of the significant response of the vibration. In order to undertake the observation and the study of the vibration on the second floor of the theater building in the Summer Palace, with the data the apparatus collected, we can obtain the frequency spectrum by the analysis of scream software, and one of them is listed as following (The horizontal axis represents the period, with the vertical axis being the power spectral density value. The blue line is the power spectral density value in the direction of east-west, the red line on behalf of the north-south, and the green line represents the vertical). Through the observation of 24 hours in a day, it could be found that the frequency of the corresponding vibration effect is mainly concentrated in the range of 1-100Hz.
Figure 12. Spectrum chart
4. CONCLUSIONS
When monitored the vibration of historic buildings in Summer Palace at real time in the project, we analysed the collected monitoring data, explored the change law of vibration acceleration, and analysed its influence factors.
that have been formulated, the vibration acceleration values of
the Grand stage are in the normal range and it’s in a safe state
now. In addition, the real-time waveform of monitoring data of vibration showed that we could analyse the vibration condition of buildings at some point specifically.
REFERENCES
Bata M, 1971. Effects on buildings of vibrations caused by traffic. Building Science, 6(4), pp. 221-246.
Bongiovanni G, Clemente P, Rinaldis D, et al, 2011. Traffic—
induced vibrations in historical buildings. Proceedings of the
8th Inter—national Conference on Structural Dynamics, Leuven,
Belgium, pp. 812-819.
Breccolotti M, Materazzi A L, Salciarini D, et al, 2011. Vibrations in-duced by the new underground railway line in
Palermo, Italy—experimental measurements and FE modeling.
Proceedings of the 8th International Conference on Structural Dynamics, Leuven, Belgium, pp. 719-726.
Clemente P, Rinaldis D, 1998. Protection of a monumental building against traffic-induced vibrations. Soil Dynamics & Earthquake Engineering, 17(5), pp. 289-296.
Hong J, 2006. ANALYSIS OF EFFECTS INDUCED BY
SUBWAY TRAIN ON SURROUNDING BUILDING
VIBRATION. Journal of Vibration & Shock, 25(4), pp. 142-145.