SPLITTING TERRACED HOUSES INTO SINGLE UNITS USING OBLIQUE AERIAL
IMAGERY
D. Dahlkea
a
Institute of Optical Sensor Systems, DLR Berlin, Germany [email protected]
Commission II, WG II/4
KEY WORDS:Fac¸ade Splitting, Oblique True Ortho, Building Segmentation
ABSTRACT:
This paper introduces a method to subdivide complex building structures like terraced houses into single house units comparable to units available in a cadastral map. 3D line segments are detected with sub-pixel accuracy in traditional vertical true orthomosaics as well as in innovative oblique true orthomosaics and their respective surface models. Hereby high gradient strengths on roofs as well as fac¸ades are taken into account. By investigating the coplanarity and frequencies within a set of 3D line segments, individual cut lines for a building complex are found. The resulting regions ideally describe single houses and thus the object complexity is reduced for subsequent topological, semantical or geometrical considerations. For the chosen study area with 70 buidling outlines a hit rate of 80% for cut lines is achieved.
1. INTRODUCTION
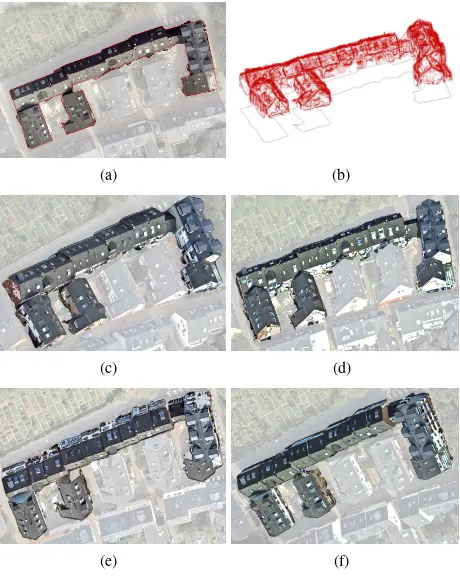
The automated extraction of photorealistic 3D city models is an emerging task in the field of remote sensing. These models con-tain geometric information like building borders or street furni-ture, semantic information like storey numbers or window-to-wall ratios as well as textures from terrestrial or oblique aerial images. An established geographically referenced data model and exchange format is the official international OGC standard CityGML (Kolbe, 2009) with certain Level-of-Details (LoD). The subject of this paper is part of a workflow for automated ex-traction of textured and semantically annotated ”LoD-2.5” City-GML objects (Frommholz et al., 2016) from aerial oblique im-agery. At this LoD, buildings have distinctive roof structures, roof overhangs and fac¸ades with window information. Prior to this approach building outlines have been derived with contemporary algorithms (Piltz et al., 2016) from standard vertical true ortho-mosaics and their corresponding digital surface model. Figure 1(a) shows one of such polygons, which usually do not represent single houses, but the (roof) outline of terraced houses. An in-herent part of reconstruction algorithms is to describe the world’s complexity as simple but precise as possible. In order to achieve satisfying results on basis of the aforementioned building out-lines, it is necessary to split them into smaller and semantically reasonable units. Otherwise topological and semantic derivations likely become too complex and irrational which yields in unre-coverable geometry for the buildings in question.
The presented approach splits complex polygons into reasonable units. It works on basis of the very same input data as men-tioned above, namely surface models and true orthomosaics de-rived from triangulated vertical and oblique aerial imagery. An edge detection is performed for each orthomosaic within a build-ing outline polygon (Figure 1(c)-(f)). All obtained line segments are shown in Figure 1(b). They are analysed with respect to their 3D orientation and local frequency. Hereby split lines as well as small gaps between buildings are introduced as 2D line segments spanning from one building outline border to another. Within the resulting smaller units a subsequent 3D building reconstruc-tion part is much more robust against topological and geometric
blunders. Another benefit for this further processing step is the consistency of input data.
Since the segmented building outline polygon is comparable to a cadastral map, a comparison between both is part of the experi-mental results section. Due to several reasons it is not advisable to rely on a cadastral map for the segmentation of complex build-ing outlines. For one thbuild-ing they don’t compulsory match geo-graphically to the acquired image data. This is due to either old cadastral maps with lower accuracies or geodetic datum shifts be-tween different coordinate systems. Displacements in the range of decimetres between image and cadastre information may oc-cur, which makes this combination ineffective. For another thing cadaster information is related to additional costs, since it is not open source if the data is available at all. Especially in fast grow-ing cities, like Istanbul for example, with many terraced houses, it is not given to get maintained cadaster information for this pur-pose.
1.1 Related work
Secondly 2D databases are used as initial regions of interest (ROI) for 3D building reconstrunction from aerial images (Cohen and Vinson, 2002) or LIDAR pointclouds (Kada and McKinley, 2009). These initial polygons are either derived from the raw input data, representing the roof outlines (Mayer, 2002) or taken from mu-nicipal ground plans (Vosselman and Dijkman, 2001). All ap-proaches have in common that they decompose initial complex ROIs into smaller, preferably rectangular, units in order to dis-criminate adjacent houses and simplify the reconstruction stage. The novelty of the presented method is the additional usage of true 3D information for fac¸ades from oblique imagery.
1.2 Source data
A flight campaign over the German islands of Heligoland was conducted using the DLR MACS HALE aerial camera (Bucher et al., 2016) with slightly more than 80% overlap along track. The two oblique sensors pointing to the left and right have a tilt angle of 36◦. Firstly the exterior orientation for the cameras is approximated by filtering GPS/INS signals. Secondly an aerotri-angulation is obtained by using the MATCH-AT module of IN-PHO. Finally for each ground pixel all corresponding acquisition geometries and their errors respectively matching costs are mini-mized (Hirschm¨uller, 2008). The result is a 2.5D digital surface model (DSM) projected in the ETRS89/UTM reference frame. The dense matching, which has been initially designed for the creation of 2.5D data from High Resolution Stereo Camera im-ages, is applied to the oblique data as well. Both oblique camera heads of the MACS are triggered synchronously with the vertical camera head. An approach for generating oblique surface models for the extraction of geoinformation is presented in (Wieden and Linkiewicz, 2013). In contrast to traditional vertical DSM prod-ucts, so called local reference frames (LRF) have to be defined beforehand. A LRF is described by a cluster of oblique images which have similar viewing geometries. In figures this means that rotation differences between images contributing to a cluster dif-fer by no more than 20◦. The mean of all contributing viewing angles is calculated and applied as sequential rotation angles to a rotation matrix. In total several clusters and rotation matrices are created for oblique imagery. Oblique surface models have simi-lar properties like classical surface models derived from vertical aerial imagery. Each oblique surface model is geo referenced in a LRF. Because of the rotation parameters each LRF is connected to the higher level global reference frame (ETRS89/UTM) and therefore also to each other. Following this approach, the ori-ented oblique images are pre-processed into (tilted) DSMs. In case of a crossing stripes flight pattern, each occlusion free point in the scene is hereby mapped from different cardinal directions. The buildings are represented by at least five digital surface mod-els and five orthomosaics respectively, one for the vertical case and at least four (e.g. each cardinal direction) for the oblique case. Due to the different viewing geometries, the ground sam-pling distance (GSD) differs between datasets. For the nadir case the GSD is 5cm. In the oblique case the GSD is roughly three times worth with 15cm.
Cadastral building boundaries serve as a reference for the pro-posed method. In Germany the land survey register contains among semantic, topologic and other geometric information the cadastral building footprints. They are delivered as polygon vec-tor files projected in the ETRS89/UTM reference system. De-pending on the survey method each building corner point pos-sesses an error margin up to 6 cm (Vorschriftensammlung f¨ur das Vermessungswesen, 2016).
(a) (b)
(c) (d)
(e) (f)
Figure 1. Source data (a) Vertical orthomosaic with superimposed building outline polygon (b) 31873 3D line segments from all orthomosaics (c-f) Oblique orthomosaics
showing the polygonal content as translucent parts
2. PROPOSED METHOD
Within traditional vertical true orthomosaics, single roofs are ob-viously distinguishable when they are made out of different ma-terials. That means it can be well discriminated between red and black bricks. In addition firewalls, different roof textures, slopes or heights support the discrimination between different roofs. But the applicability of these roof features is not guar-anteed, since they are not forcibly available. Fac¸ade features like drainage channels or differently colored walls provide additional support for discriminating different single house units within ter-raced houses. For fac¸ade interpretation the raw oblique imagery is processed analogous to the vertical aerial images as described in the previous section. 3D line segments are obtained from tra-ditional vertical true orthomosaics as well as innovative oblique true orthomosaics and its respective surface models. For this pur-pose sub-pixel accurate algorithms like (Grompone von Gioi et al., 2012) and (Lu et al., 2015) can be used. Split lines are deter-mined by investigating the coplanarity and frequencies within a set of 3D line segments. In addition to cut lines between terraced houses, the presented method also detects small gaps between physically divided houses.
2.1 3D line segments
(a) (b)
(c)
Figure 2. Filtering 3D line segments (a) Orientation of line segments in the xy-plane (with superimposed results of maxima
detection) (b) 3D Orientation of line segments against the z-plane (with superimposed results of maxima detection) (c)
Final selection of 8891 3D line segments
The georeferenced 2D coordinates of both line segments end-points are connected to the height information from the corre-sponding surface model. Hereby line segments are described with 3D coordinates for their endpoints in a local reference frame LRF. The relationship between all four LRF is mathematically described in terms of rotation matrices. All line segment coor-dinates are multiplied with the corresponding transposed rotation matrix to get into a higher level UTM reference frame. An ex-emplary visualization for 31873 of such detected line segments in the global reference frame is depicted in Figure 1(b). The line segment detection is very sensitive to noise caused by matching inaccuracies in the surface model and artefacts in the orthomo-saics. To overcome this drawback the principle 3D orientation for a building complex is estimated by analysing the frequency for attitudes of all segments. Attitude in this case means the orientation of a line segment in 3D space that is given on the one hand as horizontal alignment or aspect for fac¸ades and on he other hand as vertical alignment or slope for roofs. The or-dering of start and endpoints for line segments is of no impor-tance in this case. That means the aspect ranges from -90◦to 90◦, with -90◦and 90◦being east-west aligned and 0◦being north-south aligned, while the slope ranges from 0◦to 90◦, with 0◦being horizontal and 90◦being vertical. Predominant horizontal and vertical alignments are derived from the 3D orientation of all line segments. Histograms for both angles can be found in Fig-ure 2(a)-(b). They give a first impression of the distribution of predominant angles in the line segments. While the aspect anal-ysis takes all segments into account, the slope analanal-ysis is con-fined solely to segments which have a predominant aspect angle. Since vertical and horizontal slope angles are inherently the most prominent features in the slope histogram, the first and last 10◦are cut off, so that the range is limited from 10◦to 80◦. Within the histograms for aspect and slope, a polynomial function of degree 2 is fitted to the peaks. A delta of approximately 90◦between two identified aspect angles indicates a good outcome, since most c¸ades are built orthogonally. The maxima are found to be the principle orientation of a building. Line segments which differ
from this principle orientation are omitted. All remaining line segments are supposed to represent real edges without signifi-cant noise influence. For the example complex from Figure 1(b) almost one quarter, namely 8891 line segments remain for the subsequent and final decomposition stage (see Figure 2(c)).
2.2 Decomposition at gaps and adjacent houses
Initial outline polygons usually do not represent single houses, but the outline of terraced houses. Sometimes it also happens that gaps between physically divided buildings are not present in these polygons. This occurs on the one hand in small shaded areas between buildings where no reliable height information is available. And on the other hand it happens that nearby trees become part of the building outline, although the near infrared channel is used to differentiate between elevated vegetation or building objects. Within a CityGML or similar model, however, a building object generally is supposed to be a single house. Thus, an outline has to be split into smaller units, ideally representing single houses. A split line is considered to be a straight line from one side of the outline segment to another, splitting a complex polygon into smaller units.
(a) (b)
(c)
Figure 3. Decomposed building outlines (a-b) Gaps (blue slices) between physically divided houses with new borders (red slices)
for initial (pink) building outline (c) Decomposed building polygon (black) based on 3D line segments (red)
lines, each slice is ranked by its containing line segments. Since slices usually do not contain complete 3D line segments, linearly spaced 3D points are generated for each segment. The number of evenly spaced points between the segment’s endpoints depend on the segment’s 3D extent. The GSD is used as distance for the spacing. As a result the projection of the 3D points onto the xy-plane can be used for counting quantities and thereby measuring partial relationship between a slice and its containing line seg-ments. Furthermore each 3D point still possesses the segment’s original attributes like an ID or the 3D orientation. In the fol-lowing these attributes and the quantity will be used to define cut lines.
Two contrary types of cut lines can be traced with these slices. In the aforementioned case of physically divided buildings, a slice contains almost no line segments. Within small shaded areas be-tween buildings no line segments are detected at all. Figure 3(a) shows such a gap in a shaded area between two buildings. In the less usual case of high vegetation between two buildings (see Figure 3(b)), the orientation of initial line segments is arbitrary and therefore they are almost completely filtered out in the pre-processing stage. Neighbouring slices, containing no significant amount of line segments, are omitted and the building outline is split at the borders of this gap.
The second and by far more typical case is represented by slices containing many coplanar line segments. Basically this is the in-verted case, compared to the aforementioned gap between physi-cally divided houses. This time not only the presence but also the 3D orientation attribute of line segments is taken into account. Only if vertical and non vertical coplanar line segments are found coincidentally within one slice, the polygon is split at the centre of this slice. If many neighbouring slices fulfil this criteria, the centre of these adjacent slices is used as split line. An example for a decomposed complex building can be found in figure 3(c). An assumption, which both cut line types have in common is that the area of decomposed polygons has to be larger than 20m2. The resulting split polygons roughly represent estate boundaries and are therefore comparable to official cadastral maps.
3. RESULTS AND DISCUSSION
For the study area, shown in the Appendix section, 70 initial building outlines have been used. From this starting point the presented approach detected 75 split lines. By applying these split lines to the initial 70 polygons, 136 segmented polygons were generated. The number of polygons has almost been dou-bled. Ten split lines are describing the borders of five gaps be-tween physically divided buildings. The remaining 65 split lines are describing cut lines within building complexes. Compared to the corresponding cadastral map containing 75 complex build-ings and 184 single house units (see Figure 5 in the Appendix section), four cut lines are false positives or false alarms. That means a splitting edge is introduced although no split is made in the cadastral map. Nevertheless these four lines are subdi-viding complex buildings with individual roof and fac¸ade struc-tures. Furthermore 43 split lines have been missed, when com-pared against the cadastral map. With 71 true positive split lines and 43 false negatives, the sensitivity or hit rate is 62%. However if taken into account, that almost 25 of the missed cut lines are not represented by any geometric or radiometric feature in the in-put datasets, the hit rate increases up to 80%. In other words, the absence of those 25 undetected cut lines has no influence on the success of the subsequent reconstruction stage.
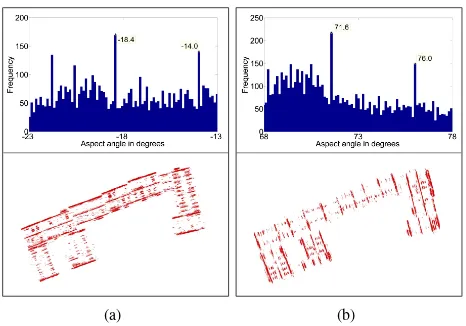
(a) (b)
Figure 4. Different aspect angles within complex buildings (a-b) Subset of the aspect angle histogram with side maxima (top) and
corresponding 3D line segments (bottom)
Another error shows up, when looking into the orientation angles of cut lines for complex buildings. If a complex building is com-posed out of single houses with different principle orientations, the split line orientation tends to be two or three degrees off. This is due to the fact that the orientation is derived from the maxima of the aspect angle histogram as shown in Figure 2(a). The top of Figure 4(a)-(b) shows a close-up of the aforementioned maxima regions. When picking manually the two strongest peaks within each region, it can be seen that the chosen orientation originally consists out of two different orientation angles. Each of the man-ually selected peaks has its counterpart for building up almost perfectly 90◦. The visualisation of the corresponding line seg-ments at the bottom of Figure 4(a)-(b) confirm the observed char-acteristic with slightly different orientated line segments for the easternmost building part.
4. CONCLUSIONS AND OUTLOOK
automatically derive or update cadastral boundaries has to be in-vestigated critically.
Another part of future work will be the correct or corrected ori-entation of split line segments. While the oriori-entation is basically derived very accurate (portions of a degree), it is possible that slight offsets occur for more complex buildings. An implementa-tion for the detecimplementa-tion and derivaimplementa-tion of side maxima will probably lead to more reliable aspect orientations in this case. Since the orientation parameters of a building are derived from up to sev-eral thousand 3D line segments, they are, as already mentioned, for most of the buildings very accurate. This benefit could be perspectively used to support the 3D building reconstruction with reliable vertical and horizontal orientations for roofs and fac¸ades respectively.
ACKNOWLEDGEMENTS
Integration of the camera system and development of process-ing algorithms were done by the members of the Department for Sensor Concepts and Applications at the German Aerospace Cen-tre. Representatively for the whole team I want to thank its team leaders Ralf Berger, Karsten Stebner, Sebastian Pless and Tilman Bucher. Without their innovative ideas neither such images would have been captured nor processed.
REFERENCES
Bucher, T., Berger, R., Brauchle, J., Hein, D., Lehmann, F., Piltz, B., Scherbaum, P., Stebner, K. and Pless, S., 2016. Mod-ular photogrammetric sensor systems for real-time information extraction and 3d-applications. In: T. P. Kersten (ed.), 36. Wissenschaftlich-Technische Jahrestagung der DGPF, Publika-tionen der Deutschen Gesellschaft f¨ur Photogrammetrie, Fern-erkundung und Geoinformation e.V., Vol. 25.
Cohen, L. D. and Vinson, S., 2002. Segmentation of complex buildings from aerial images and 3d surface reconstruction. In:
Proceedings of the Sixth IEEE Workshop on Applications of Com-puter Vision, WACV ’02, IEEE Computer Society, Washington, DC, USA, pp. 215–219.
Frommholz, D., Linkiewicz, M. and Poznanska, A.-M., 2016. In-lining 3d reconstruction, multi-source texture mapping and se-mantic analysis using oblique aerial imagery. In: L. Halounova, K. Schindler, A. Limpouch, T. Pajdla, V. ˇSaf´aˇr, H. Mayer, S. O. Elberink, C. Mallet, F. Rottensteiner, M. Br´edif, J. Skaloud and U. Stilla (eds),XXIII ISPRS Congress, The International Archives of the Photogrammetry, Remote Sensing and Spatial Information Sciences, Vol. XLInumber B3, Copernicus Publications, pp. 605– 612.
Grompone von Gioi, R., Jakubowicz, J., Morel, J.-M. and Ran-dall, G., 2012. LSD: a Line Segment Detector.Image Processing On Line2, pp. 35–55.
Hirschm¨uller, H., 2008. Stereo processing by semiglobal match-ing and mutual information. IEEE Trans. Pattern Anal. Mach. Intell.30(2), pp. 328–341.
Hughes, T. and Sullivan, S., 2015. Splitting 3d buildings is key for detailed 3d spatial analysis. https://cybercity3dglobal.wordpress.com/2015/11/02/splitting-3d-buildings-is-key-for-detailed-3d-spatial-analysis/ (02 Nov. 2015).
Kada, M. and McKinley, L., 2009. 3d building reconstruction from lidar based on a cell decomposition approach. In: The In-ternational Archives of the Photogrammetry, Remote Sensing and Spatial Information Sciences, Vol. XXXVIII (3/W4), pp. 47–52.
Kolbe, T. H., 2009. Representing and exchanging 3d city mod-els with citygml. In: J. Lee and S. Zlatanova (eds),3D Geo-Information Sciences, Lecture Notes in Geoinformation and Car-tography, Springer, Berlin, Heidelberg, chapter 2, pp. 15–31.
Lu, X., Yao, J., Li, K. and Li, L., 2015. Cannylines: A parameter-free line segment detector. In:2015 IEEE International Confer-ence on Image Processing, ICIP 2015, Quebec City, QC, Canada, September 27-30, 2015, pp. 507–511.
Mayer, S., 2002. Gradient based splitting of blocks of houses in high-resolution ortho-images. In:Proceedings of the 2002 Inter-national Conference on Image Processing, ICIP 2002, Rochester, New York, USA, September 22-25, 2002, pp. 769–772.
Meixner, P., Wendel, A., Bischof, H. and Leberl, F., 2012. Build-ing faade separation in vertical aerial images. ISPRS Annals of Photogrammetry, Remote Sensing and Spatial Information Sci-encesI-3, pp. 239–243.
Pedrinis, F. and Gesqui`ere, G., 2017. Reconstructing 3D Building Models with the 2D Cadastre for Semantic Enhancement.Lecture Notes in Geoinformation and Cartographypp. 119 – 135.
Piltz, B., Bayer, S. and Poznanska, A.-M., 2016. Volume based dtm generation from very high resolution photogrammetric dsms. In: L. Halounova, K. Schindler, A. Limpouch, T. Pajdla, V. ˇSaf´aˇr, H. Mayer, S. O. Elberink, C. Mallet, F. Rottensteiner, M. Br´edif, J. Skaloud and U. Stilla (eds), ISPRS Congress, Vol. XLI-B3, pp. 83–90.
Vorschriftensammlung f¨ur das Vermessungswesen, 2016. http://www.stadtentwicklung.berlin.de/service/gesetzestexte/de/ download/geoinformation/Vorschriftensammlung/startseite.pdf.
Vosselman, G. and Dijkman, E., 2001. 3d building model re-construction from point clouds and ground plans. Int. Arch. of Photogrammetry and Remote Sensingpp. 37–43.
Wieden, A. and Linkiewicz, M., 2013. True- oblique-orthomosaik aus schr¨agluftbildern zur extraktion von 3d-geoinformationen. In:DGPF Tagungsband, pp. 354–362.