POINTS CLASSIFICATION BY A SEQUENTIAL HIGHER - ORDER MOMENTS
STATISTICAL ANALYSIS OF LIDAR DATA
F. Crosilla a, , D. Macorig a, I. Sebastianutti b, D. Visintini a
a
Department of Civil Engineering and Architecture, University of Udine, via delle Scienze 206, Udine, Italy – (fabio.crosilla, domenico.visintini)@uniud.it
b
Municipality of Tavagnacco (UD), Piazza Indipendenza 1 - 33010 Feletto Umberto, Udine, Italy – [email protected]
Commissions: V ,WG V/3 – III, WG III/2
KEY WORDS: LIDAR, Classification, Algorithms, Skewness, Kurtosis
ABSTRACT:
The paper deals with a new sequential procedure to perform unsupervised LIDAR points classification by iteratively studying skewness and kurtosis for elevation and intensity point distribution values. After a preliminary local shape analysis of elevation and intensity point distributions, carried out from the original discrete frequencies by a non parametric estimation of the density functions, the procedure starts by choosing the category of data (elevation or intensity) to analyse at first: the choice falls on the category better showing by a testing procedure a bi or a multi clustering distribution. The first point cluster is identified by studying the distribution skewness and kurtosis variations, after removing at each step the largest data values. The selected cluster is furthermore analysed by studying higher order moments behaviour of the complementary data category. This makes possible to find out potential sub clusters of the original selected one, permitting, in this way, a more effective point classification. Successive clusters are identified by applying the same iterative procedure to the still unclassified LIDAR points. For complex point distribution shapes or for the classification of large areas, a progressive analysis method, based on the partition of the entire data set into regular subsets, is proposed. Some real numerical experiments confirm the capability of the method proposed. The classification total errors in the experiments range from a minimum value of 1,2% to a maximum value of 8,9%.
1. BACKGROUND
Up to now, a limited number of algorithms has been proposed to perform unsupervised point classification by studying the behaviour of some statistical parameters of the LIDAR point cloud distribution values. Bartels et al. (2006, 2010) have introduced a “skewness balancing” algorithm able to separate by elevation ground and non ground points, where the first ones can belong to both flat or sloped terrains. In another paper Bao et al. (2007) considered the kurtosis point distribution values analysis, allowing a separation among ground, buildings and vegetation. Antonarikis et al. (2008) subdivided the whole area into cells of small dimension and for each cell the computation of skewness and kurtosis of the points first and last pulses have been computed. Final classification results from the combination of several parameters. A further improvement of the classification process was recently obtained by a combined analysis of skewness and kurtosis distribution functions for elevation and intensity LIDAR point distribution values (Bao et al, 2008; Yunfei et al, 2009; Liu et al, 2009).
As well known from statistics, skewness (sk) is the third moment about the mean. Its distribution value represents the degree of asymmetry around the mean and is defined as
∑ (1)
where N is the number of the points of the cloud, xi the elevation or the intensity value of the i-th point, is the mean value of elevation or intensity computable from
∑
(2)
σ is the standard deviation of all points obtainable from
∑
(3)
A skewness value of zero indicates a symmetric distribution. For elevation data, negative values indicate dominance of valleys while positive values show dominance of peaks. Kurtosis (ku) is instead the fourth moment about the mean. Its value measures the relative flatness or peakedness of the distribution about its mean. It can be computed from
∑ (4)
The normal distribution has a kurtosis equal to 3. Larger values indicate a peak distribution, while smaller values than 3 characterize a valley distribution. In the mentioned literature, skewness and kurtosis are computed every time that the most elevated point and the point with the largest intensity values are sequentially removed from the data set. For instance, by performing the skewness and kurtosis analysis of the intensity sampled data, there is a good probability to well approximate the skewness and kurtosis values of a normal distribution in case of a homogeneous cluster of data. The same holds for a flat terrain in case its elevation values are considered.
For a bi or a multi modal intensity distribution, Gaussian parameters values for kurtosis are satisfied at the last part of the procedure, when the original multi modal distribution is reduced International Archives of the Photogrammetry, Remote Sensing and Spatial Information Sciences, Volume XXXVIII-5/W12, 2011
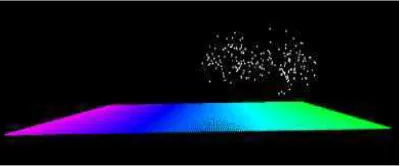
to a single modal behaviour. For this reason the analysis is sequentially carried out for all the sampled LIDAR points in order to identify all the potential clusters. Let’s consider the example reported in the Fig. 1a (red square). It can be noted the presence of ground points with homogeneous intensity and some darker vegetation points. The diagrams of the skewness and kurtosis values are reported in Fig. 1b.
Figure 1a. Example of an area with homogeneous ground points intensity and darker vegetation points.
Figure 1b. Skewness and kurtosis values after removing at each step of the procedure the higher intensity values (see Fig. 1a).
It is possible to note how during the running steps (cycles), when the ground intensity values are successively removed, skewness and kurtosis values continuously change. When skewness is zero and kurtosis presents the minimum value, the distribution is symmetric and the same number of points is expected for the two different clusters. At this point skewness and kurtosis start raising and kurtosis reaches a local maximum (equal to 3) when vegetation points are only present. This fact is also verified by a local maximum of skewness, confirming the only presence of vegetation points belonging to a unique cluster. As suggested by Liu et al (2009) this point separates ground and vegetation. Vegetation points are on the right side (see Fig. 1b) while ground points are on the left side. This behaviour is mainly true for intensity data, not at all for elevation data. In this last case the object geometry deeply conditions the skewness and kurtosis values. As said before, negative skewness values indicate dominance of valleys while positive values show dominance of peaks. Anyway, also in this case it is possible to identify clusters of homogeneous points. This can be easily verified from the example reported in Fig. 2a where two different clusters of LIDAR data are shown. They represent ground points and vegetation (white points).
Figure 2a. Example of two geometrical clusters (ground and vegetation) differently coloured.
Analyzing the skewness and the kurtosis of the sequential
procedure, when all the vegetation points are removed, the two curves become and remain stable till the end of the process (Fig. 2b). Similar results have been also provided by Liu et al (2009).
Figure 2b. Skewness and kurtosis values after removing at each step of the procedure the higher elevation values (see Fig. 2a).
2. THE PROPOSED PROCEDURE
The sequential procedure allows to alternatively use the most effective values between intensity and elevation for classifying an homogeneous cluster of points. If the graph of the distribution is such to prefer the intensity values (pronounced bi or multi modal distribution), from skewness and kurtosis behaviour analysis, the last part of the distribution values will be classified as in Fig 1b. Points located at the right side of the kurtosis local maximum are homogeneously classified, while points located at its left part remain unclassified. A similar approach is still valid if the point classification is carried out for the elevation. Points satisfying for the last part of skewness and kurtosis function values a local flat condition are homogeneously classified, while the others remain unclassified. The same procedure can be applied again to the points just classified, or not yet classified, using the complementary data category; i.e. the intensity analysis is applied to the data already classified by elevation and vice versa. The mixed procedure allows to identify further sub classes, within the already classified ones, or allows to perform a reliable classification of the points still unclassified.
A shape analysis of the point elevation and intensity continuous distributions is carried out at first. A non parametric estimation of the probability density functions can be obtained by a convolution process of a chosen kernel applied to each sampled value (e.g. Epanechnikov, 1969). Given a data set (x1, x2, …, xn) sampled from a distribution having an unknown density function f, the problem is to estimate the shape of this function f from the following relationships:
!∑ "! with " " (5)
where " ⁄ # is the kernel, a non negative density function with integral equal to 1; h > 0 is a real positive parameter defining the size of the sampling class (the default value is 100). Symmetrical density functions, with respect to the origin, are usually applied (a normal function was applied in this case). The procedure chooses the category of data (elevation or intensity) to analyse at first: the choice falls on the category better showing a bi or a multi modal distribution. If the clusters are totally disjoined, the problem does not exist. If this is not the case, further analyses are be carried out.
Hartigan J.A. and Hartigan P.M. (1985) proposed to apply the dip test to measure multimodality in a sample by the maximum difference, over all sample points, between the empirical distribution function and the unimodal distribution function that minimizes that maximum difference. More recently, profile analysis was carried out by applying different strategies like the Bayesian Information Criterion (BIC) score (e.g. Yeoung et al, International Archives of the Photogrammetry, Remote Sensing and Spatial Information Sciences, Volume XXXVIII-5/W12, 2011
2001) and the variational Bayesian approach (e.g. Teschendorff et al, 2005). Teschendorff et al (2006) proposed to integrate to the previous models the analysis of the kurtosis. They showed that in case of a bimodal distribution, a mixture of two approximately equal mass Gaussians must have a kurtosis value less than 3, whereas, in case of highly unequal masses, the kurtosis must be greater than 3. They also found out a relationship among kurtosis, the standardized separation between the two clusters and the minor cluster mass (in percentage of total). Practically, comparing two distribution functions, the best seems to be the one with the kurtosis value much more less than 3.
According to what explained above, the iterative procedure can be summarized by the following five sequential main steps: 1. Non parametric estimation of the probability distribution for
elevation and intensity point values.
2. Choice of the data category to start by testing multimodality of the respective probability distributions.
3. Skewness and kurtosis variation analysis following the point removal and identification of a significant point cluster. 4. Analysis of the selected cluster by the complementary data
category. Identification of potential sub clusters.
5. Go to point 2. and repeat the process for the rest of the data.
The performance of this sequential procedure has been verified by some experiments, for different classification conditions, onto an aerial LIDAR survey of a municipality near Udine.
3. SOME EXPERIMENTS
In the following, the results of two experiments are reported, evaluating at first the category of data to start, i.e. non calibrated intensity or elevation. Thanks to the mixed sequential method, the classes obtained from the first classification run have been furthermore subdivided. Data are relative to a strip of the aerial laser scanning survey of the municipality of Tavagnacco, North of Udine (Italy), carried out in 2007 with a Leica ALS50 sensor. Forty strips have been acquired at a flight height of 1000 m with a point density around 12 pts/sm. A manual point classification has been previously carried out by the program MARS Explorer 6.1; four target classes have been manually identified: ground, street, building, vegetation and other objects (i.e cars).
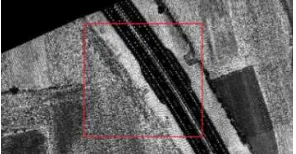
3.1. First experiment. The experiment is related to one of the main applications of the laser points analysis, that is road extraction. A small area of the municipality of Tavagnacco (UD), crossed by the highway, is taken into account (Fig. 3).
Figure 3. Intensity image of the area of the first experiment.
Figure 4. (a) Intensity distribution function and (b) Elevation distribution function for the points of the first experiment.
By analyzing the distribution functions both for intensity (Fig. 4a) and for elevation (Fig. 4b), it is possible to see how it is really hard to clearly distinguish some elevation point clusters, while there exists a clear distinction for what concerns the intensity. This is confirmed by the values of the dip test that furnishes 0,0166 for elevation and 0,0543 for intensity. Thus the choice falls on the computation of skewness and kurtosis for the intensity values obtaining the graph reported in fig 5.
Figure 5. Skewness and kurtosis behaviour for the intensity values of the first experiment.
The decision is to classify the points in correspondence of the maximum value of kurtosis, where a peak value of skewness is also present (cycle 206), obtaining the classification of Fig. 6a.
Figure 6. (a) Point intensity classification. (b) Distribution function for the elevation values of the points classified in red.
How it was logical to expect, the largest part of the points belonging to the asphalted area are correctly classified, more some points belonging to vegetation (upper right part of Fig. 6a) and some sparse ground points. To all these points a provisory classification label was assigned, while the points not yet classified (gray in Fig. 6a) were considered unclassified. The elevation analysis was then applied to the red points in Fig. 6a, obtaining the graph in Fig. 6b.
It seems evident that is possible to separate the points belonging to the small cluster at height 187 m, from those contained in the range 188 m – 191 m. Computing again the skewness and kurtosis coefficients for such points, considering the elevation values, the following behaviour is obtained (Fig. 7).
Figure 7. Skewness and kurtosis values for elevation of the points classified in red in Fig. 6.
It was decided to classify the points according to the elevation following the cycle 2845, in correspondence of a local flatness of the kurtosis. The result makes possible to extract from the red points of Fig. 6a those belonging to the terrain (Fig. 8). International Archives of the Photogrammetry, Remote Sensing and Spatial Information Sciences, Volume XXXVIII-5/W12, 2011
Figure 8. Height classification of the red
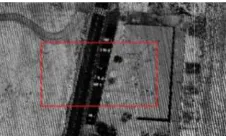
4.2 Second experiment. This experiment significant synthesis of real situations (see the presence of ground, vegetation, road and of a building, besides some disturbing eleme the parking place (with intensity value simila
Figure 9. Particular by intensity of the area second experiment.
Analysing the point distribution by intensit (Fig. 10a, Fig. 10b), it is possible to see i elevations the presence of more than two c graph of intensities there are two classes part
Figure 10. (a) Intensity distribution function distribution function for the points of the se
According to these results, it was dec classification process according to the elevat
Figure 11. Skewness and kurtosis behavi elevation values of the second exp
From the kurtosis behaviour it is possible to a slip in correspondence of the cycle numb removing of the points belonging to the roof drop around the cycle 2450 due to a series (vegetation, cars). It is evident that the first s may be seen in Fig. 10 could be avoided as totally isolated. The analysis could be ca vegetation, cars and ground points. The complete analysis to show the readers the sk behaviour for all the data set. According to th the authors decided to classify the points sta 2856 (flat area of the kurtosis), recognizing ground points (red) from all the others locate
d points in Fig. 6a.
After performing the computation indexes, the behaviour reported in
Figure 14. Behaviour of skewness values of the gro
The points are classified accord correspondence of a local maximu was possible to separate the points the near parking area (see Fig. 15).
Figure 15. Classification by inte
Points not yet classified are now distribution is evaluated. Fig. 16a two partially overlapping families 16b instead reports, the point elev evidence two distinct main clusters one around 211 m.
n by elevation for the second ment.
sify again the ground points lues, with the aim to identify the ig. 13 reports the behaviour of alysed by intensity.
n of the intensity values for the second experiment.
tion of skewness and kurtosis in Fig. 14 was obtained.
ss and kurtosis for the intensity round points.
ording to the cycle 153, in mum of kurtosis. In this way it nts belonging to the road and to
. ters, one around 201 m, another International Archives of the Photogrammetry, Remote Sensing and Spatial Information Sciences, Volume XXXVIII-5/W12, 2011
Figure 16.(a) Intensity distribution function and (b) elevation distribution function for the unclassified points of Fig. 12.
Of course, the cluster relative to a mean elevation of 211 m corresponds to the roof points while the other cluster considers a small residual number of ground points and disturbing points close to the ground, like vegetation, cars and a ramp.
According to these results, it was decided to compute the skewness and kurtosis to the elevation values of the unclassified point cluster, neglecting the roof points (Fig 17).
Figure 17. Behaviour of skewness and kurtosis for the elevations of the unclassified points, neglecting the roof points.
According to the behaviour (Fig. 17), it was decided to classify the point in correspondence of the cycle 778, obtaining the result reported in Fig. 18.
Figure 18. Classification according to the skewness and kurtosis values as in Fig. 17.
In this figure it is possible to immediately see the roof coloured in pink, corresponding to the point cluster with a mean elevation of 211 m, and some small red areas representing residual ground points, not completely identified at the previous iteration (see Fig. 12), and the points of the ramp. In this way, it was possible to separate the roof of the building from the residual ground points, the ramp and a series of disturbing points relative to the cars and low vegetation.
4. EXTENSION TO COMPLEX SITUATIONS
The classification method here proposed works well for small areas, where the presence of only a few modal distribution values can be expected for intensity and elevation. The method becomes prohibitive when applied to large, not homogeneous and complex areas, where a wide multi modal behaviour could be present for intensity and elevation values.
This is the reason for which the classification procedure was thought as a progressive multi analysis method, where the whole area is subdivided into regular sub areas and for each of
these the interactive classification is carried out. Some first experimental results confirm the extendibility of the interactive classification method to complex situations.
Figure 19. Example of a point classification for a complex area.
The experiment was carried out for the complex area reported in Fig. 19. The area is characterized by two flat parts, located at different height, connected by a sloped terrain covered by trees and other kind of vegetation.
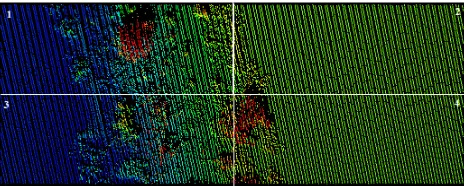
Figure 20. First subdivision of the entire area in four parts.
The whole area was subdivided into four zones (Fig. 20) and for each zone the intensity and the elevation distribution values were computed (see Fig. 21). According to the distribution results of the zones 1 and 3, it was decided to furthermore divide these zones in four parts.
Figure 21. Distribution functions for intensity and elevation for each of the four main areas.
Proceeding in this way, that is after having analysed the shape of the distribution functions for intensity and elevation, the whole area was finally subdivided according to the scheme reported in Fig. 22.
Figure 22. Final subdivision of the entire area.
Performing the skewness and kurtosis analysis for elevation and intensity of each of the unitary zones, the result of progressive and interactive classification is finally reported in Fig. 23. International Archives of the Photogrammetry, Remote Sensing and Spatial Information Sciences, Volume XXXVIII-5/W12, 2011
Figure 23. Final classification result.
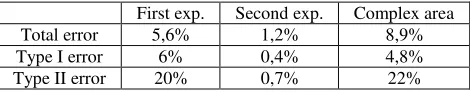
The performance of the algorithm is measured by comparing the classifications against the same referenced data obtained by a manual classification with the program MARS Explorer 6.1. The total error (i.e. number of misclassified points as a percentage of all the points) results equal to 8,9 %. Type I error (i.e. number of misclassified ground points as a percentage of all the ground points) corresponds to 4,8%, while type II error (i.e. number of misclassified vegetation points as a percentage of all the vegetation points) is equal to 22,0%. According to these preliminary results it seems that the algorithm works very well for filtering ground points, also for heavily vegetated slopes, that, according to some results reported in Sithole and Vosselman (2005) are not usually correctly classified with standard packages. In any case, the II type error value would be significantly reduced in case of buildings and other kind of man-made objects. The error values obtained in the three experiments are summarized in Table 24.
First exp. Second exp. Complex area
Total error 5,6% 1,2% 8,9%
Type I error 6% 0,4% 4,8%
Type II error 20% 0,7% 22%
Table 24. Error values in the three experiments.
5. CONCLUSIONS
The paper proposes a new LIDAR point classification method based on the sequential skewness and kurtosis analysis of elevation and intensity point distribution values, after removing at each step of the process the largest data values as suggested by Liu et al. (2009). After a preliminary shape analysis of elevation and intensity point distribution, the new procedure starts by choosing the category of data showing a significant bi or multi clustering distribution. The method extracts the first data cluster that is furthermore analysed by studying skewness and kurtosis behaviour of the same points belonging to the complementary data category. This makes possible to iteratively find out potential sub clusters of the original selected one. Successive clusters are identified applying the same mixed procedure to the unclassified LIDAR points, sequentially avoiding those points classified at the last iteration.
A progressive multi analysis extension of the proposed method was also proposed for performing point classification in complex or large areas. Some real numerical experiments confirm the good applicability of the method also for ground point filtering in case of vegetated slopes.
REFERENCES
Antonarakis, A.S., Richards, K.S., Brasington, J., 2008. Object-based land cover classification using airborne LiDAR. In: Remote Sensing of Environment 112 (2008), pp. 2988–2998.
Bao, Y., Cao, C., Chang, C., Li, X., Chen, E., Li, Z., 2007. Segmentation to the clouds of LIDAR data based on change of Kurtosis. In: International Symposium on Photoelectronic Detection and Imaging 2007. Beijing.
Bao, Y., Li, G., Cao, C., Li, X., Zhang, H., He, Q., Bai, L., Chang, C., 2008. Classification of LIDAR point cloud and generation of DTM from LIDAR height and intensity data in forested area. In: The International Archives of the Photogrammetry, Remote Sensing and Spatial Information Sciences,Beijing, China, Vol. XXXVII, Part B3b.
Bartels, M., Wei, H., 2006. Segmentation of LIDAR Data using measures of distribution. In: The International Archives of the Photogrammetry, Remote Sensing and Spatial Information Sciences, Enschede, the Netherlands, Vol, XXXVI, Part 7.
Bartels, M., Wei, H., Mason, D., 2006. DTM Generation from LIDAR Data using Skewness Balancing. In: 18th International Conference on Pattern Recognition (ICPR'06) Volume 1, pp. 566-569.
Bartels, M., Wei, H., 2010. Threshold-free object and ground point separation in LIDAR data. In Pattern recognition letters 31 (2010), pp. 1089-1099.
Epanechnikov, V.A., 1969. Non-Parametric estimation of a multivariate probability density. Theory of the Probability and its Applications, 14, pp. 153-158.
Hartigan, J.A., Hartigan, P.M., 1985. The dip test of unimodality. The annals of Statistics, 13, n. 1, pp. 70-84.
Liu, Y., Li, Z., Hayward, R., Walker, R., Jin, H., 2009. Classification of Airborne LIDAR Intensity Data Using Statistical Analysis and Hough Transform with Application to Power Line Corridors. In: 2009 Digital Image Computing: Techniques and Applications, pp. 462-467.
Sithole, G., Vosselman, G., 2005. Filtering of airborne laser scanner data based on segmented point clouds. In: The International Archives of the Photogrammetry, Remote Sensing and Spatial Information Sciences, Enschede, the Netherlands, Vol. XXXVI, Part 3/W19, pp. 66-71.
Teschendorff, A.E., Wang, Y, Barbosa-Morais, N., Brenton, J.D., Caldas, C., 2005. A variational bayesian mixture modelling framework for cluster analysis of gene-expression data. Bioinformatics, 21, pp. 3025-3033.
Teschendorff, A.E., Naderi, A., Barbosa-Morais, N., Caldas, C., 2006. Pack: Profile Analysis using Clustering and Kurtosis to find molecular classifiers in cancer. Bioinformatics, 22, pp. 2269-2275.
Yeoung, K.Y., Fraley, C., Murua, A., Raftery, A.E., Ruzzo, W.L., 2001. Model-based clustering and data transformations for gene expression data. Bioinformatics, 17, n. 10, pp. 977-987.
ACKNOWLEDGEMENTS
The authors thank Dr. Daniele Piccolo for providing some statistical testing computations by the R package.