ESTIMATING CORN YIELD IN THE UNITED STATES WITH MODIS EVI AND
MACHINE LEARNING METHODS
K. Kuwataa,∗
, R. Shibasakib a
Deptartment of Civil Engineering, The University of Tokyo - [email protected] bCenter for Spatial Information Science, The University of Tokyo - [email protected]
Commission VIII, WG VIII/8
KEY WORDS:Support Vector Machine, Artificial Neural Network, Deep Learning, MODIS EVI, Wavelet Transform, Corn Yield
ABSTRACT:
Satellite remote sensing is commonly used to monitor crop yield in wide areas. Because many parameters are necessary for crop yield estimation, modelling the relationships between parameters and crop yield is generally complicated. Several methodologies using machine learning have been proposed to solve this issue, but the accuracy of county-level estimation remains to be improved. In addition, estimating county-level crop yield across an entire country has not yet been achieved. In this study, we applied a deep neural network (DNN) to estimate corn yield. We evaluated the estimation accuracy of the DNN model by comparing it with other models trained by different machine learning algorithms. We also prepared two time-series datasets differing in duration and confirmed the feature extraction performance of models by inputting each dataset. As a result, the DNN estimated county-level corn yield for the entire area of the United States with a determination coefficient (R2
) of 0.780 and a root mean square error (RM SE) of 18.2 bushels/acre. In addition, our results showed that estimation models that were trained by a neural network extracted features from the input data better than an existing machine learning algorithm.
1. INTRODUCTION
Both population growth and increasing incomes are expected to increase food demand. Global food production has to be in-creased by more than 70% between 2005 and 2050 to feed the projected world population of 9.1 billion people in 2050 (FAO, 2011). Therefore, the proper management of agricultural produc-tion is vital to mitigate the risk of food shortages. The accurate estimation of crop yields is essential for decision-making regard-ing regional and global food security issues (Wang and Zhang, 2013). Satellite remote sensing serves an important role in moni-toring crop yields at the global scale (Hall and Badhwar, 1987).
Satellite remote sensing is highly useful for monitoring large-scale crop areas due to its ability to acquire the information needed for managing croplands over large areas simultaneously. The enhanced Vegetation Index (EVI) derived from MODIS satellite data has been applied to observe crop conditions (Galford et al., 2008, Wardlow et al., 2007). Although the MODIS-based EVI is often affected by cloud contamination, several methods were proposed to improve the data for monitoring seasonal changes in vegetation, such as smoothing time-series variation by applying the wavelet transform (Sakamoto et al., 2005).
Traditionally, statistical methods have been used for estimating yields of various crop types. However, such methods are not use-ful in cases when many factors and relationships must be con-sidered (Paswan and Begum, 2013). When estimating crop yield at regional and national scales, estimation accuracy is degraded and uncertainty increased by heterogeneity of environmental con-ditions, including the irrigation system, fertilizer application rate, climate meteorological conditions, and soil (Conradt et al., 2014).
To handle the complicated factors and relationships in estimat-ing crop production, machine learnestimat-ing techniques such as support vector machine (SVM) and artificial neural network (ANN) have
∗
Corresponding author
been applied (Karimi et al., 2008, Paswan and Begum, 2013). However, those techniques still require human efforts to identify features for accurate estimation. In contrast, the deep learning (DL) technique does not require such human efforts due to its mechanism for creating a multi-layered neural network using a multiple restricted Boltzmann machine or an autoencoder (Erhan et al., 2010). Although DL has the potential to be applied in crop yields estimation, no such applications have been demonstrated so far.
Corn is an important staple crop that is cultivated globally; it has a huge impact on food security (HLPE, 2013). In this paper, we report on the performance of DL applied to county-level corn yield estimation across the United States by using MODIS-based EVI and daily metrological data as compared to that of SVM and ANN.
2. MATERIALS AND METHODS
2.1 Materials
We used Daymet and EVI calculated from MOD09A1 as the in-put data for the corn yield estimation model (Table 2.1). We se-lected cornfields from the cropland data layer to mask the input data on cornfields. We selected corn yield data as the target data of corn yield estimation model in this study.
Table 2.1 shows breif information of the dataset used in this study.
2.1.1 Crop yield data Annual county-level corn yield
Table 1: The dataset in this study
Name Content Spatial resolution Distributor
Corn yield Annual corn yield County level USDA
MOD09A1 Surface reflectance 500 m NASA
Cropland Data Layer Land cover map 30 m USDA
Daymet Weather data 1 km NASA
Acqusition time was 2008-2013 for all data.
1975 1980 1985 1990 1995 2000 2005 2010
Year
60 80 100 120 140 160 180 200 220
C
or
n
y
iel
d
(b
u
sh
el
s/
a
cr
e) Corn yield5 yr. simple moving average Fitted line
Figure 1: Corn yield in McLean, Illinois
Figure 2: Corn yield of counties in 2008
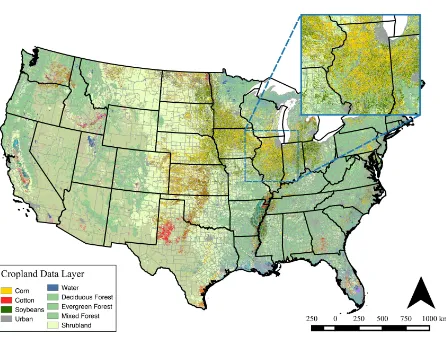
Figure 3: Cropland Data Layer
2.1.2 Cropland Data Layer The cropland data layer (CDL)
contains a crop-specific land cover classification data, in which land cover is classified into more than 100 crop categories, for agricultural land in the United States (USDA, NASS, RDD, 2013). The cornfield layer extracted from the CDL was used to mask the weather data and EVI because this study targets on corn yield. Figure 3 shows CDL in 2008; yoellow pixels represent cornfields.
2.1.3 MODIS EVI Satellite-based vegetation indices are
of-ten used for estimating agricultural products. The EVI is a veg-etation signal with improved sensitivity in high biomass regions (Huete et al., 2002). We calculated EVI from MOD09A1, which is an 8-day surface reflectance dataset developed with the best possible observation coverage, low view angle, absence of clouds or cloud shadow, and aerosol loading (Vermote, 2015). The spa-tial resolution of MOD09A1 is 500 m; the data were acquired from the Land Processes Distributed Active Archive Center (LP DAAC;https://lpdaac.usgs.gov/). We calculated EVI by equation (1).
EV I=G×ρ ρnir−ρred
nir+C1×ρred−C2×ρblue+L
(1)
where G= gain factor
ρred= MODIS band 1 (620-670nm) ρnir= MODIS band 2 (841-876nm) ρblue= MODIS band 3 (459-479nm) C1andC2= aerosol resistance wights
L= the canopy background adjustment factor
The coefficients for the MODIS data areG= 2.5,L= 1,C1= 6,C2= 6, andC2= 7.5.
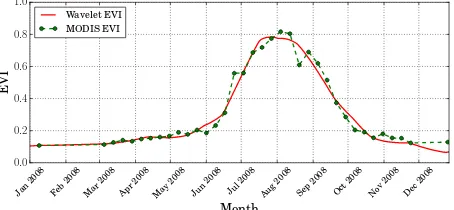
Time-series MODIS EVI data typically contain noise induced by cloud contamination and atmospheric variability. Previous stud-ies used the wavelet transform for smoothing time-serstud-ies vege-tation index data for better identification of crop phenological stages (Sakamoto et al., 2005). We applied the wavelet transform to remove noise.
2.1.4 Daymet The Daymet dataset provides gridded estimates
of daily weather parameters for North America (Thornton et al., 2014). The spatial resolution of Daymet is 1 km. We used daily surfaces of minimum and maximum temperature, precipitation, humidity, shortwave radiation, snow water equivalent as the in-put data of corn yield estimation models.
2.2 Methodology
Figure 4 shows a flow diagram of our methodology. We prepared two types of the input datasets that differ in duration and used several machine learning algorithms to evaluate each estimation method.
2.2.1 Smoothed MODIS EVI Wavelet shrinkage is a
nonlin-ear method (Donoho, 1995) comprised of three steps: (1) com-pute the wavelet coefficients from the original signals; (2) re-place the coefficients with 0 if absolute values are smaller than the threshold; and (3) reconstruct the signals by using the inverse wavelet transform. This method is often used for data compress-ing and signal denoiscompress-ing (Aggarwal and Rathore, 2011). The sig-nal, f(x), is transformed in the wavelet transform as equation (2).
W f(x) =
Z +∞
−∞
f(x)√1 aψ(
a−b
MODIS EVI
Daymet Smoothed
EVI
5 days accumulation dataset CDL & county
polygon
Masking with CDL & county
polygon
Figure 4: Flow diagram of methodology used in this study
where ψ= a mother wavelet function
a= a scaling parameter
b= a shifting parameter
In this study, Coiflet 2 was used as a mother wavelet function. We used the hard thresholding method (Donoho, 1995) to remove noise from MODIS EVI. The threshold is calculated by the fol-lowing equations (3-5).
λ=σp2 logn (3)
σ= M AD
0.6475 (4)
where λ= a threshold
σ= variance of noise
n= sample number of the signals
M AD= meadian absolute deviation
The following condition equation shows the hard threshold.
Hard threshold:
y= 0 if|x|< λ
y=x if|x|> λ (5)
Figure 5 shows time-series MODIS EVI and EVI smoothed by the hard threshold method. Figure 6 shows a map of smoothed EVI across the United States.
Jan
Figure 5: MODIS EVI and EVI smoothed by the wavelet trans-form
2.2.2 Normalizing the input data Meteorological data from
Daymet and MODIS EVI were input data for the corn yield esti-mation model in this study, and those data have different ranges.
Figure 6: MODIS EVI smoothed by the wavelet transform (2008/7/18)
Therefore, data preprocessing was essential to normalize the digi-tal information. In this study, for normalization the standard score was applied and computed by using equation (6).
X′
(t) = X(t)−µt
σt
(6)
where µt= mean of accumulation value during periodt σt= variance of accumulation value during periodt
Standard score converts the group of data to a frequency distribu-tion with a mean of 0 and a standard deviadistribu-tion of 1.
Daymet contains daily meteorological data, and MODIS EVI is interpolated into daily data by wavelet smoothing. Because ap-plication of the standard score requires calculating the mean and variance of period t(equation (6), we used two input dataset: a daily dataset and a 5-day accumulation dataset. For the daily dataset, we calculated the mean and the variance of datetfor 5 years (2008-2013). For the 5-day accumulation, we calculated the mean and variance of every 5 days from January 1 to Decem-ber 31 for 5 years. The daily input dataset has 2552 dimensions, and the 5-day accumulation input dataset has 512.
2.2.3 Masking the input data Using the three datasets
….
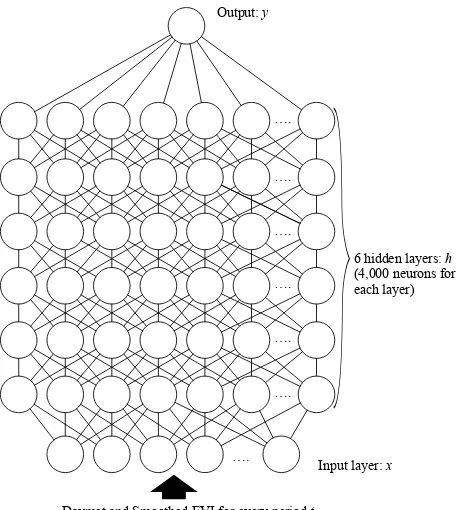
Daymet and Smoothed EVI for every period t
6 hidden layers: h
(4,000 neurons for each layer)
Figure 7: Diagram of the deep neural network used in this study
2.2.4 Support Vector Machine The SVM (Vapnik, 1995) is
a supervised nonparametric statistical learning algorithm. SVM has been used in numerous applications for aerial-satellite remote sensing (Mountrakis et al., 2011), such as estimating vegetation characteristics as a regression problem. We used the radial ba-sis function as a kernel function and optimized hyper-parameters with a grid search.
2.2.5 Artificial Neural Network Remotely sensed data has
been used to develop crop yield estimation models with ANN (Jiang et al., 2004, Li et al., 2007). ANN is a simulation model that represents the neural network of the brain. It is expected to develop models with a strong nonlinearity between different parameters and crop production.
DL is a new machine learning method that is constructed by a multi-layered neural network. Researchers using DL have had great success in image recognition and other complex issues that are difficult to solve with earlier methods (Le et al., 2011).
We developed deep neural network (DNN) models including six hidden layers (Figure 7), each hidden layer contains 4000 neu-rons. We also developed a cron yield estimation model by using an autoencoder, which is a neural network that has a small central layer (Figure 8). This small central layer is trained to reconstruct a high-dimensional input vector and used to represent more im-portant features. This method is called pre-training and provides a great advantage by beginning the computation with better pa-rameters. Pre-training was done before the actual computation.
We used the mini-batch method (Cotter et al., 2011) to train the ANN models.
2.2.6 Evaluation The performance of each corn yield estima-tion model developed by SVM and ANN was evaluated with the root mean square error (RM SE) and the coefficient of determi-nation (R2
). In this study, the total number of data was 9676. Approximately 80% of the dataset (7800) was used for training,
Input layer: x
Output: y
Central layer: h
Encoder Decoder
Output layer: x’
Daymet and Smoothed EVI for every period t
….
….
….
….
Figure 8: Diagram of the autoencoder used in this study
and the rest was used to evaluate the accuracy of the estimation models.
TheRM SEprovides a general purpose error metric for numeri-cal predictions.RM SEis calculated by using equation (7).
RM SE=
where N= sample number of the test dataset
yi= actual corn yield data acquired from the USDA
ˆ
yi= estimated corn yield
R2
is a measure of how well a model fits a dataset; we calculated it by using equation (8).
R2
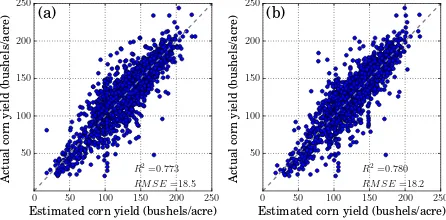
The corn yield estimation model developed by SVM with 5-day accumulation input dataset had the best accuracy in this study (Figure 9, Table 2). However, when the SVM model was trained by the daily input dataset, the accuracy was worse. In contrast, the estimation model trained by an autoencoder with the daily in-put dataset had better accuracy than the autoencoder model with the 5-day accumulation input dataset (Figure 10). For DNN (the ANN with six hidden layers), the model trained with 5-day accu-mulation input dataset had higher accuracy than when using the daily input dataset (Figure 11), but the result of using the daily input dataset was better than the case of the estimation model trained by SVM.
Table 2: Estimation results with several models
Daily input dataset 5-day accumulation dataset
RM SE R2
RM SE R2
SVM 20.4 0.727 17.7 0.792
Autoencoder 19.0 0.759 21.3 0.700
DNN (six hidden layers) 18.5 0.773 18.2 0.780
0 50 100 150 200 250
Estimated corn yield (bushels/acre) 50
Estimated corn yield (bushels/acre) 50
(a) daily input dataset, (b) 5-day accumulation dataset
Figure 9: Corn yield estimation with SVM
0 50 100 150 200 250
Estimated corn yield (bushels/acre) 50
Estimated corn yield (bushels/acre) 50
(a) daily dataset, (b) 5-day accumulation dataset
Figure 10: Corn yield estimation with an autoencoder
0 50 100 150 200 250
Estimated corn yield (bushels/acre) 50
Estimated corn yield (bushels/acre) 50
(a) daily input dataset, (b) 5-day accumulation dataset
Figure 11: Corn yield estimation with deep neural network (six hidden layers)
Corn yield of counties that had small or few cornfields in the crop-land data layer resulted in a difference of more than 50 bushels/acre between the actual and estimated values. This difference between actual and estimated values was smaller for major areas of corn-fields.
4. CONCLUSION
Our results showed that accurate estimation of crop yield across a wide area is possible by using machine learning and remote sensing data.
Corn yield estimation models trained by DNN and an autoen-coder better extracted features from the high-dimensional input data. Therefore, DNN and autoencoders are promising methods for improving the accuracy of crop yield estimation by integrat-ing more data, such as soil properties, irrigation, and fertilization, into the input dataset.
In recent years, the digitalization of agricultural information has advanced, and various types of agricultural data are stored. These datasets can be utilized for estimation models with machine learn-ing. However, standardization of information is one of the great-est challenges, particularly the linkage with legacy data and sys-tems developed in existing and future research. Agricultural on-tologies are expected to promote integration among different sys-tems and data (Nagai et al., 2014).
Crop yield estimation at county level is not sufficient for estimat-ing crop yield at smaller scale. In this study, the spatial resolution of the input data was 1 km, which is more precise than the spatial resolution of the target data. By using the crop yield estimation model developed in this study, we can downscale the estimated crop yield by inputting the data at 1 km spatial resolution.
ACKNOWLEDGEMENTS
This research was supported by Data Integration and Analysis System (DIAS), a project of Green Network of Exellence (GRENE) funded by the Japanese Ministry of Education, Culture, Sports, Science and Technology (MEXT), and grants from the Project of the NARO Bio-oriented Technology Research Advancement In-stitution (Integration research for agriculture and interdisciplinary fields).
REFERENCES
Aggarwal, R. and Rathore, S., 2011. Noise Reduction of Speech Signal using Wavelet Transform with Modified Universal Thresh-old. International Journal of Computer Applications 20(5), pp. 14–19.
Conradt, S., Bokusheva, R., Finger, R. and Kussaiynov, T., 2014. Yield trend estimation in the presence of farm heterogeneity and non-linear technological change. Quarterly Journal of Interna-tional Agriculture 53(2), pp. 121–140.
Cotter, A., Shamir, O., Srebro, N. and Sridharan, K., 2011. Bet-ter mini-batch algorithms via accelerated gradient methods. In: J. Shawe-Taylor, R. S. Zemel, P. L. Bartlett, F. Pereira and K. Q. Weinberger (eds), Advances in Neural Information Processing Systems 24, Curran Associates, Inc., pp. 1647–1655.
Donoho, D. L., 1995. De-noising by Soft-thresholding. IEEE Trans. Inf. Theor. 41(3), pp. 613–627.
Erhan, D., Courville, A. and Vincent, P., 2010. Why Does Unsu-pervised Pre-training Help Deep Learning ? Journal of Machine Learning Research 11, pp. 625–660.
Galford, G. L., Mustard, J. F., Melillo, J., Gendrin, A., Cerri, C. C. and Cerri, C. E., 2008. Wavelet analysis of MODIS time series to detect expansion and intensification of row-crop agriculture in Brazil. Remote Sensing of Environment 112(2), pp. 576–587.
Hall, F. G. and Badhwar, G. D., 1987. Signature-Extendable Technology: Global Space-Based Crop Recognition. IEEE Transactions on Geoscience and Remote Sensing GE-25(1), pp. 93–103.
HLPE, 2013. Biofuels and food security. Technical report, the High Level Panel of Experts on Food Security and Nutrition.
Huete, A., Didan, K., Miura, T., Rodriguez, E., Gao, X. and Fer-reira, L., 2002. Overview of the radiometric and biophysical per-formance of the MODIS vegetation indices. Remote Sensing of Environment 83(1-2), pp. 195–213.
Jiang, D., Yang, X., Clinton, N. and Wang, N., 2004. An ar-tificial neural network model for estimating crop yields using remotely sensed information. International Journal of Remote Sensing 25(9), pp. 1723–1732.
Karimi, Y., Prasher, S. O., Madani, A. and Kim, S., 2008. Ap-plication of support vector machine technology for the estimation of crop biophysical parameters using aerial hyperspectral obser-vations. Canadian Biosystems Engineering.
Le, Q. V., Ranzato, M., Monga, R., Devin, M., Chen, K., Corrado, G. S., Dean, J. and Ng, A. Y., 2011. Building high-level features using large scale unsupervised learning. International Conference in Machine Learning p. 38115.
Li, A., Liang, S., Wang, A. and Qin, J., 2007. Estimating Crop Yield from Multi-temporal Satellite Data Using Multivariate Re-gression and Neural Network Techniques. Photogrammetric En-gineering & Remote Sensing 73(10), pp. 1149–1157.
Mountrakis, G., Im, J. and Ogole, C., 2011. Support vector machines in remote sensing: A review. ISPRS Journal of Pho-togrammetry and Remote Sensing 66(3), pp. 247–259.
Nagai, M., Rajbhandari, A., Ono, M. and Shibaski, R., 2014. In-formation Search, Integration, and Personalization: International Workshop, ISIP 2013, Bangkok, Thailand, September 16–18, 2013. Revised Selected Papers. Springer International Publish-ing, Cham, chapter Earth Observation Data Interoperability Ar-rangement with Vocabulary Registry, pp. 128–136.
Paswan, R. P. and Begum, S. A., 2013. Regression and Neu-ral Networks Models for Prediction of Crop Production. In-ternational Journal of Scientific & Engineering Research 4(9), pp. 98–108.
Sakamoto, T., Yokozawa, M., Toritani, H., Shibayama, M., Ishit-suka, N. and Ohno, H., 2005. A crop phenology detection method using time-series MODIS data. Remote Sensing of Environment 96(3-4), pp. 366–374.
Thornton, P., Thorthon, M., Mayer, B., Wilhelmi, N., Wei, Y., Devarakonda, R. and Cook, R., 2014. Daymet: Daily Surface Weather Data on a 1-km Grid for North America, Version 2.
USDA, NASS, RDD, G. I., 2013. USDA, National Agricultural Statistics Service, Cropland Data Layer for the United States.
Vapnik, V. N., 1995. The Nature of Statistical Learning Theory. Springer-Verlag New York, Inc., New York, NY, USA.
Vermote, E., 2015. MOD09A1 MODIS/Terra Surface Re-flectance 8-Day L3 Global 500m SIN Grid V006.
Wang, K. and Zhang, Q., 2013. Crop yield risk assessment. In: Intelligent Systems and Decision Making for Risk Analysis and Crisis Response, Communications in Cybernetics, Systems Sci-ence and Engineering & Proceedings, CRC Press, pp. 709–716.