KNOWLEDGE BASED 3D BUILDING MODEL RECOGNITION USING
CONVOLUTIONAL NEURAL NETWORKS FROM LIDAR AND AERIAL IMAGERIES
F. Alidoost*, H. Arefi
School of Surveying and Geospatial Engineering, College of Engineering, University of Tehran, Tehran, Iran - (falidoost, hossein.arefi)@ut.ac.ir
ICWG III/VII
KEY WORDS: Deep Learning, Convolutional Neural Network, Pattern Recognition, LiDAR, 3D Building Model
ABSTRACT:
In recent years, with the development of the high resolution data acquisition technologies, many different approaches and algorithms have been presented to extract the accurate and timely updated 3D models of buildings as a key element of city structures for numerous applications in urban mapping. In this paper, a novel and model-based approach is proposed for automatic recognition of buildings’ roof models such as flat, gable, hip, and pyramid hip roof models based on deep structures for hierarchical learning of features that are extracted from both LiDAR and aerial ortho-photos. The main steps of this approach include building segmentation, feature extraction and learning, and finally building roof labeling in a supervised pre-trained Convolutional Neural Network (CNN) framework to have an automatic recognition system for various types of buildings over an urban area. In this framework, the height information provides invariant geometric features for convolutional neural network to localize the boundary of each individual roofs. CNN is a kind of feed-forward neural network with the multilayer perceptron concept which consists of a number of convolutional and subsampling layers in an adaptable structure and it is widely used in pattern recognition and object detection application. Since the training dataset is a small library of labeled models for different shapes of roofs, the computation time of learning can be decreased significantly using the pre-trained models. The experimental results highlight the effectiveness of the deep learning approach to detect and extract the pattern of buildings’ roofs automatically considering the complementary nature of height and RGB information.
* Corresponding author
1. INTRODUCTION
Nowadays reconstruction of 3D building models is one of the most challenging and widely studied topics in remote sensing and photogrammetric research institutions. Automatic detection and extraction of buildings in urban areas using remotely sensed data are fundamental tasks for 3D reconstruction in various applications such as urban mapping, 3D city generation, geographic information system updating and monitoring and navigation. So far, many methods and techniques are proposed to extract and recognize the different objects in optical images which can be analysed based on different aspects such as the type of implemented data, the available primary knowledge, and the selected applicable algorithm.
In recent photogrammetry and remote sensing applications, laser scanning and optical imaging technologies are two widely used data sources for 3D building extraction. Aerial laser scanners record 3D point clouds as well as intensity of objects as their raw outputs. Aerial or satellite sensors, on the other hand, provide some grey scale images in a 2D plane. Each of these technologies has their own advantages and disadvantages (Haala, et al., 1999; Kim and Habib, 2009). For instance, the optical sensors acquire intensity images with high resolution and high information content but only in 2D space and therefore, the extraction of 3D data from these images are usually difficult. On the other hand, the 3D coordinates of points are recorded very fast and accurate using the laser scanners, but without photometric information of objects. Due
to the weaknesses and strengths of each individual data, the combination of 2D optical and 3D laser data is served as complementary information for building detection (Vu, et al., 2009; Salah, et al., 2009; Hermosilla, et al., 2011; Zhou, et al., 2014).
In recent years several methods have been developed for building detection and recognition which can be categorized into three general methods based on the degree of contextual knowledge as model driven, data driven and hybrid methods (Schwalbe, et al., 2005; Wichmann, et al., 2015). In the model driven or top-down approaches, based on the primary knowledge about the shape of buildings in the area of interest, a set of predefined models is created as a library of parameterized shapes and fitted into extracted points of buildings to evaluate the best 3D model. The main advantage of the model driven approaches is robustness especially in case of insufficient building points due to incomplete data (Sohn, et al., 2007) and also the final models have correct topology (Wichmann, et al., 2015). In model driven approach, since the library might not be included the knowledge for all types of buildings, some buildings especially with complex structures may be not modelled completely. In the data driven or bottom-up approaches, the points related to the roof top are extracted based on a set of building measurements and are grouped into different roof planes with 2D topology and are used for 3D modelling (Zhang, et al., 2012). The main advantage of the data driven approach is that there is no need to have a prior knowledge of specific building structure, however this method The International Archives of the Photogrammetry, Remote Sensing and Spatial Information Sciences, Volume XLI-B3, 2016
requires very dense collection of building’s points to reconstruct the 3D models correctly (Sohn, et al., 2007). In the third group of modelling approaches, the combination of model driven and data driven algorithms is used to have an optimal method for compensating the weakness of each methods. According to our study, current methodologies and algorithms on building detection and extraction problem can be divided into four groups as; plan fitting based methods (Mongus, et al., 2014); filtering and thresholding based methods (Maltezos, et al., 2015; Hermosilla, et al., 2011) such as morphological methods (Yu, et al., 2010); segmentation based methods such as binary space partitioning (Wichmann, et al., 2015), shadow based segmentation (Singh, et al., 2015; Ngo, et al., 2015), and region growing based algorithms (Matikainen, et al., 2010; Awrangjeb, et al., 2013); and finally the latest group, different supervised classification methods (Hermosilla, et al., 2011; Guo, et al., 2011; Karantzalos, et al., 2015; Vakalopoulou, et. al, 2011).
A model based approach using the combination of LiDAR data and aerial images can be used to extract buildings. For this, a 3-D primitives’ library from buildings is created which includes the aspects of buildings. Then, a graph is constructed to represent the face aspects and attributes of buildings obtained by the formulated coding regulations. So the buildings can be extracted based on the aspect graph at a successful rate of 93% (Zhou, et al., 2014). Instead of using LiDAR data, the height information of objects presented a DTM/DSM can be extracted from multi view images for model based building detection techniques. The extracted buildings from DSM and rule-based classification results are fused to reconstruct the building models by a grammar-based approach at 88% detection rate (Karantzalos, et al., 2015). Moreover, the problem of model based building detection can be solved using a DSM generated from satellite images and stereo matching techniques. For this, segmentation is performed inside each footprint boundary of buildings to generate the quadrilateral primitives and then the best fitted models are calculated to reconstruct the buildings (Partovi, et al., 2014). A data driven method based on modified grab cut partitioning algorithm can be developed for automatic building extraction from satellite images. The initial locations of buildings are estimated by shadow analysis and then buildings’ pixels are separated from other objects in an optimization solution (Khurana, 2015). Another data driven method for building detection using LiDAR data was developed based on multi-scale data decomposition. In this method, planar points can be extracted using a new algorithm for local fitting surfaces (LoFS). Next, regions with similar geometrical and surface properties but with different contexts are separated by analysing of planar ground and non-ground regions. The result with the completeness, correctness and quality values of about 94.0%, 94.3% and 88.9% for each area has been reached respectively (Mongus, et al., 2014).
One of the state-of the-art supervised classification methods is based on Convolutional Neural Networks (CNNs) which is widely employed in many computer vision and machine learning applications such as pixel level classification and automatic object detection and recognition (Zeiler, et al., 2014; Bengio, 2009; Deng, et al., 2009; Liu, et al., 2015). A scalable detection algorithm called Region based CNN (R-CNN) is developed by Girshick, et al. (2015) to detect the objects in 2D computer vision images automatically. In this method, the selective search algorithm (Uijlings, et al., 2013) is used to localize the objects as candidate regions and then these regions feed to the CNN to extract a fixed-length feature vector for each region. These feature vectors are then compared to a fine-tuned pre-trained model to score regions and find the best class for 2007 and 2012 benchmarks highlight the significant improvement on detection performance (Zhang, et al., 2015). A 3D object recognition method based on CNNs is developed by Alexandre (2016) using RGB-Depth data. In this methods, a CNN is trained for each image band (red, green, blue and depth) separately such that the weights vector for each CNN will be SVM classifier to separate building and non-building objects. Then, an MRF model is employed to obtain the final labels for each class of objects (Vakalopoulou, et al., 2015). To extract the buildings from aerial images, Yuan, et al. (2016) designed a CNN by combining multi-stage feature maps and used the signed distance function for boundary representation. The CNN model is trained from scratch (with random initialization) for effectiveness and robustness have become increasingly important. Up to now, there are not existing many researches on 3D building detection and recognition based on CNNs and other deep learning algorithms using remotely sensed data. In this paper, the building detection as well as the 3D recognition of roof top models such as flat, gable, hip, pyramid hip and mansard roofs models is investigated using a LiDAR DSM and aerial ortho-photos.
2. CONVOLUTIONAL NEURAL NETWORK (CNN)
The summary of deep learning concept and convolutional networks are described in this section. Deep Learning (DL) refers to a new area of machine learning and Artificial Neural Network (ANN) with multilayer perceptron concept and hierarchical learning structure (Bengio, 2009; Deng, et al., 2009; Liu, et al., 2015). Deep Learning is based on the learning multiple levels of representation to present a more efficient solution and is currently used in many applications including object detection (Girshick, et al., 2015), scene classification (Zou, et al., 2015), semantic labeling (Long, et al., 2015), (Filipe, et al., 2014). CNN usually accepts the image data with optional dimension as an input layer and generates a vector of highly distinguishable features related to object classes as an output layer. The hidden layers include the convolutional layers, sampling layers (pooling layers) and the fully connected layers (Phung, et al., 2009; Liu, et al., 2015). Typical CNN architecture is shown in Figure 1. The convolutional layer consists of different learnable weights and biases which are The International Archives of the Photogrammetry, Remote Sensing and Spatial Information Sciences, Volume XLI-B3, 2016
applied to sample windows of the input layer like filters with different sizes and depths based on convolution algorithm and a feature map is generated for each sample and each filter. These feature maps are stacked to each other to form a convolutional layer (Phung, et al., 2009). The sampling layer is a non-linear down sampling function such as maximum pooling, average pooling or even L2-norm pooling that causes to progressively reduce the spatial size of the input layer (Phung, et al., 2009). The fully connected layer is the final layer of the network with high-level features and each neuron of this layer is connected to exactly one of the previous feature map (Phung, et al., 2009).
Figure 1. Architecture of LeNet-5, a CNN (Lecun, et al., 1998)
Generally, there are two common approaches for training a CNN model as training from scratch with random values of weights, as well as fine-tuning of a pre-trained model (Maitra, et al., 2015; Girshick, et al., 2015). In first method, a large collection of data in various classes should be used to train the several million parameters of a CNN model based on the random values of the weight and bias vectors which needs a high capacity of memory and time as well as a large number of repetition rate to converge the training process and achieve high accuracy. Since there is a small and insufficient training dataset in many applications, the CNNs cannot train from the scratch and random initializations due to over fitting problem. In this case, an existence pre-trained model is utilized as a start point for training the dataset with optional number of classes. For this, the Stochastic Gradient Descent (SGD) (Girshick, et al., 2015) as a back propagation algorithm is employed to adapt the weight and bias values of each CNN layer to small dataset with acceptable training accuracy.
3. METHODOLOGY
Pattern recognition of buildings’ roofs is an important issue to generate an accurate 3D model of buildings. In this paper, the 2D image data is enriched with height information of buildings using a CNN framework which is particular useful to have an automatic and robust detection of buildings in urban areas. The main steps of this approach are as follows (cf. Figure 2):
I. Data Preparing Step II. Data Training Step III. Data Testing Step
As shown in Figure 2, three strategies are proposed to combine the optical images (RGB bands) and height data (high training a CNN for DSM data in order to transfer the knowledge
between models which it causes to improve the final accuracy and reduce the training time (Alexandre, 2016). In final strategy, the Principal Component Analysis (PCA) is applied to a RGB-D data for whitening it. So, the first three PCA components are used for training a CNN model in training step and also for extracting the feature vectors in data testing step. The summary of each step and their main components are given in the next sub-sections and the comparison between different results of each strategy are presented accordingly.
3.1 Data Preparing Step
In order to detect and classify different building types in urban area, a library of roofs should be created randomly based on ground truth data which is included different classes of roofs such as flat, gable, hip, pyramid hip, and mansard shapes. Each class contains tiles centered on top view of buildings with different scales and rotations from both RGB images and DSM data. Also two classes as complex roofs and non-roof objects are created to consider the classes of complex roofs with unusual shapes and other detected objects such as trees or cars in segmentation step. All images need to be pre-processed before being submitted to a CNN. There are three common forms of pre-processing of a matrix data such as resizing, mean subtraction and normalization (Girshick, et al., 2015). The final library is then used as the training dataset to train a CNN model.
3.2 Data Training Step
A deep representation of CNN have been trained on a large dataset (ca. several million images) using different toolboxes such as Caffe (Jia, 2013), Theano library (Bastien, et al., 2012), and MatConvNet toolbox (beta17) (Vedaldi and Lenc, 2015) over several weeks using multiple GPUs. This network is named as the pre-trained model. The available pre-trained models can be found online in a Model Zoo of Caffe library (Jia, 2013). On the other hand, to use a deep network for a specific application with a small training dataset and different classes of objects, the network training from scratch are not applicable appropriately and cannot reach to a desired accuracy. Therefore, a pre-trained model which is learnt from a large dataset, can be used as a powerful image descriptor applicable to other datasets (Chatfield, et al., 2014). In this method, the last fully-connected layer of pre-trained model is removed and a layer with random weights is replaced based on classes of small dataset. Then, the weights of pre-trained network are fine-tuned by continuing the back propagation based on gradient descent algorithm. In this paper, an existing pre-trained model is employed to learn the CNN for RGB images, DSM data and PCA images, separately. On the other hand, the fine-tuned RGB model is used to learn CNN for DSM data. As a final result of this step, four fine-tuned models are created as; the fine-tuned RGB model, the fine-tuned DSM model (type I), the fine-tuned DSM model (type II) and the fine-tuned PCA model based on above mentioned strategies which are employed to predict the classes of objects in next step.
3.3 Data Testing Step
After training a deep network using the roof library, a test data is used to evaluate the performance of the trained model. For this, three sub-steps should be performed as follows:
I. Building Segmentation II. CNN Features Extraction III. Feature Labeling
The details of each step are described in the next sub-sections. The International Archives of the Photogrammetry, Remote Sensing and Spatial Information Sciences, Volume XLI-B3, 2016
3.3.1 Building Segmentation: Unlike image classification, object detection requires localizing objects within an image (Girshick, et al., 2015). Using the DSM over the urban area, the bounding boxes of roofs can be extracted based on height thresholding and generation of binary masks for different height values. Next, the test data including the RGB images, DSM data and PCA components of the combination RGB and DSM data are cropped using the extracted bounding boxes and a set of candidate tiles is prepared for the CNN detector. To improve the candidate tiles and remove non-roof objects from each tiles, an image reconstruction technique is employed which is inspired from Arefi, et al. (2013). Also, the pre-processing step which contains resizing, mean subtraction and normalization is applied on each tile in order to convert a candidate tile into a compatible form with the CNN.
3.3.2 CNN Features Extraction: The RGB image tiles are used as an input layer for the fine-tuned RGB model and a fixed length vector of features with dimension of 1×7 (7 is the number of roof classes) extracted for each tile using MatConvNet toolbox (beta17) (Vedaldi and Lenc, 2015). For all of tiles in all data (RGB, DSM, and PCA), the feature vectors are extracted using related the CNN model which is created at the training step.
3.3.3 Features Labeling: The feature vector represents the scores of image tiles for each roof class. If the image tile belongs to a specific class, the score of the class is maximum value. For first and second mentioned strategies, two feature vectors of RGB and DSM data are combined to compute the maximum score of each tile and find the optimal label of related roof class. For third strategy, the label of class is calculated based on the maximum value of feature vectors extracted from PCA components.
4. EXPERIMENTS AND RESULTS
In this study, a knowledge based approach is proposed to detect the buildings and recognition of 3D models of various building’s roof types over an urban area based on a hierarchical learning of the combination of spectral and geometrical features. For this, a novel RGB-D architecture is used to design a convolutional neural network for feature learning and label prediction.
4.1 Case Study
The main dataset is consist of aerial images and LiDAR data of Stuttgart, in Germany. The DSM is created by LiDAR first range measurement in 1 m ground sampling distance, and it is used to generate the ortho-photo in 20 cm ground resolution. Based on the different types of buildings in the area of interest, six classes of flat, gable, hip, pyramid hip, mansard and complex roof are selected to create a library of different roofs. Also an additional class as non-roof class is created for classification of other objects. For each class, about 100 tiles of top view roofs are generated randomly from the training data. Two images covering areas excluded from the training data are selected for testing the model. Based on three proposed strategies, the training and testing data can be consist of the 2D tiles with three channels including three red, green and blue channels, or three repeating channels which are created by DSM, or three channels of the first three PCA components applied on the RGB-D data.
4.2 Model Training
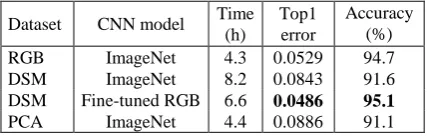
The selected convolutional network is inspired by the success of the CNN of Krizhevsky et al. (2012). This network have been trained on a large dataset called ImageNet ILSVRC benchmark data (Deng, et al., 2009) of 1,000 different categories using MatConvNet toolbox (Vedaldi and Lenc, 2015). Since the CNN architecture requires inputs of a fixed 224×224×3 pixel size, all 700 tiles in the training dataset are resized and also subtracted from mean image. Then, to adapt the CNN for seven classes of roofs, the fine tuning of ImageNet model is performed for 200 iterations and 0.01 learning rate using CPU processor with 5 cores and 8 GB of RAM. The comparison parameters for the trained models such as the learning time, the top 1 error and the accuracy are presented for the last iteration in Table 1. The top 1 error means how often the highest scoring estimation is wrong (Krizhevsky, et al., 2012).
Dataset CNN model Time (h)
Top1 error
Accuracy (%)
RGB ImageNet 4.3 0.0529 94.7
DSM ImageNet 8.2 0.0843 91.6
DSM Fine-tuned RGB 6.6 0.0486 95.1
PCA ImageNet 4.4 0.0886 91.1
Table 1. The comparison parameters of fine-tuned models Figure 2. Three strategies for 3D recognition of building roof models
Figure 3. The rate of convergence of training on different models (I: DSM dataset trained by the ImageNet, II: DSM dataset trained by the fine-tuned RGB model)
Also Figure 3 shows how the accuracy of training improves with more iterations. According to Table 1, the performance of training on the DSM dataset based on fine-tuned RGB model is better than others with the lowest top 1 error and higher accuracy (0.0486 and 95.1 %, respectively). Moreover, when the fine-tuned RGB model is employed as the initial model for training on the DSM dataset, the top 1 error decrease about two times. Also, third strategy based on PCA does not show any significant improvement on learning accuracy. To have an accurate assessment on the training performance, the maximum scores of validation tiles in each class of roofs can be compared with other classes as Figure 4 for different models.
a b
c d
Figure 4. Comparison of maximum scores for validation data in each class based on different trained models: a: fine-tuned RGB model, b: PCA model, c: fine-tuned DSM model, d: fine-tuned DSM model initialized by RGB model, (1: Complex, 2: Flat, 3: Gable, 4: Hip, 5: Pyramid Hip, 6: Mansard, 7: Non roof)
Based on the visual assessments on plots in Figure 4, the RGB tiles can be more distinguishable for each class, however the mis-classification errors exist in some classes especially in complex and hip roofs. Moreover, the PCA tiles have some
noises on complex and mansard classes, and the maximum score of these tiles are not in own classes. Also, if the DSM training dataset is fine-tuned based on the fine-tuned RGB model, the performance of the classification improves a little especially in the hip roof class.
4.3 Model Testing
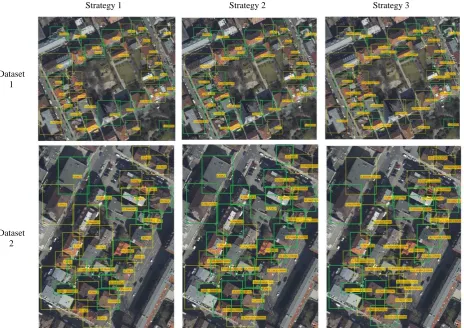
For testing the trained models, two datasets are used out of training area consist of different types of roofs and other objects. The bounding boxes of each candidate regions are generated based on the segmentation results using the thresholding operation. The test datasets are cropped for each bounding box and similarly to the training pipeline, the pre-processing operations are applied on each extracted region. Next, the results are entered into CNN process to extract feature vectors. In Figure 5, the final results of extracted bounding boxes and the final labels for each detected roof are shown. The standard quality measures of Completeness, Correctness, and Quality (Vakalopoulu, et al., 2015) have been calculated for all three stated strategies as given in Equation 1.
F P F N TP
TP Qual
F P TP
TP Cor r F N TP
TP Coml
; . ; .
. (1)
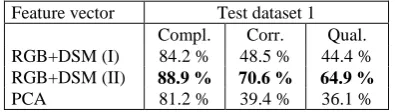
where TP is True Positive, FP is False Positive, and FN is False Negative. Tables 2 and 3 show the standard measures for two test datasets in three strategies, respectively. Also, the final results of building detection and roofs types’ recognition are shown in Figure 5.
Feature vector Test dataset 1 Compl. Corr. Qual. RGB+DSM (I) 84.2 % 48.5 % 44.4 % RGB+DSM (II) 88.9 % 70.6 % 64.9 %
PCA 81.2 % 39.4 % 36.1 %
Table 2. Quantitative evaluation results for test dataset 1
Feature vector Test dataset 2 Compl. Corr. Qual. RGB+DSM (I) 92.3 % 40.0 % 38.7 % RGB+DSM (II) 95.7 % 70.9 % 68.8 %
PCA 91.7 % 37.19 % 36.7 %
Table 3. Quantitative evaluation results for test dataset 2
As shown in the Tables 2 and 3, in the second strategy (the DSM dataset is trained based on the fine-tuned RGB model) the average of correctness and completeness rates are about 71 % and 96 %, respectively. These values are higher than the rates of other strategies. There is no significant difference between first and third strategies in completeness and correctness rates. Moreover, the third strategy based on PCA does not show a promising result according to the correctness and completeness values. On the other hand, the quality of detection for second strategy is higher than others and it is about 69 %. It could be also concluded that, there are some factors which have direct effect on the final quality of detection and recognition as:
Shadow of buildings: occluded areas by shadows of other higher buildings on the specific roof lead to wrong classification results.
The details of roofs: some small structures on the roofs such as chimneys and windows can effect on the final results of classification.
Very complex roofs: one of the disadvantages of model driven approaches is that some complex models might not be included in the library. Therefore, the whole complex roofs might not be classified or classified correctly.
Noise of data: noise of data especially in DSM is an important element which has significant effect on the accuracy of detection.
It should be also concluded that the DSM provides complementary information to enrich the building knowledge which is used for more accurate detection and recognition of buildings, although the pre-processing of data and the segmentation results are also important to obtain a desired result.
5. CONCLUSION
One of the most important issues in 3D city model generation is the automated detection of buildings and recognition of roof types from remotely sensed data. In this paper, three strategies based on the combination of spectral (RGB) and geometrical (DSM) information are produced to be employed in a convolutional neural network based recognition approach. Our implementation is based on the MatConvNet toolbox and a pre-trained ImageNet model. At the first strategy, the pre-pre-trained model is used to fine-tune and extract features from LiDAR DSM and RGB images separately. At the second strategy, the knowledge is transferred from the fine-tuned RGB model for learning the network related to the DSM training dataset. At the
final step of both strategies, the feature vectors are combined to find the optimal label of roofs for the extracted buildings. In the third strategy, the combination of LiDAR DSM and RGB images is performed based on PCA algorithm. The qualitative and quantitative assessments indicate that quite promising results with significant high completeness and correctness rates for the second strategy are obtained. Since the DSM data provides a rich source of geometrical information, the height values of roofs can be embedded into a CNN using the raw RGB images for learning the CNN and therefore, extracting more accurate and distinguishable features to improve accuracy of roofs’ pattern recognition. Moreover, since the segmentation results have a direct effect on the final detection performance significantly, an important focus in the future work will be on improving the automatic segmentation results.
REFERENCES
Menegatti, E., Michael, N., Berns, K., Yamaguchi, H., 2016. Intelligent Autonomous Systems 13, Chapter: 3D object recognition using convolutional neural networks with transfer learning between input channels. Alexandre, L. A., Vol. 301 of Advances in Intelligent Systems and Computing Series, Springer, pp. 889-898.
Arefi, H., Reinartz, P., 2013. Building reconstruction using DSM and orthorectified images. Remote Sensing, 5(4), pp. 1681-1703.
Strategy 1 Strategy 2 Strategy 3
Dataset 1
Dataset 2
Figure 5. The Final results of buildings’ roofs detection and recognition based on three strategies for two datasets The International Archives of the Photogrammetry, Remote Sensing and Spatial Information Sciences, Volume XLI-B3, 2016
Awrangjeb, M., Zhang, C., Fraser, C. S., 2013. Automatic extraction of building roofs using LIDAR data and multispectral imagery. ISPRS Journal of Photogrammetry and Remote Sensing, Vol. 83, pp. 1–18.
Bastien, F., Lamblin, P., Pascanu, R., Bergstra, J., Goodfellow, J. I., Bergeron, A., Bouchard, N., Bengio, Y., 2012. Theano: new features and speed improvements. Deep Learning and Unsupervised Feature Learning. NIPS 2012 Workshop.
Bengio, Y., 2009. Learning Deep Architectures for AI. Foundations and Trends in Machine Learning, 2(1), pp. 1–127.
Chatfield, K., Simonyan, K., Vedaldi, A., Zisserman, A., 2014. Return of the devil in the details: Delving deep into convolutional nets. In Proc. BMVC.
Dahl, G. E., Yu, D., Deng, L., Acero, A., 2012. Context-dependent pre-trained deep neural networks for large-vocabulary speech recognition. IEEE Transactions on Audio, Speech, and Language Processing, 20(1), pp. 30–42.
Deng, J., Dong, W., Socher, R., Li, L.-J., Li, K., Fei-Fei, L., 2009. Imagenet: A large-scale hierarchical image database. In Proc. CVPR.
Filipe, S., Alexandre, L.A., 2014. From the human visual system to the computational models of visual attention: A survey. Artificial Intelligence Review. IEEE Transactions on Geoscience and Remote Sensing, 52(11), pp. 1-47.
Girshick, R., Donahue, J., Darrell, T., Malik, J., 2015. Region-based convolutional networks for accurate object detection and semantic segmentation. IEEE Transactions on Pattern Analysis and Machine Intelligence, 38(1), pp. 142-158.
Guo, L., Chehata, N., Mallet, C., Boukir, S., 2011. Relevance of airborne LiDAR and multispectral image data for urban scene classification using Random Forests. ISPRS Journal of Photogrammetry and Remote Sensing, 66(1), pp. 56–66.
Haala, N., Brenner, C., 1999. Extraction of buildings and trees in urban environments. ISPRS Journal of Photogrammetry & Remote Sensing, Vol. 54, pp. 130–137.
Hermosilla, T., Ruiz, L., A., Recio, J. A., Estornell, J., 2011. Evaluation of Automatic Building Detection Approaches Combining High Resolution Images and LiDAR Data. Remote Sensing, 3(6), pp. 1188-1210.
Jia, Y., 2013. Caffe: An open source convolutional architecture for fast feature embedding. http://caffe.berkeleyvision.org/.
Karantzalos, K., Koutsourakis, P., Kalisperakis, I., Grammatikopoulos, L., 2015. Model based building detection from low-cost optical sensors on-board unmanned aerial vehicles. In: The International Archives of the Photogrammetry, Remote Sensing and Spatial Information Sciences, Toronto, Canada, Vol. XL-1/W4, pp.293-297.
Khurana, M., Wadhwa, V., 2015. Automatic building detection using modified grab cut algorithm from high resolution satellite image. International Journal of Advanced Research in Computer and Communication Engineering, 4(8).
Kim, C., Habib, A., 2009. Object-Based Integration of Photogrammetric and LiDAR Data for Automated Generation
of Complex Polyhedral Building Models. Sensors, 9(7), pp. 5679-5701.
Krizhevsky, A., Sutskever, I., Hinton, G. E., 2012. ImageNet classification with deep convolutional neural networks. NIPS, pp. 1106–1114.
Lecun, Y., Bottou, L., Bengio, Y., Haffner, P., 1998. Gradient-based learning applied to document recognition. In Proc. IEEE, 86(11), 2278 - 2324.
Liu, T., Fang, S., Zhao, Y., Wang, P., Zhang, J., 2015. Implementation of training convolutional neural networks, Computer Vision and Pattern Recognition.
Long, J., Shelhamer, E., Darrell, T., 2015. Fully convolutional networks for semantic segmentation. In Proc. CVPR.
Maitra, D. S., Bhattacharya, U., Parui, S.K., 2015. CNN based common approach to handwritten character recognition of multiple scripts. In: 13th International Conference on Document Analysis and Recognition, Tunis, pp.1021-1025.
Maltezos, E., Ioannidis, C., 2015. Automatic detection of building points from LiDAR and dense image matching point clouds. In: ISPRS Annals of the Photogrammetry, Remote Sensing and Spatial Information Sciences, France, Vol. II-3/W5.
Matikainen, L., Hyyppä, J., Kaartinen, H., 2004. Automatic detection of changes from laser scanner and aerial image data for updating building maps. In: International Archives of Photogrammetry, Remote Sensing and Spatial Information Sciences, Vol. 35, Part B2, pp. 434–439.
Mongus, D., Lukac, N., Zalik, B., 2014. Ground and building extraction from LiDAR data based on differential morphological profiles and locally fitted surfaces. ISPRS Journal of Photogrammetry and Remote Sensing, Vol. 93, pp. 145–156.
Ngo, T. T., Collet, C., Mazet, V., 2015. Automatic rectangular building detection from VHR aerial imagery using shadow and image segmentation. In: IEEE International Conference on Image Processing.
Partovi, T., Krauß, T., Arefi, H., Omidalizarandi, M., Reinartz, P., 2014. Model-driven 3D building reconstruction based on integration of DSM and spectral information of satellite images. In: 2014 IEEE Geoscience and Remote Sensing Symposium (IGARSS), Quebec, Canada, pp. 3168-3171.
Phung, S. L., Bouzerdoum, A., 2009. MATLAB Library for Convolutional Neural Networks, Technical Report, Visual and Audio Signal Processing Lab, University of Wollongong.
Salah, M., Trinder J., Shaker, A., 2009. Evaluation of the self‐organizing map classifier for building detection from LiDAR data and multispectral aerial images. Journal of Spatial Science, 54(2), pp. 15-34.
Schwalbe, E., Maas, H-G., Seidel, F., 2005. 3D building generation from airborne laser scanner data using 2D GIS data and orthogonal point cloud projections. In: ISPRS Workshop of Laser scanning, the Netherlands.
Singh, G., Jouppi, M., Zhang, Z., Zakhor, A., 2015. Shadow Based Building Extraction from Single Satellite Image. The International Archives of the Photogrammetry, Remote Sensing and Spatial Information Sciences, Volume XLI-B3, 2016
Proceedings of SPIE, the International Society for Optical Engineering, Vol. 9401.
Socher, R., Bengio, Y., Manning C., 2013. Deep learning for NLP. Tutorial at Association of Computational Logistics (ACL), http://www.socher.org/index.php/DeepLearningTutorial
Sohn, G., Dowman, I., 2007. Data fusion of high-resolution satellite imagery and LiDAR data for automatic building extraction. ISPRS Journal of Photogrammetry & Remote Sensing, Vol. 62, pp. 43–63.
Uijlings, J., van de Sande, K., Gevers, T., Smeulders, A., 2013. Selective search for object recognition. International Journal of Computer Vision, 104(2), pp. 154-171.
Vakalopoulou, M., Karantzalos, K., Komodakis, N., Paragios, N., 2015. Building detection in very high resolution multispectral data with deep learning features. In: IEEE International Geoscience and Remote Sensing Symposium (IGARSS), Milan, Italy, pp. 1873 – 1876.
Vedaldi, A., Lenc, K., 2015. MatConvNet: Convolutional Neural Networks for MATLAB. Proceeding of the ACM International Conference on Multimedia, http://www.vlfeat.org/matconvnet/
Vu, T. T., Yamazaki, F., Matsuok, M., 2009. Multi-scale solution for building extraction from LiDAR and image data. International Journal of Applied Earth Observation and Geoinformation, 11(4), pp. 281–289.
Wichmann, A., Jung, J., Sohn, G., Kada, M., Ehlers, M., 2015. Integration of building knowledge into binary space partitioning for the reconstruction of regularized building models. In: ISPRS Annals of the Photogrammetry, Remote Sensing and Spatial Information Sciences, France, Vol. II-3/W5.
Yang, X., Li, J., 2012. Advances in Mapping from Remote Sensor Imagery, Techniques and Applications. Chapter: Airborne LiDAR remote sensing and its applications, Zhang, K., Cui, Z., Houle, P. A., CRC Press, pp. 33–68.
Yuan, J., 2016. Automatic Building Extraction in Aerial Scenes Using Convolutional Networks. arXiv:1602.06564.
Yu, B., Liu, H., Wu, J., Hu, Y., Zhang, L., 2010. Automated derivation of urban building density information using airborne LiDAR data and object-based method. Landscape and Urban Planning, 98(3-4), pp. 210–219.
Zeiler, M., D., Fergus, R., 2014. Computer Vision, ECCV 2014, Chapter: Visualizing and understanding convolutional networks. Vol. 8689 of the series Lecture Notes in Computer Science, pp. 818-833.
Zhang, Y., Sohn, K., Villegas, R., Pan, G., Lee, H., 2015. Improving object detection with deep convolutional networks via Bayesian optimization and structured prediction. In: IEEE Conference on Computer Vision and Pattern Recognition (CVPR), Boston, MA.
Zhou, G. Q., Zhou, X., 2014. Seamless fusion of LiDAR and aerial imagery for building extraction. IEEE Transactions on Geoscience and Remote Sensing, 52(11), pp. 7393–7407.
Zou, Q., Ni, L., Zhang, T., Wang, Q., 2015. Deep learning based feature selection for remote sensing scene classification. IEEE Geoscience and Remote Sensing Letters, 12(11).