DETECTION OF ORTHOIMAGE MOSAICKING SEAMLINES BY MEANS OF
WAVELET TRANSFORM
K. Pyka
AGH University of Science and Technology, Faculty of Mining Surveying and Environmental Engineering, Department of Geoinformation, Photogrammetry and Remote Sensing of Environment,
Krakow, Poland - [email protected]
Commission IV, WG IV/1
KEY WORDS: Orthoimage, Seamline, Orthomosaic, Wavelet transform, Undecimated DWT, Cost analysis
ABSTRACT:
The detection of orthoimage mosaicking seamlines by means of wavelet transform was examined. Radiometric alignment was omitted, giving priority to the issue of seamlines which bypass locations where there is a parallax between orthoimages. The importance of this issue is particularly relevant for images with very high resolution. In order to create a barrier image between orthoimages, the redundant wavelet transform variant known as MODWT-MRA was used. While more computationally complex than the frequently used DWT, it enables very good multiresolution edge detection. An IT prototype was developed on the basis of the described concept, and several cases of seamline detection were tested on the basis of data with a resolution of 10 cm to 1 m. The correct seamline location was obtained for each test case. This result opens the door to future expansion of the radiometric alignment method, which is also based on wavelets.
1. INTRODUCTION
Mosaicked orthoimages are probably the most popular type of map. This is due to their low development costs compared with vector maps, as well as to very well-developed methods of compression and transmission of large raster files. From the point of view of time and cost, a critical step in the development of orthoimages is the detection of mosaicking lines. Modern photogrammetric software offers automatic detection, but the effects usually must be corrected manually (Walcher et al., 2012).
The goal of mosaicking line detection is to exclude all places where there is a difference between orthoimage edges, textures, and radiometry. When combining aerial orthoimages, a greater role is played by the edges and texture and a lesser one by radiometry, which can be balanced. In the case of satellite images, it is more often necessary to use the luminance of pixels instead of the DN (Digital Number), which shows only relative changes in brightness.
Radiometric differences between combined orthoimages are tolerated by the human visual system to a certain degree. On the other hand, incidences of mosaicking lines passing through locations characterised by varying geometry of the same objects on combined orthoimages are considered errors. This applies to objects projecting above the terrain (e.g. buildings, trees), which, in classical orthorectification, are mapped with some radial displacement of the upper part of the object in relation to its lower part. A parallax is formed between orthoimages for projecting objects, its direction consistent with the direction of the vector connecting the centres of the image projections (from which the orthoimages were made). If the mosaicking line intersects the image of a building or a tree, artefacts appear on the mosaic. Avoiding such defects is the main goal of the research presented in this article.
The issue of detection of mosaicking lines has been studied for many years (Shiren et al., 1989; Afek, Brand, 1998; Kerschner, 2001, Bielski, 2007; Jun et al., 2009; Pan et al., 2009; Yu et al., 2011). However, the number of papers is insufficient given the importance of the issue for photogrammetric production. When observing the photogrammetric software market, one might easily conclude that there are numerous mosaicking line detection methods representing the expertise of their developers (e.g. OrthoMaster/OrthoVista, SocetSet, SimActive).
The method proposed in this paper uses wavelet transform to build a barrier image indicating locations which should not be crossed by mosaicking lines. Thanks to the features of the wavelet transform, both the locations of the parallax between orthoimages and the locations characterised by differing textures are detected.
Wavelet transform is used operationally in photogrammetry and remote sensing to compress images. Three independent solutions have been developed: JPEG2000, ECW, and MrSID. Wavelets are used widely in research, for example, to remove noise in radar images, to perform fusion (merging) of images with different spatial resolutions, to describe structural features for image classification, and to perform image matching (Nuñez et al., 1999; Ranchin, Wald, 2000; Shi et al., 2005; Heygster et al., 2010; Tello et al., 2011). So far, it has not been used for the detection of mosaicking lines.
2. RELATED WORK
A review of the published methods for the detection of mosaicking lines shows that they differ in their criteria for identification of the best routing paths, and are similar, with a few exceptions, in that they use a cost analysis known from GIS in order to choose the optimal path.
In one of the oldest algorithms, the homologous points of the combined images are first selected by matching, then their optimal combination is sought. The combination closest to the line constituting the bisector or diagonal of the orthoimage coverage is considered optimal (Afek, Brand, 1998).
The original method of automatically routing the seamline was proposed by Kerschner (2001). The basis of the method is the assumption that orthoimages at the combination point should be similar in terms of colour and texture. Two components of the IHS colour model, intensity I and hue H, are selected as representative of the colour; texture is characterised by gradient and its direction. These parameters are calculated for each orthoimage within the coverage area, then their differences are calculated. In order to detect the locations where the differences are the smallest, ‘twin snakes’ were used (Kerschner, 1998). This method was reviewed by other researchers, who suggested changing the strategy in the IT implementation to improve its efficiency (Wang, Zhang, 2010). However, the literature contains no documentation of any broader operational research on the method, particularly research based on examples of large projects.
Another aspect of the automation of mosaicking lines concerning the creation of their topological configuration was presented by Jun et al. (2009). The authors were able to discard sequential determination of successive seamlines in favour of a simultaneous process. As a result, the proposed solution, based on a Voronoi diagram, optimises the lines within the area of the block of orthoimages.
A very interesting multifaceted mosaicking line identification method was presented by Yu et al. (2011). Overlapping locations in orthoimages are analysed in terms of three characteristics: colour, edge, and texture. Similarity of colour is tested on the basis of the I and H components of the IHS colour model. The edges of images, obtained with the well-known Canny detector, were compared. Entropy tested in a 3×3 pixel window was adopted as a measure of texture. This method also accounts for the sensitivity of the human visual system to changes in the contrast and spatial arrangement of image edges. A saliency map is used as a model of image perception (Niebur, 2007). The final factor influencing the selection of the line is location relative to the nadir. In the next step, a cost image is produced by means of a weighted sum of the factors taken into account (differences in colour, edge, and texture; the sensitivity of the human visual system; the distance to the nadir). The final step is to find the path associated with the lowest cost using the well-known Dijkstra algorithm. Among the published papers on the detection of mosaicking lines, the approach outlined above is the most comprehensive.
3. WAVELET TRANSFORM
Wavelet transform is a representation of a time-frequency signal and is suitable for stationary and non-stationary signal analysis (Daubechies, 1992; Mallat, 1998). Continuous wavelet transform (CWT) involves combining a signal with a function characterised by a limited life and an average value of zero.
Such functions are called wavelets, suggesting that they are ‘small waves’, as opposed to ‘big waves’, i.e. sine and cosine curves in the Fourier transform. CWT is redundant, as it creates very large sets of data, and therefore, for practical issues, the discrete wavelet transform (DWT) method is primarily used (Percival, Walden, 2000; Gençay et al., 2002).
3.1 Implementation of DWT according to the Mallat algorithm
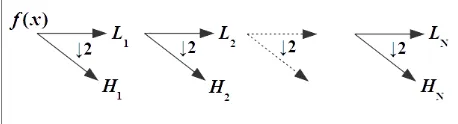
A significant impetus for the development of DWT was provided by the algorithm proposed by Stephane Mallat, which is implemented by means of filters (Mallat, 1989). Due to its effectiveness it is widely used in IT applications. The algorithm assumes that any f(x) signal, also known as 2J of the values specified with the Δx interval, is reversibly represented by a set of wavelet coefficients generated by the convolution of the signal with the low- and high-pass filters. A representation may be extended for a finite number of N levels, with dyadic
LN – approximating component that is a set of wavelet coefficients with a size of 2J - N
H1,H2,…,HN – N of detail components that are sets of wavelet coefficients with size of 2J - 1, … , 2J - N respectively, the following N detail components are called components of level n= 1 , 2,…, N
In relation to the set of the f(x) signal value, the DWT components are characterised by dyadically reduced spatial resolution.
Figure 1. DWT diagram according to the Mallat algorithm (the horizontal vector corresponds to low, the diagonal to high-pass
filtering)
These components are the result of the convolution sequence, first with a signal and subsequently with the result of the first convolution with low- and high-pass filters, as expressed by formulas 2a and 2b:
L1=g∗f(x)↓2 L2=g∗L1↓2 ... LN=g∗LN−1↓2 (2a)
H1=h∗f(x)↓2 H2=h∗L1↓2 ... HN=h∗LN−1↓2 (2b)
where g , h – low and high-pass filters representing a scaling and a basic wavelet
3.2 Maximal Overlap DWT and Multiresolution Analysis
convolution with the wavelets takes place at step 1 and not at step 2 as in DWT (Percival, Guttorp, 1994). This transform is called MODWT (MO: maximal overlap); other terms are also used, such as non-decimated or undecimated DWT, shift invariant, or translation-invariant DWT (Percival, Walden, 2000; Gençay et al., 2002). Implementation of MODWT is similar to that of DWT, except that no downsampling is performed (omitting ↓2 in Figure 1). The advantage of MODWT is that it enables the use of a signal of any length (there is no limit to the size of 2J); the disadvantage is the higher cost of calculations and a constant size of components always equal to input signal f(x) .
It is possible to modify MODWT by scaling the filters, which yields components whose sum is equal to the signal (Percival, Walden, 2000; Gençay et al., 2002). This variant, known as multiresolution analysis (Gençay et al., 2002), can be formulated as formula (3):
f(x) =LN+
∑
n=1N
Hn (3)
where N – level of decomposition, N ≤ log2( dim f(x) ) dim – length of signal f(x)
3.3 Detection of Image Edge
The Mallat algorithm can also be decomposed for a two-dimensional signal, that is, an image. transform of the image consists of the convolution of the same filters as those used for the one-dimensional signal, but filtration of rows and columns is performed alternately. A diagram of this procedure is shown in Figure 2. Three detail components that represent the projection of the signal in three directions, 0°, 45°, and 90°, are generated at each level of wavelet transform of images. Therefore, the details are referred to as horizontal (HL), vertical (LH), and diagonal (HH).
Figure 2. Diagram of DWT according to the Mallat algorithm for a digital image (diagrams of MODWT and MODWT-MRA
are similar except for downsampling ↓2)
Edge detection is based on the assumption that the edge is visible in the detail components at locations where there is a sign change of the neighbouring wavelet coefficients at high values of these coefficients (Mallat, Zhong, 1992; Mallat, Hwang, 1992). If we calculate the standard according to formula (4) for each pair of wavelet coefficients (horizontal and vertical), we obtain a measure characterising the gradient of the function f (the diagonal component is omitted):
∇ f(x , y)n=
√
LHn2+
HLn
2
(4)
where ∇ f(x , y)n – module of wavelet coefficients at
level n, (abbreviated expression ∇ fn)
LHn, HLn – coefficients of the horizontal and
vertical detail for the resolution level n
The module of wavelet coefficients is associated with the resolution level; therefore, it can be said that a multiresolution edge measure is obtained. The measure for the first level expresses small edges; those for the subsequent levels reflect stronger edges, both in terms of gradient and edge width.
Figure 3 presents examples related to an artificial image, enabling observation of a systematic overlapping of edges for the MODWT-MRA method (a Haar wavelet was used in all examples).
Figure 3. Example of edge detection for an artificial test image: a) input image, b) edges for level 1, c) edges for level 2
The sum of modules calculated on the basis of formula (4) from level 1 to level L yields an aggregated (multiresolution) edge image. Suppose that we add up only a part of the L levels according to formula (5), while maintaining the sequence of levels.
∇ fn1
n2
=
∑
n1
n2
∇fn (5)
where ∇ fn1
n2
– sum of modules of wavelet coefficients for a sequence of resolution levels n1, n2
Figure 4. Example of aggregated edges for the artificial test image (see Figure 3a):
a) n1 = 1, n2 = 2, b) n1 = 1, n2 = 3, c) n1=2, n2 = 3
4. CONCEPT OF USING WAVELETS TO DETECT SEAMLINES
Suppose we have two orthoimages f (x, y) and g (x, y) and that we consider their common area only. Following a separate determination of edges for the two images, we can calculate their differences, as expressed by formula (6):
Δn1
n2
= |
∑
n1
n2
∇ fn−
∑
n1
n2
∇gn| (6)
where Δn1
n2
– differences between edges for two images for sequence of resolution levels n1, n2
We obtain an image showing the places where the location of objects in one image changed compared to the other, which corresponds to the parallax emerging for all objects projecting above the ground. A complete barrier image, apart from edge differences, must also include all other edges, since the connecting line should not cross any of them. A complete barrier image is described by formula (7):
Λn1
n2=
max
{
Δn1n2
,∇fn1
n2
,∇gn1
n2
}
(7)where Λn1
n2
– a barrier image for a pair of orthoimages
Barriers to the mosaicking line are formed by all factors defined based on (7) and greater than the assumed threshold (with a value close to 0). On the other hand, all values lower than the threshold represent locations that can be crossed by a mosaicking line. The final stage is to find the optimal path in the barrier image using the Dijkstra algorithm.
From a practical point of view, abandonment of level 1 can be recommended, as it expresses short edges (often point edges) which result from imaging noise (Pyka, 2013).
Figure 5. Example of a barrier image: black/white → low/high barriers locations (the input orthoimages are shown in Figure 6)
5. SCOPE OF EXPERIMENTAL WORK
On the basis of the concept outlined in the previous section, an IT prototype, consisting of several scripts in the R environment, was developed (Pyka, 2013). The main study materials were high-resolution aerial orthoimages (10 cm ground pixel) developed from DMC I images by the MGGP Aero Tarnów company. The study also used medium-resolution aerial and satellite orthoimages. Selected results are shown in Figures 6-10.
Figure 6. An example of routing the seamlines in a suburban area – against the background of the left and right orthoimages
Figure 7. Part of Figure 6, enlarged
Figure 8. An example of routing the seamlines in an area with high buildings (the routes of two seamlines are shown, at the location where four orthoimages overlap, two in the top and two
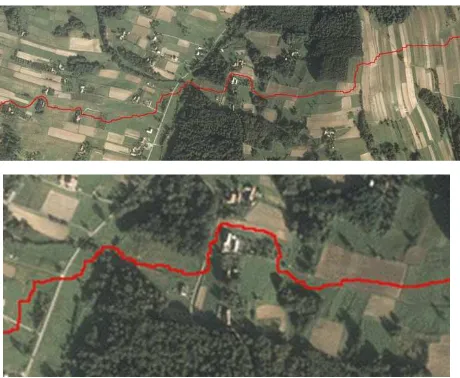
Figure 9. An example of routing the seamlines through a foothill area (enlargement in the bottom row)
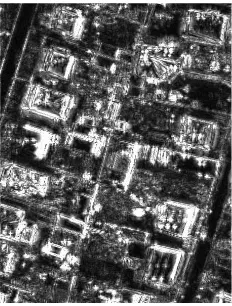
Figure 10. An example of routing the seamlines in a satellite orthoimage
Figures 6-10 show that the correct seamline location has been obtained, including a city area with high buildings, where the parallax and occlusions are very great. A special case is shown in Figure 11. From a theoretical point of view, the seamline should not traverse a forest area; however, sometimes it is necessary to do so.
Figure 11. An example of an orthomosaic of a forest area (where is the seamline?)
6. RESULTS AND CONCLUSIONS
The proposed solution to the problem of detecting mosaicking lines is based on creating a barrier image using wavelet transform. In order to create this image, MODWT-MRA was chosen, which, though admittedly redundant and computationally more complex than the simplest version of DWT, meets the requirements for repeatability of edge location
and affords an opportunity to analyse multiresolution components as overlapping layers. The barrier image consists of locations with a parallax between orthoimages and strong edges (the only parameter to control the algorithm is a threshold to separate the barrier from the background).
For high-resolution images, the concept of building a barrier image with three levels of resolution to generate a sequence of 2, 3, 4 proved useful. Disregarding level 1 was useful for orthoimages with GSD = 0.10 m. On the other hand, for orthoimages with resolutions of 0.75 m and 1 m, a sequence of 1, 2, 3 turned out to be more advantageous. These results indicate that images with very small pixels contain excessive detail, hence causing a kind of informational noise. If these details were taken into account when routing mosaicking lines, barrier images would represent too many often irrelevant obstacles (the human eye is able to see only those edges in which the threshold contrast is exceeded). Furthermore, a situation could emerge in which the designation of seamlines would not be possible. On the other hand, details disappear in images with a resolution several times lower. This is because details with at least one dimension at the decimetre level have only a slight influence on determination of the total luminance of the surface from which the sensor collects the electromagnetic radiation.
This paper does not deal with radiometric equalisation of orthoimages in the process of mosaicking. It was concluded that the routing of mosaicking lines was a more important problem, to be solved first. It is typical that the method does not include a smoothed component, which is obtained during wavelet transform and can be used for radiometric equalisation. DWT with dyadic reduction in the size of the components would be more advantageous for this task. Four-level components are 24×2 times smaller than the output image; for example, they are less than 1 MB instead of 250 MB. This is important because balancing of radiometry must include R, G, and B components of colour images.
A certain analogy can be noted between the proposed method and one of the solutions described in Chapter 2, recognised as the most comprehensive (Yu et al., 2011). The barrier image is formed in areas where orthoimages differ in terms of edge and texture. Disregarding diagonal edges in the process of its construction corresponds to human visual perception, in which they are less visible than horizontal and vertical edges. Therefore, both methods include similar factors, but the one proposed in this publication does not include radiometric differences.
ACKNOWLEDGEMENTS
The investigation has been made within the scope of research project AGH 11.11.150.949.
REFERENCES
Afek, Y., Brand A., 1998. Mosaicking of orthorectified aerial images. Photogrammetric Engineering & Remote Sensing, vol. 64, pp. 115–125.
Daubechies, I., 1992. Ten Lectures on Wavelets. SIAM Publ. Philadelphia PA. ISBN 0-89871-274-2.
Gençay, R., Selçuk, F., Whitcher, B., 2002. An Introduction to Wavelets and Other Filtering Methods in Finance and Economics. ACADEMIC PRESS, ISBN 0-12-279670-5.
Heygster, G., Dannenberg, J., Notholt, J., 2010. Topographic Mapping of the German Tidal Flats Analyzing SAR Images With the Waterline Method. Geoscience and Remote Sensing, IEEE Transactions on, vol. 48(3), pp. 1019-1030.
Jun, P., Mi, W., Deren, L., Jonathan, L., 2009. Automatic Generation of Seamline Network Using Area Voronoi Diagrams With Overlap. IEEE Transactions on Geoscience and Remote Sensing, vol. 47(6), pp. 1737-1744.
Kerschner, M., 1998. Homologous twin snakes integrated in a bundle block adjustment. International Archives of the Photogrammetry, Remote Sensing and Spatial Information Sciences, vol. XXXII (3/1), pp. 244-249.
Kerschner, M., 2001. Seamline detection in colour orthoimage mosaicking by use of twin snakes. ISPRS Journal of Photogrammetry & Remote Sensing, vol. 56, pp. 53-64.
Mallat, S., 1989. A Theory for Multiresolution Signal Decomposition: The Wavelet Representation. IEEE Transactions on Pattern Analysis and Machine Intelligence, vol. 11, pp. 674-693.
Mallat, S., Hwang, W.L., 1992. Singularity detection and processing with wavelets. IEEE Transactions on Information Theory, vol. 32, pp. 617-643.
Mallat, S., Zhong, S., 1992. Characterization of signals from multiscale edges. IEEE Transactions on Pattern Analysis and Machine Intelligence, vol. 14, pp. 710-732.
Mallat, S., 1998. A Wavelet Tour of Signal Processing. Academic Press, ISBN 0-12-466605-1.
Niebur, E., 2007. Saliency map. Scholarpedia, 2(8):2675.
Nuňez, J., Otazu, X., Fors, O., Prades, A., Palà, V., Arbiol, R., 1999. Multiresolution-Based Image Fusion with Additive Wavelet Decomposition. IEEE Transactions on Geoscience And Remote Sensing, vol. 37, No. 3, pp. 1204-1211.
Percival, D. B., Guttorp, P., 1994. Long-memory processes, the Allan variance and wavelets. In E. Foufoula-Georgiou and P. Kumar, editors, Wavelets in Geophysics, vol. 4 of Wavelet Analysis and Its Applications, Academic Press, Inc, San Diego, pp. 325-344.
Percival, D. B., Walden, A.T., 2000. Wavelet Methods for Time Series Analysis. Cambridge University Press, ISBN 052164068 7.
Pyka, K., 2013. Mosaicing Orthophotos Using Wavelet Transform (written in Polish). AGH University of Science and Technology Press. ISBN 978-83-7464-635-2.
Ranchin, T., Wald, L., 2000. Fusion of high spatial and spectral resolution images: the ARSIS concept and its implementation. Photogrammetric Engineering & Remote Sensing, vol. 66, pp. 49-61.
Shi, W., Zhu, C.Q., Tian, Y., Nichol, J., 2005. Wavelet-based image fusion and quality assessment. International Journal of Applied Earth Observation and Geoinformation, vol. 6, pp. 241-251.
Shiren, Y., Li, L., Peng, G., 1989. Two-dimensional seam-point searching in digital image matching. Photogrammetric Engineering & Remote Sensing, vol. 55, pp. 49-53.
Tello, A. M., Lopez-Martinez, C., Mallorqui, J.J., Salembier, P., 2011. Edge Enhancement Algorithm Based on the Wavelet Transform for Automatic Edge Detection in SAR Images. IEEE Transactions on Geoscience and Remote Sensing, vol: 49(1), pp. 222-235.
Walcher, W., Leberl, F., Gruber, M., 2012. The Microsoft Global Ortho Program. ISPRS Annals of the Photogrammetry, Remote Sensing and Spatial Information Sciences, vol. I-4, pp. 53-58.
Wang, L., Ai, H., Zhang, L., 2010. Automated Seamline Detection in Orthophoto Mosaicking Using Improved Snakes. 2010 2nd International Conference on Information Engineering and Computer Science IEEE, Catalog Number: CFP1090H-ART ISBN: 978-1-4244-7941-2.
Wyszecki, G., Stiles, W.S., 2000: Color Science, Concept and Methods, Quantitative Data and Formulae. John Wiley and Sons ONC NY, ISBN 0-471-39918-3.