FIELD ACCURACY TEST OF RPAS PHOTOGRAMMETRY
P. Barry, R. Coakley
Baseline Surveys Ltd
Mount
Desert Lodge, Lee Road, Cork, Co. Cork - Ireland
[email protected]
KEY WORDS: UAV, UAS, Accuracy of UAV Photogrammetry, Orthomosaic, DEM, Topographic Surveying. RPAS, RPA, Drone Mapping
ABSTRACT:
Baseline Surveys Ltd is a company which specialises in the supply of accurate geospatial data, such as cadastral, topographic and engineering survey data to commercial and government bodies. Baseline Surveys Ltd invested in aerial drone photogrammetric technology and had a requirement to establish the spatial accuracy of the geographic data derived from our unmanned aerial vehicle (UAV) photogrammetry before marketing our new aerial mapping service. Having supplied the construction industry with survey data for over 20 years, we felt that is was crucial for our clients to clearly understand the accuracy of our photogrammetry so they can safely make informed spatial decisions, within the known accuracy limitations of our data. This information would also inform us on how and where UAV photogrammetry can be utilised.
What we wanted to find out was the actual accuracy that can be reliably achieved using a UAV to collect data under field conditions throughout a 2Ha site. We flew a UAV over the test area in a “lawnmower track” pattern with an 80% front and 80% side overlap; we placed 45 ground markers as check points and surveyed them in using network Real Time Kinematic Global Positioning System (RTK GPS). We specifically designed the ground markers to meet our accuracy needs. We established 10 separate ground markers as control points and inputted these into our photo modelling software, Agisoft PhotoScan. The remaining GPS coordinated check point data were added later in ArcMap to the completed orthomosaic and digital elevation model so we could accurately compare the UAV photogrammetry XYZ data with the RTK GPS XYZ data at highly reliable common points. The accuracy we achieved throughout the 45 check points was 95% reliably within 41mm horizontally and 68mm vertically and with an 11.7mm ground sample distance taken from a flight altitude above ground level of 90m.The area covered by one image was 70.2m x 46.4m., which equals 0.325Ha. This finding has shown that XYZ data derived from UAV photogrammetry has a similar practical accuracy to RTK GPS, which is commonly used for cadastral, topographic and engineering survey work. This means that UAV photogrammetry can, for the most part, replace GPS surveying as the main method of data capture for engineering projects, boundary mapping and topographical surveying. Aerial Photogrammetry, in conjunction with RTK GPS, can now be used for projects with a 1:200 map scale accuracy requirement.
1. INTRODUCTION
Much of current land, engineering and cadastral survey work using GPS and total station is often labour intensive, sometimes involves surveyors working in hazardous environments and the completeness of the data captured often depends on the time allotted to the survey project. No representation of geography is perfect and certainly the point, text, line and polygon style of 21st century digital mapping is no exception. GPS and Total station geographic data collection methods are accurate enough to design civil engineering and architectural projects with sufficient practical accuracy (within +/-5cm) to design roads, bridges, pipelines, buildings etc. Although GPS data is highly spatially accurate in both absolute and relative terms it completely falls down in richness of data. Each line, point and polygon must be described by textual means in order to communicate its geographic meaning. So although it has (traditionally) been accepted as complete, there is an undeniable risk of a surveyor omitting data without even realising. As Surveyors, we wanted to experiment with Remotely Piloted Aircraft System (RPAS) photogrammetry to see if it would be accurate enough to replace current GPS and total station survey
data collection methods for engineering, cadastral and topographic surveys projects.
This would increase our efficiency in terms of vastly reducing time spend during data capture while increasing data quality and richness.
As we were attempting to push beyond the current spatial accuracy limitation of RPAS derived geographic data, we decided to use the C-Astral Bramor RPAS for its superior stability as an aerial data capture platform. Its stability is achieved through a combination of its aerodynamics and high end Lockheed Martin designed Autopilot system. The high 24 Megapixel (MP) precision of its Sony Nex-7 camera was another deciding factor along with its very clever safety feature, which is a remotely deployable parachute landing option. It also has 3 hour endurance and a practical wind tolerance of 20 knots when piloted by an experienced RPAS crew.
We decided to use Network RTK GPS to establish Irenet95 (ITM) coordinates on the centre positions of the ground control markers, we then carefully designed our geometrically patterned ground markers which allowed us to obtain sub pixel accuracy of the centre point location when identifying ground marker positions at the post data collection and pre-processing stage.
Agisoft PhotoScan was the software we decided to use for its stated accuracy 1-3 pixels and the high quality of the ortho photography and digital elevation model outputs.
ArcMap was used for presenting the final fusion of data captured by UAV and GPS.
2. PRE-FLIGHT PLANNING
The 10 ground control points were theoretically positioned so that they were equidistantly distributed throughout the site to ensure an even distribution of errors.
Figure 1: Ground control station and check point targets
A flight plan was generated so that that an 80% overlap and a 80 % sidelap and at an altitude of 90m to provide an expected GSD of 10mm. Flight direction was plotted at 90 degrees to the actual wind direction to maintain a constant ground speed of less than 16m/s during the photographic process. This step helped to reduce ground smear, a phenomenon which blurs the pixels due to the movement of the RPAS.
3. DATA ACQUISITION SYSTEM
The data acquisition system we used on this project is a hybrid of Trimble GoeXR Network RTK GPS and a C-Astral Bramor UAV. We used the RTK GPS to establish Irenet95 (ITM) coordinates on our specifically designed ground markers to provide photo control. The GPS unit has a spatial accuracy in the region of 10-25mm both horizontally and vertically, due to the fact that we used struts to maintain steadiness during Network RTK GPS readings.
Figure 2: The stabilised Trimble GoeXR Network RTK GPS used to get the coordinates of the target centres.
The C-Astral Bramor Unmanned Aerial System (UAS) platform is a blended wing constructed of Kevlar and carbon fibre and has a 4kg Maximum Take Off Mass (MTOM). It is catapult launched, has extremely steady flight characteristics and advanced safety features afforded by its Lockheed Martin autopilot including a parachute deployment system for emergency and routine landing procedures. It carries a Sony Nex-7 24MP RGB sensor, which is oriented in portrait which allows for more forward overlap at a slower triggering interval. Our ground control markers were carefully designed so the most exact centre of the marker could be determined with a very high degree of accuracy from the photography at the processing stage.
Figure 3: The C-Astral Bramor UAV on the catapult ready for launch.
4. ON SITE CONDITIONS
As Surveyors we wanted to carry out our accuracy test in every day conditions which are often sub optimal. The prevailing weather conditions on the day of our flight test were cloudy with intermittent sunny spells with a wind speed at our flying altitude of 90m Above Ground Level (AGL) was a maximum of 7m/s. The wind direction at altitude diverged from that used in our pre flight planning by 20 degrees. This had the effect on the RPAS of getting a 10m/s variation in its ground speed when travelling with and against the wind.
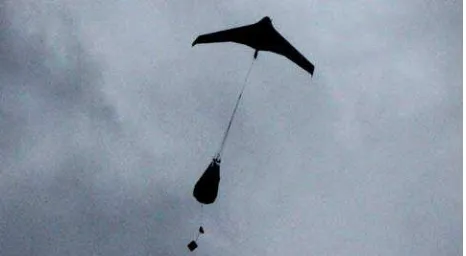
Figure 4: The C-Astral Bramor UAV during the initial deployment of its landing parachute.
The topography of the site had a 5m variation in level, was surrounded by mature woodland up to 25m in height and had numerous buildings which would all contribute to turbulence at our flying altitude.
5. DATA PROCESSING
Firstly 10 ground control points and 45 check points, which were surveyed by Network RTK GPS in Irenet95 coordinates, were downloaded into Geosite office 5.1 and exported to AutoCADlt 2013 as two separate files.
Figure 5: The targets as seen in the Orthomosaic. Note the black dot which represents where the centre of the target is according to the Trimble GoeXR Network RTK GPS.
We downloaded 1601 photographs from the Bramor UAS along with the log file, which contains photo GPS position, barometric height, roll, pitch and yaw. We imported the photos and the logfile into Agisoft PhotoScan and using the software we eliminated superfluous photographs by deleting photos with high roll values, which occurred at turns. The refined 728 photographs were then used for the photo alignment stage; the reason why we used an oversized area is that we felt that the additional photographs would contribute to alignment accuracy of the target area. We then imported the 10 ground control points into Agisoft PhotoScan and identified the centre of each control point marker on each photo and attached it with its appropriate coordinate value.
Of the 728 photographs we then used 168 photographs to further process the data into a 3D model for subsequent orthophoto and DEM output. The orthophoto was outputted at a resolution of 10.2mm pixel size and the Digital Elevation Model (DEM) was outputted at 20mm pixel size.
Figure 6: The detail of 1cm ortophotography can be seen here. This is a view looking down through the atrium over the dinning area of the surveyed hotel. Note the cutlery on the table.
The resulting geo referenced orthophoto and DEM were imported into ArcGIS along with the GPS Computer Aided Design (CAD) data. Distances were measured from the centre of the target, as they appeared on the orthophoto, to the centre of the target as measured by GPS by using the ArcGIS measure tool to attain the distance between both readings. GPS level
point data were compared with DEM readings at the same point. Results were then recorded as shown in figure 7.
6. RESULTS
The resulting geo-referenced orthophoto and DEM were imported into ArcMap along with the coordinated data from the RTK GPS The measure tool was used to measure the horizontal distance between the GPS derived centre of each check point and the centre of each corresponding check point derived from the orthophography. The Z error was calculated by subtracting the GPS derived Z value from the DEM value at the same point. The difference between the two data sets is shown in Figure 7 below.
Figure 7: The dataset of measured errors between the Orthomosaic/DEM Network RTK GPS for the target centers.
Figure 8: This shows Agisoft PhotoScan calculated errors between the GPS control point positions and the positions calculated for the same points in the 3D model generated.
The results in figure 7 where imputed to Microstation to produce the graphs shown in figures 9 and 10.
Figure 9: The planametric distribution of errors derived from the figures in the table shown in figure 7.
Figure 10: The distribution of vertical of errors derived from the figures in the table shown in figure 7.
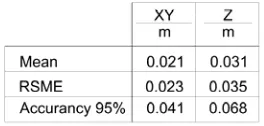
From these the above the following results were obtained.
Figure 11: The mean, root square mean error (RMSE) and the accuracy derived from the figures in the table shown in figure 7. The accuracy at 95% confidence level is taken as planimetrically 1.7308 x RMSE and vertically as 1.9600 x RMSE.( Source - Geospatial Positioning Accuracy Standards. Part 3: National Standard for Spatial Data Accuracy.)
7. DISCUSSION
The significance of the ability of a UAV to capture geographic data with accuracy similar to RTK GPS along with the richness of detail of aerial photography can deliver huge time savings on survey projects. With time, I believe that RPAS photogrammetry will become main stream, but when it does it will almost fully replace current methods of topographical
surveying data collection. The accuracy that can be achieved by UAV photogrammetry is within 1:200 scales according to NSDI & FGDC mapping accuracy standards during sub-optimal data collection conditions.
Now that RPAS can now be reliably used collect geographical data for map scales of up to 1:200, RPAS will mostly overtake the work of GPS and total station ground based survey systems as the main survey grade data collection method used. Although RTK GPS still remains indispensable for accurately geo referencing of ground markers to spatially control the UAV aerial data, UAVs are far more efficient at capturing mass geographic data than either GPS or tacheometry particularly over larger areas. Total Stations and laser scanners unlike GPS and UAVs, are very good at collecting data under tree and building canopies, so will be mostly used to ground survey what cannot be seen from above from a UAV and areas of satellite shadow.
Apart from an enormous time saving on data collection without an appreciable loss in accuracy, RPAS aerial photogrammetry offers far richer data than conventional survey vector data consisting of points, text and lines. RPAS photogrammetry offers the user a bird’s eye view of the site without any need for text or any fear of data being omitted, except for features not visible from the air such as under trees. The accuracy to which levels are generated by the photogrammetry allows for contouring at 0.2m intervals which is very encouraging, GPS readings would still be required for photo control, manhole covers, Finished Floor levels etc., but even so, this still represents a huge leap forward in terms of surveying efficiency.
In terms of representing the landscape, the orthophoto generated from a UAV can be combined with its DEM to produce very accurate photorealistic 3D modelling in programmes such as ArcScene and can be analysed to yield highly accurate earthmoving volumetric calculations.
Figure 12: The outputted Orthomosaic.
8. REFERENCES
References from websites:
Bendea et al., 2007. XXI International CIPA Symposium “Mapping of Archeological Areas using a Low Cost UAV”,
http://www.isprs.org/proceedings/XXXVI/5-C53/papers/FP025.pdf (06 April 2013)
Eisenbeiss H., 2004.” UAV Photogrammetry”, Zurich, Switzerland
http://www.igp-data.ethz.ch/berichte/blaue_Berichte_PDF/105.pdf (03 April 2013)
Haala et al., 2011. 2011 UAV-g Conference, ” Performance Test on UAV-Based Photogrammetric Data Collection”, Stuttgart, Germany
http://www.isprs.org/proceedings/XXXVIII/1-C22/papers/haala.pdf (9 April 2013)
Kung et a., 2011. “The Accuracy of Automatic
Photogrammetric Techniques on Ultra-Light UAV Imagery”, Ecublens, Switzerland
http://www.isprs.org/proceedings/XXXVIII/1-C22/papers/strecha.pdf. (9 April 2013)
Niranjan et al., 2007.” Initial Efforts toward Mission-Specific Imaging Surveys from Aerial Exploring Platforms: UAV”, kampur, India
http://www.gisdevelopment.net/proceedings/mapworldforum/po ster/MWF_Poster_127.pdf (06 April 2013)
Puschel H., 2009.” Set up of a Photogrammetric test field for UAV-Platforms”, Zurich, Switzerland
http://www.igp.ethz.ch/photogrammetry/.../UAV_Testfield_klei n.pdf (07 April 2013)
Rock et al., 2011.” Sensitivity Analysis of
UAV_Photogrammetry for Creating Digital Elevation Models”. http://www.geometh.ethz.ch/uav_g/proceedings/rock_presentati on (08 April 2013)
Vallet et al., 2011. ISPRS ICWG I/V UAV-g Conference, “Photogrammetric Performance of an Ultra-Light Weight Swinglet “UAV””, Zurich, Switzerland
http://www.isprs.org/proceedings/XXXVIII/1-C22/papers/vallet.pdf (7 April 2013)
References from Other Literature
Subcommittee for Base Cartographic Data Federal Geographic Data Committee, 1996.
Geospatial Positioning Accuracy Standards.
Part 3: National Standard for Spatial Data Accuracy, NSDI, Virginia, USA.
The American Society for Photogrammetry and Remote Sensing, 1990.ASPRS Accuracy Standards for Large Scale Maps, ASPRS, Maryland, USA.