QUALITY ASSESSMENT - EXAMPLE OF DIGITAL PRODUCTS
OF
FUNDAMENTAL GEOGRAPHIC INFORMATION OF CHINA
DENG Guoqinga,, XIAO Ping b a
Research Institute of Standards, National Administration of Surveying, Mapping & Geoinformation, 334 East Youyi Road, Xi’an City, P.R. China- [email protected]
b Shaanxi Administration of Surveying, Mapping & Geoinformation, 334 East Youyi Road, Xi’an City, P.R. China- [email protected]
KEY WORDS: Spatial Data Quality, Quality Model, Quality Assessment, DLG, DEM, DOM ABSTRACT:
Digital products of fundamental geographic information are the main components of Digital China Geo-spatial Framework (DCGSF for short). More and more mass data were produced and distributed to various users by different agencies and organizations with continuous implementation of fundamental surveying and mapping activities and various specified projects within national Administration of Surveying, Mapping & Geoinformation. Therefore, what about the description and quality assessment used for these products will directly effect the acquisition, delivery, share, and application of data. A quality model, by which quality is assessed through 3 levels of classification of quality elements, quality subelements, and check items, was built in this paper based on ISO 19113 and ISO 19114 so that to make the quality of digital products of fundamental geographic information to be assessed reasonably, and to make the quality assessment tools to be operable in practice. Quality assessment methods respectively for each of quality elements, quality subelements, and check items are presented. Fundamental data of Digital Line Graphs, Digital Elevation Models, Digital Orthophoto Maps, and Digital Raster Maps at the scale of 1:50, 000 in DCGSF were used as examples to determine the quality of 9 quality elements, 24 quality subelements, and 68 check items considering the contents and the requirements of various users for these data, as well as the practical experiences in quality assessment. 300 DLGs selected from national key projects of surveying and mapping engineering were used for testing to validate the operability of the results mentioned in this paper. Random sampling is used, when sampling, for each layer, which is layered based on production unit and level of difficulty. Quality checking and quality assessment, and statistical analysis was done for samples in terms of item product and lot products respectively. The results from this test indicated that quality model and quality assessment methods introduced in this paper is of good operability, and results from it are reasonably good. Finally, the quality model and quality assessment methods introduced in this paper is applied in the development of national standards.
1. INTRODUCTION
Digital China Geo-spatial Framework (DCGSF) is the general term for policy, laws and regulations, standards, technology, facilities, mechanism, and human resources necessary for fundamental geographic information resources and their collection, processing, distribution and services [1]. As a public service-oriented national spatial information infrastructure, it is consisting of systems of fundamental geographic information products, data directory and exchanging, Policies & regulations and standards, organization and operation, as well as public services, etc.. However, the system of fundamental geographic information products, which mainly including Digital Line Graphs (DLG), Digital Elevation Models (DEM), Digital Orthophoto Maps, etc. is the core of DCGSF.
The cognition of digital products of fundamental geographic information is increasingly improved with the development of modern technology in surveying, mapping, and geoinformation, and with the increasing demands and requirements by information-based society development, as well as with the widening and deepening application of such information. It is hence very important for us to determine appropriate methods to scientifically and objectively describe and assess the quality of these products.
5 quantitative quality elements [2], 3 qualitative quality elements and their subelements were defined and described in “ISO 19113:2002 GEOGRAPHIC INFORMATION—QUALITY
PRINCIPLES”. Processes and procedures [3] for geographic information quality assessment were defined and described in “ISO 19114:2003 GEOGRAPHIC INFORMATION— QUALITY EVALUATION PROCEDURES”. Data quality measures [4] were defined and described in “ISO/TS 19138:2005 GEOGRAPHIC INFORMATION—DATA QUALITY MEASURES”, in which many quality measures were specified for each quality subelement. Basic concepts of spatial data quality and their requirements from the mentioned 3 international standards are respectively introduced from the perspectives of quality description, quality assessment, and quality measuring, and hereby, the prototype for spatial data quality assessment system was built.
Related personnel from Research Institute of Standards, National Administration of Surveying, Mapping & Geoinformation (RISMS for short) began to follow up and learn the lessons from the development of ISO 19113 and ISO 19114 in 2000, they accommodated the concepts of quality elements in GB/T18316-2001 “Specifications for inspection, acceptance and quality assessment of digital surveying and mapping products”, and put forward the 1st
and 2nd class of quality elements with respect to the specific products. The quality models and quality procedures for digital products of fundamental geographic information were built in 2008 during the revision of the above Specifications, and were used in GB/T18316-2008 “Specifications for inspection and acceptance of quality of digital surveying and mapping achievements”.
2. DIGIAL PRODUCT OF FUNDAMENTAL GEOGRAPHIC INFORMATION
Fundamental geographic information, the information concerning such basic information as position, morphology, and attribute, as well as geographic names and geospatial reference of natural and cultural features, such as hydrology in the earth, populated places and their facilities, transportation, pipelines, boundary and administrative areas, physiognomy, vegetation, and quality of soil, etc., is the base for unified framework of spatial positioning and analysing. The products of such information are mainly of DLG, DEM, DOM, and DRG, etc.. The main scales of the digital products of fundamental geographic information in national level are 1:50,000; 1:250,000; and 1:1, 000,000. Taken 1:50,000 as an example, the products at this scale, the digital products of fundamental geographic information with the largest scale, the most quantity of data, the richest content, and the highest accuracy currently in China, are the key components of DCGSF, mainly concerning elevation, image, topography, geographic names, land cover, raster map, and metadata, etc.. Related database totalled up to 5.3 TB was primarily built in 2006, and was subsequently expanded and updated in such projects as west mapping projects , and 1:50,000 fundamental geographic information database updating, etc., among which the amount of images with high accuracy is up to 8.5 TB. Hence, for scientifically and reasonably check and assess data quality, increasing demands and requirements are put forward when acquiring, delivering, using, sharing and exchanging these huge amount of data.
3. QUALITY MODEL
Digital products of fundamental geographic information are checked and assessed with respect of item product and lot products. item product, the basic measure used to check and assess the mentioned digital products, is partitioned based on the standard sheets for national fundamental scaled topographic maps. While the lot products are the collections of item product ones produced on the same technical specifications for the same surveying area.
Quality model of item product is shown in Fig.1. The map number, also the sheet designation for item product used in the standard sheets for national fundamental scaled topographic maps is used to mark it. Quality score,which used 100 as
maximum and calculated in accordance with the method of quality assessment, is ranged from 60 to 100. Quality is assessed as unqualified, qualified, good, and excellent depending on the quality scores.
Quality assessment indexes, the defined limiting values or conditions for qualified products, corresponding to 60 in quality scores, are usually percentage or root mean square error. Those less than the defined quality index are exclusive of quality scores. Checking results are corresponding with quality assessment indexes, the latter is quality requirement, and the former is, practical situation.
Item product
+map number +assessment index +quality score
+quality assessment()
Quality elements
+code +name +description +assessment index +quality score
+quality assessment()
Quality subelements
+code +name +description +assessment index +quality score
+quality assessment()
Inspected entry
+quality check() +quality assessment() +code
+name +description +assessment index +check result +quality score
Fig.1 quality model of item product
1...n 1
1...n 1
1...n 1
The process of quality determination for item product is as following: first, define quality elements, quality subelements, as well as inspected entry contained respectively in item product, quality elements, and quality subelements; second, derive checking results and quality scores from quality checking for inspected entry and from quality assessment based on quality index of the inspected entry respectively; third, derive quality scores of quality elements and subelements from assessment based on those of inspected entry contained in quality elements and subelements; and last, derive quality scores of item product from quality assessment based on those of quality elements contained in item products. Quality checking for item product began with inspected entry, and gradually go up one by one for quality assessment. However, quality assessment for subelements can be incorporated into those for elements in practice based on the actual situation to simplify working processes.
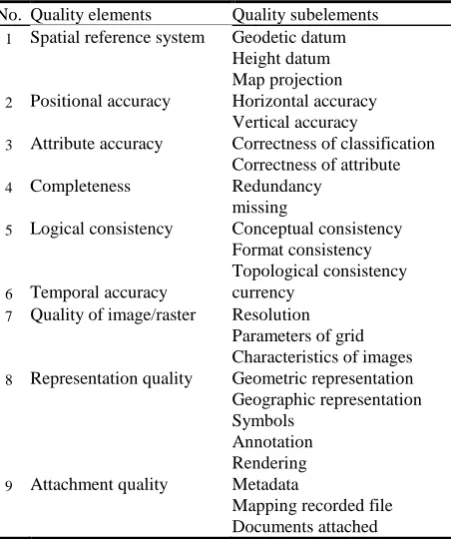
With reference to the requirements for digital products of fundamental geographic information, quality elements and subelements of item product is seen in table 1.
Table 1: quality elements and subelements
No. Quality elements Quality subelements 1 Spatial reference system Geodetic datum
Height datum Map projection 2 Positional accuracy Horizontal accuracy
Vertical accuracy
3 Attribute accuracy Correctness of classification Correctness of attribute
4 Completeness Redundancy
missing
5 Logical consistency Conceptual consistency Format consistency Topological consistency 6 Temporal accuracy currency
7 Quality of image/raster Resolution Parameters of grid Characteristics of images 8 Representation quality Geometric representation Geographic representation Symbols
Annotation Rendering 9 Attachment quality Metadata
Mapping recorded file Documents attached
Quality models of lot products are shown in Fig.2. The process of quality determination for lot products is as following: determine the number of samples based on the number of item product contained in lot products; take samples from lot products by stratified random sampling, i.e. lot products are grouped into different layers based on working teams, level of difficulties and topography, etc. and the number of item product is determined based on the percentage of each layer on lot products, samples are taken with simple random sampling; carry out quality checking and assessment for item products within samples; determine quality grades for lot products based on the quality assessment of quality scores for all the item products within samples.
Lot products
+number of the product +Description
+quality grade
+quality assessment()
+map number +quality scores +quality grade
+quality assessment()
Fig. 2 quality model of lot products 1...n 1
Item products within samples
4. METHODS OF QUALITY ASSESSMENT
It is necessary to calculate quality scores of inspected entry based on particular assessment index and method after quality check for inspected entry of item product. Assessment index is defined as limit value for qualified results, linear interpolation is generally used to assess quality. For example, inspected entry for element omission are designed for quality subelement omission with respect to completeness of quality element, omission rate R is gained when checking the elements omission within map sheet, where R is the rate of the number of elements and total number of elements within map sheet. Assessment index of the inspected entry is defined to be R0=1%, i.e. the
inspected entry is unqualified when R> R0, quality scores for
the inspected entry are derived based on formular (1).
) (
40
60 0
0
R R R
S 1
Where, S is the quality score of inspected entry R0 is assessment index
R is omission rate
When Quality scores for all inspected entry contained in quality elements and subelements are gained, those of quality elements and subelements can be calculated by using formular (2). For practical implementation, the minimum scores for inspected entry can be used based on Cannikin Law. If any of the item is defined as unqualified, all the quality elements and subelements of it are assessed as unqualified also, no quality score is calculated.
ni
i
i
S
P
S
1
)
(
2Where S is the quality scores of quality elements
Si is the quality scores of the ith inspected entry of quality element
Pi is the weight of the ith inspected entry of quality element
When Quality scores for all inspected entry contained in quality elements and subelements are gained, those of quality elements and subelements can be calculated by using formular (3). For practical implementation, the minimum scores for inspected entry can be used based on Cannikin Law. If any of the item is defined as unqualified, all the quality elements and subelements of it are assessed as unqualified also, no quality score is
Where S is the quality score of item product
Si is the quality score of the ith inspected entry of item product Pi is the weight of the ith inspected entry of quality element No quality scores are calculated for lot products, which are classified only as qualified and unqualified. If any of the item product in the sample is assessed as unqualified, the lot products are assessed as unqualified also. Similarly, if all the item products in the sample are assessed as qualified or over qualified, the lot products are assessed as qualified.
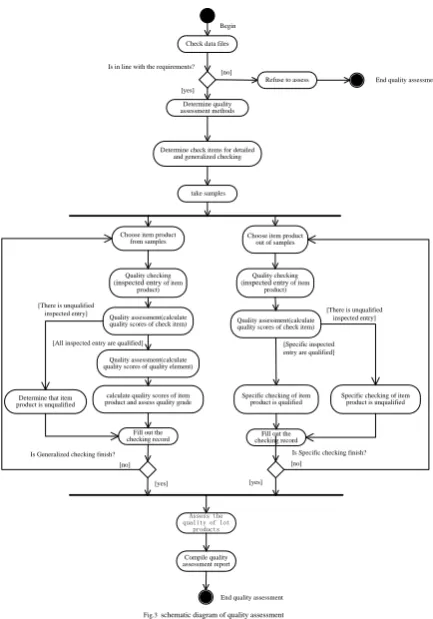
Fig. 3 is the schematic diagram of quality assessment.
Is Specific checking finish? [All inspected entry are qualified]
Check data files
Is in line with the requirements?
Determine quality assessment methods
Determine check items for detailed and generalized checking
take samples
Choose item product
from samples Choose item product out of samples
Quality checking
inspected entry] [There is unqualified inspected entry] Quality assessment(calculate calculate quality scores of item
product and assess quality grade Specific checking of item product is unqualified
Compile quality assessment report
End quality assessment
Fig.3 schematic diagram of quality assessment
[no] [no]
[yes] [yes]
Is Generalized checking finish?
5. EXAMPLE OF QUALITY ASSESSMENT
300 Digital Line Graphs were taken from 2768 maps of a survey area to take the test with stratified random sampling based on
the layers from the perspectives of production unit and level of difficulty. 6 quality elements, 17 subelements, and 53 inspected entry were determined. Assessment indexes are listed in table 2. Table 2 inspected entry and assessment indexes
No. Quality
The results of all inspected entry contained in item products are derived from quality checking of sampled DLGs one by one. All these results are input into the software developed specifically for quality assessment, and various parameters including assessment indexes are set to automatically assess with the software the quality of all the item products, the final results are shown in table 3.
Table 3 assessment result of item product Quality practical situation of the development of DCGSF. A number of testing maps were selected to test and validate assessments, which proved the feasibility and practicality of the results checked and assessed with the methods in this paper. The study results had already been used in revision of some related national standards, and they were proved to be usability and rationality based on the comments and suggestions feedback from the processes of asking for standard comments, examining standard for approval, outreach for standards implementation. However, the results presented in this paper should be improved and modified due to the complexity and diversity of spatial data, as well as with the changing requirements of users, and with improved cognition of spatial data quality.
References
[1] CH/T 9003-2009 Basic specifications for geospatial framework. Surveying and Mapping Press,Beijing, pp. 1-2. [2] ISO 19113:2002 GEOGRAPHIC INFORMATION— QUALITY PRINCIPLES. Surveying and Mapping Press,Beijing, pp. 1-2.
[3] ISO 19114:2003 GEOGRAPHIC INFORMATION— QUALITY EVALUATION PROCEDURES. Surveying and Mapping Press,Beijing, pp. 1-2.
[4] ISO/TS 19138:2005 GEOGRAPHIC INFORMATION— DATA QUALITY MEASURES. Surveying and Mapping Press,Beijing, pp. 1-2.
ACKNOWLEDGEMENT
The authors wish to extend thanks to national geomatics center of China and the station of surveying and mapping product quality inspection and supervision, which is under the leadership of Shaanxi Administration of Surveying, Mapping & Geoinformation, for their support of test data provided for the test.
DENG Guoqing, Senior Engineer, graduated from the department of photogrammetry and remote sensing of Wuhan University (the former Wuhan technical university of surveying and mapping) in 1993, now go in for development and revision of surveying, mapping and geoinformation in Research Institute of Standards, National Administration of Surveying, Mapping & Geoinformation.