UAS-based automatic bird count of a common gull colony
G. J. Grenzdörffer a
a
Rostock University, Chair for Geodesy and Geoinformatics, 18059 Rostock, Germany - [email protected]
Commission I, ICWG I/5
KEY WORDS: UAS, 3D-Point Cloud, Image Classification, DEM
ABSTRACT:
The standard procedure to count birds is a manual one. However a manual bird count is a time consuming and cumbersome process, requiring several people going from nest to nest counting the birds and the clutches. High resolution imagery, generated with a UAS (Unmanned Aircraft System) offer an interesting alternative. Experiences and results of UAS surveys for automatic bird count of the last two years are presented for the bird reserve island Langenwerder. For 2011 1,568 birds (± 5 %.) were detected on the image mosaic, based on multispectral image classification and GIS-based post processing. Based on the experiences of 2011 the results and the accuracy of the automatic bird count 2012 became more efficient. For 2012 1,938 birds with an accuracy of approx. ± 3 % were counted. Additionally a separation of breeding and non-breeding birds was performed with the assumption, that standing birds cause a visible shade. The final section of the paper is devoted to the analysis of the 3D-point cloud. Thereby the point cloud was used to determine the height of the vegetation and the extend and depth of closed sinks, which are unsuitable for breeding birds.
1. Introduction
1.1 Motivation and study area
The standard procedure to count birds is a manual one. Howev-er a manual bird count is a time consuming and cumbHowev-ersome process, requiring several people which go from nest to nest counting the birds and the clutches. Double counts or no counts cannot be avoided. The average accuracy is somewhat between 80 – 90 %. For sure however, the birds receive additional stress during the breeding process. Manual counts, based on estima-tion and extrapolaestima-tion are generally subject to even greater inaccuracies. These depend on the species to be examined, the number of individuals, the observer and the observation point. Here over- or underestimates of 25% are not uncommon (e.g. Bibby et al., 1995, Kulemeyer et al., 2011) with accumulations of 2,000 individuals or more.
Alternative procedures, e.g. using remote sensing or image analysis techniques were not available in the past, because the necessary ground sampling distance of 2 cm or better to clearly detect birds could not be obtained with a common aerial survey. Furthermore aerial surveys of such small areas are often not economically feasible. Since a few years UAS offer an interest-ing alternative. Other studies, for example Sardà-Palomera et al. (2012), Watts et al., (2010) have shown that in principle it is possible to observe birds with UAS. However, these two studies were limited to the use of UAS and the evaluation of image acquisition, the bird count has been done manually.
The study area is the approximately 25 ha bird reserve island Langenwerder. The area located north of the island of Poel and is under protection since 1903. The island is mostly covered with grass and reeds and nearly free of trees. The island is a nature reserve and closed to the public. To protect the nesting birds during the main breeding season an electric fence set up in the south of the island, to keep foxes and wild boars away from the island.
The predominant bird of the island is the common gull (Larus canus). The island is home to the largest colony of gulls along the Baltic Sea coast, but with a deceasing tendency. While there were 3,000 breeding pairs in 2002, the number has declined in recent years to about 1,500 breeding pairs. Among other species of breeding birds, the island an important resting place for migratory birds, such as Brent geese and Lemikolen. An adult Common Gull has a body length of 40-45 cm and a wingspan of 100-130 cm. Seen from above, the common gull typically has a white head, a light gray plumage and gray to white tail feathers. 1.2 UAS and birds?
Prior to the first flights in May 2011 the big question was how do the birds react to a UAS? Strong disturbances of the birds are known from low flying manned airplanes used for sea bird surveys, e.g. Kulemeyer et al., (2010). Other authors report a minimum flight height of 300 - 400 m above ground for undis-turbed aerial bird surveys.
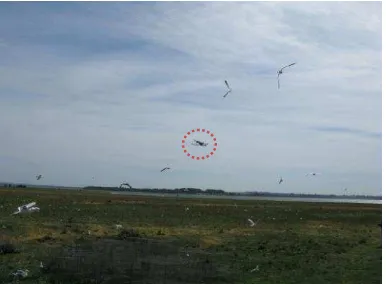
Fortunately the birds did not show any panic or escape behavior against the electrically powered multicopters (Falcon 8, MD 4 1000). At distances of 15 m and more the birds just ignored the UAS. Not only the common gulls, but all birds on the island showed this behavior, see Figure 1
1.3 UAS-aerial survey planning for bird count
After the birds obvious ignorance to the UAS, the next was question, what altitude or GSD is necessary to recognize the birds one hand and on the other hand to ensure maximum ground coverage per image keeping the limited flight time of about 15 minutes Falcon 8 in mind. One assumption was that a bird should be covered with about 20 - 30 pixels to make sure it can identified safely on the digital images. This assumption was empirically tested. The determined optimal flight altitude for the 40-45 cm birds was 50 m with an associated GSD of about 1.6 cm.
Figure 1. Birds show no disturbance by UAS (Falcon 8) In the photo flight planning a 80% endlap and a 60% crosslap was chosen. The large crosslap should ensure that wind gusts, which can cause uncontrollable rolling movements do not lead to gaps in the image mosaic. Additionally the large overlap enhances the georeferencing procedures and enables the crea-tion of a true orthophoto. During an aerial survey the UAS will usually stop several seconds to trigger a near nadir image. After it has been found that the so-triggered images are not so much more vertical, especially under windy conditions, this function was disabled. Now the images are triggered continuously at a Camera stabilisation Yes (2-axes) Yes (2-axes)
Camera Sony NEX5 Olympus PEN
E2
Camera Resolution (Pixel) 4592 x 3056 3000 x 4000 Table 1. UAS used for aerial surveys of bird reserve island poor UAS flight performance and unsystematic images were triggered. The second flight went smoothly and 50 images were available for further processing. A classic aerial triangulation was not possible due to the lack of control points, as the island could unfortunately not be accessed for control point measure-ments. An aerotriangulation without ground control was also not feasible because the GPS of the UAS with approximately ± 2-3 meters accuracy are too inaccurate for standard photogram-metric software tools such as ERDAS LPS.
Finally, a different approach was chosen, which is based on commercial panorama software. After various experiments with
finally fell on the software Autopano Giga 2.5. This software allows for multiple locations and also allows to correct some wrong assignments manually. During mosaicking it has been found that the radial distortion, which is quite significant at the wide-angle lens of the Sony NEX5, cannot be modeled ade-quately by the software. Consequently, the radial distortion was corrected with the software ImageIron and the stitching and mosaiking was done with the corrected images in Autopano. The resulting color balanced mosaic has 20,520 x 19,297 pixels and covers an area of approximately 4.4 hectares. Finally, the image mosaic was roughly georeferenced using 4 points ac-quired from existing orthophotos. Due to the flat terrain the residuals are within 1 m.
2. Automatic bird recognition and bird count 2011
The recognition of the birds that was done by P. Schneider (2011) as part of his bachelor thesis. Thereby a simple strategy has been pursued, which is based primarily on the spectral properties of the seagulls. Ultimately the birds are almost the only white elements in the pictures with their white heads and light gray body. A more complex object-oriented approach was deliberately omitted, since the image data set is quite large and that can result in long processing times. Only in a second stage, size and shape play a role. In particular, the data analysis is as follows:
1. Supervised classification:
As the seagulls have a white head and a light gray plumage, they are spectrally easily identifiable in the color images. With the ArcGIS 10 software a supervised multi spectral classifica-tion with a total of 7 classes was conducted. The resulting grid with the class "birds" (52,488 objects) was transferred into vector form.
2. Size-based selection of birds
At the beach there was a spectral overlap between the birds and the bright sand. Since no birds are nesting on the beach, the beach area was digitized and the classified objects in that area were eliminated (11,157 objects remain). The area of the "bird" objects was calculated and added as a new attribute to the poly-gons. Subsequently all objects whose surface area is less than 10 cm² (e.g. small bright stones, etc.) were removed. Large objects, for example Mute swans were also been removed by a size threshold of > 2.000 cm ². Due to the change in color, light head, gray plumage and bright tail feathers of birds, a single bird was often classified as two closely spaced bird objects. To merge the two parts, neighbouring polygons whose distance from one another is less than 24 cm were united. Finally all remaining objects with less than 20 cm² were removed, see figure 2a-b.
Figure 2a. bird object before Figure 2b. bird object after International Archives of the Photogrammetry, Remote Sensing and Spatial Information Sciences, Volume XL-1/W2, 2013
As a result 1,568 birds were counted. The accuracy (over- and underestimation) was determined using visual counts against a defined section with 500 bird objects.
During the visual quality check of the 500 bird objects 477 gulls (95.4%) could actually be verified. Thereby 65 objects were identified incorrectly as a bird and at the same time 42 birds were not classified as such. When counting by hand several main characteristic errors of the recognition of "bird" objects could be identified: incorrectly recognized objects were mainly pieces of wood, stones and locally bright spots in green spaces. In addition, "dark" and or birds in the shade of bushes were not detected. Birds too close together classified as one object. Also some birds in blurred image regions were not classified correct-ly. Main reasons for image blur was on the one hand the wide-angle lens of the Sony NEX5 and on the other hand the stitching software that generated a blurred area around the seamlines of adjacent images.
3. Automatic Bird recognition and Bird count 2012
Building on the experience of 2011, in 2012 the study area could be extended by using the MD4-1000, which has a flight time of about 25 - 30 minutes per battery. Also the flight alti-tude above ground was slightly increased to 55 m. An aerial survey of the relevant parts of the island could be carried out successfully on 25.5.2012 recording a total of 629 images. The external conditions were perfect, almost windless and cloudless sky. The aerial survey of the island was carried out by four individual flights to temporarily change the battery and to min-imize the required time of flight by a clever choice of the start-ing points. To ensure that the camera does not stop to take images during the flight because of lack of electricity, the cam-era battery was changed between flights.
Accompanying the aerial survey some signalized control points were measured with a RTK GPS at one edge of the island. Since the birds were in the business of breeding, island could not be accessed for control point measurements. Thus, the ground control points mainly served to fit the block in terms of position and scale.
The photogrammetric data analysis was performed using the software Pix4D, which was used as a web service. The results of the photogrammetric data processing were a digital ortho photo, a digital surface model (DSM) and a 3D-point cloud. According to the report the position and height accuracy (1σ) at the five control points was approximately 5 mm.
3.1 Automatic bird recognition and bird count 2012
The method of automatic bird count in 2012 is basically similar to the approach for 2011. Only the size of the filter to eliminate small misallocations and large objects were changed slightly.
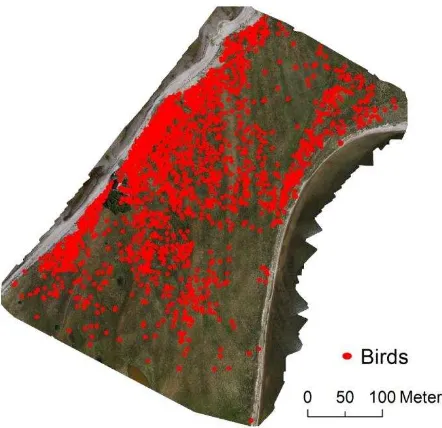
The “bird census” for 2012 showed a total of 1,945 birds, see
Figure 3. The classification quality was validated with 605 objects. There were 560 items verified as birds. On closer in-spection 45 objects turned out to not be a bird, but as something else. At the same time 31 birds were not recognized as such. That means 97.6% of the birds were detected. The increase in the classification accuracy in 2012, can be clearly attributed to the better image quality.
Figure 3. Identified bird objects (red dots) from UAS aerial survey of 25.5.2012 on the birds reserve island Langenwerder 3.2 Identification of breeding birds
For the bird census counting all individuals is an important factor. The number of clutches is of more interest to the orni-thologists, than just the number of birds, because the average number of eggs per clutch is known and the reproduction poten-tial is an important number. Since the size of the nest is not visible from the air - after all the birds sit on the nest, it is of great interest to determine at least the number of breeding pairs. The conducted aerial survey during the morning hours was basically at an optimal time, as in most breeding pairs, one partner at this time is out foraging for food. So the number of counted birds approximately matches with the breeding pairs. Visually the breeding birds can be distinguished from the stand-ing birds. A closer inspection reveals that the standstand-ing birds produce a small shadow, as shown nicely in Figs 4a and 4c. The direction and length of the shadow is determined by the position of the sun, resulting from the geographical position (54° 01 'N, 11° 29' E) and the time (about 10:00 clock EST), as well as the size of the upright standing birds. Thus, the shadow falls from an elevation of about 40° toward 290° (WNW). With a bird size of about 30 to max. 40 cm, the length of the shadow is 34 - 46 cm.
The dark shadow area can be easily classified and spectrally separated from the rest of the image. Around the birds a sectoral buffer was defined with a diameter of 40 cm. The shadow mask was overlaid with the bird buffer zones (4,137 objects). It turns out that many wrong assignments have been eliminated in further processing steps. The errors in this initial step are due to the fact, that the vegetation (grassland) itself introduces many small shadow elements and furthermore birds like to breed in tall grass, which creates the shadows. A first area filter removes many small shadow elements that can occur next to breeding birds. Another filter eliminates shadow objects that are not adjacent to a bird, which means less than 15 cm from the bird centroid. A final filtering step selects those birds that are not in the tall grass (> 15 cm). The grass height is determined from the point cloud (see section 6.1).
The dark shadow area can be easily classified and spectrally separated from the rest of the image. Around the birds a sectoral buffer was defined with a diameter of 40 cm. The shadow mask was overlaid with the bird buffer zones (4,137 objects). It turns out that many wrong assignments could be eliminated in further processing steps. The errors in this initial step are due to the fact, that the vegetation (grassland) itself introduces many small shadow elements and furthermore birds like to breed in tall grass, which creates the shadows. A first area filter removes many small shadow elements that can occur next to breeding birds. Another filter eliminates shadow objects that are not adjacent to a bird, which means less than 15 cm from the bird centroid. A final filtering step selects those birds that are not in the tall grass (> 15 cm). The grass height is determined from the point cloud (see section 6.1).
Finally, 54 birds could be identified that do not breed, but pur-sue other activities. A visual inspection revealed that the strate-gy was not really successful. Rather, the success rate was only about 74%. Among others, one reason is birds often breed in the immediate vicinity to some higher grasses which cause shad-ows. At the same time several standing birds were also not recorded properly, e.g. because they stand with their longitudi-nal axis in east-west direction, so they only cast very small shadows, see figure 4a-c. As a conclusion perhaps 50 - 100 birds are not in the business of breeding, so that the number of breeding pairs on Langenwerder in 2012 is about 1,850 - 1,900. 3.3 Accuracy assessment
Unfortunately, no census of the total Gull colony of the study
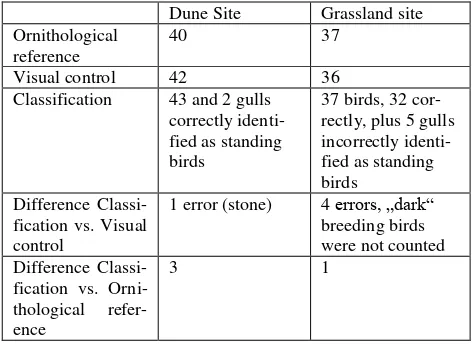
years by the ornithological society Langenwerder e.V. Never-theless some reference data is available for two small monitor-ing sites, which in 2012 host 40 (dune site) and 37 (grassland site) breeding pairs respectively. The comparison to the UAS-based bird count is shown in table 2.
Dune Site Grassland site Ornithological
reference
40 37
Visual control 42 36
Classification 43 and 2 gulls correctly
identi-Table 2. Reference counts and classification accuracy
The visual count of the image data and the reference observa-tions are almost identical (78 birds vs. 77 birds). In total the visual inspection shows a very high correlation with the auto-matic classification (± 1 breeding bird). The autoauto-matic classifi-cation and shading analysis works very well in the dune test area. In tall grass the automatic classification is rather conserva-tive, i.e. there are too few birds counted. The automatic classifi-cation of the shadow cast to identify standing birds does not really work in tall grass (which was also expected).
4. SPATIAL DISTRIBUTION OF BIRDS
The breeding places of the ground-nesting birds are not evenly spread throughout the island - which could not really be ex-pected. Rather the mass of the birds reside on the western side, or nest on the levee (see Figure 3). The main reason for this behavior is probably that the prevailing westerly winds there can optimally reach under the wings of the birds and hence the energy consumption is minimal when starting. In the southeast of the island only a few birds can be observed, which is accord-ing to statements of local ornithologists due to higher vegeta-tion. In the middle and in the north of the island relatively few Figure 4a. correctly classified standing
birds are also observed. Reasons for these observations are most probable related to unfavorable breeding conditions.
According to the literature, the male bird chooses the nesting site, which is often at the same spot as in previous years, e.g. von Blotzheim and Bauer (2000). The nesting area should be as safe possible against terrestrial predators, weather and flooding. Usually the ground nests are located at places with little vegeta-tion. Otherwise, ground nests may also be located in inaccessi-ble places such as small islands, headlands, dams or quaking bogs.
The remote sensing data (orthophoto, DTM and the 3D point cloud) derived from the UAS delivers important site characteris-tics.
4.1 Determination of canopy height from the 3D point cloud
The height of the vegetation cannot be determined directly from the digital surface model without a reference DTM. Much more interesting is the 3D point cloud. As shown in profile (Figure 5) the canopy surface is not represented by a clear boundary, but by a fringe with a certain height. The height of the fringe (= canopy) varies, depending on the height of the grasses, sedges or small bushes.
Figure 5. 2 m wide and 42 m long cross section through 3D-point cloud (from left to right) (beach – ornithological station - shed - shrubs)
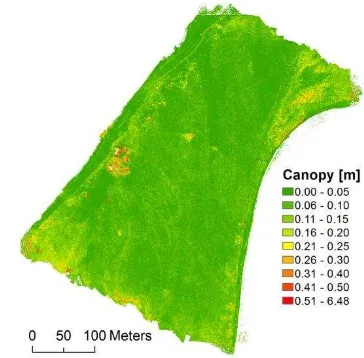
To determine the height of the fringe or the vegetation, the 3D point cloud was analyzed with the software LAStools / lascanopy. The average point density of the point cloud is 215 points / m² and the average point spacing is 6.8 cm. Thus, com-pared with conventional laser scanners the point density derived from the UAS imagery is very high. In principle the point densi-ty should be high enough to describe the irregular canopy sur-face. For grid with a cell of 0.5 m the minimum, average, max-imum and standard deviation of points per grid cell were calcu-lated. Since the extreme values (minimum and maximum) may be erroneous, due to single outliers, in this case two times the standard deviation represents best the actual canopy height (Figure 6).
As mentioned above, favorable locations of the open nests are in low vegetation. Figure 7 shows the distribution of plant height at each bird locations.
Figure 6. Calculated canopy height from the 3D point cloud
Figure 7. Vegetation height adjacent to the birds 4.2 Geomorphology and bird distribution
The overall very flat island Langenwerder with an average height of only 1.09 m above the sea level is constantly "in mo-tion" because it is constantly eroded on one side and “new” sand is deposited on the other side of the island. During the for-mation of the island after the last glaciation, prevailing souther-ly currents and winds formed the beach ridges that run from NNE to SSW, Lemke, 2004. This can be observed on the digital terrain model very well, see Figure 8
The current coastal forming processes are somewhat different to former times. Firstly, the main wind and the main flow direction have changed to west, so that the island grows on the southwest side. On the other hand, the island is under pressure on its northwest side, especially during storm weather conditions. This material is shifted to the north-east side of the island and in-creases the headland at that place.
As mentioned, birds seek their breeding sites in dry, non-flood endangered areas. In order to verify this closed sinks were calculated from the DEM. In these areas heavy rainfall may cause wet grounds or local flooding. On the other hand, at high tide the water level may raise up to 70 cm above normal within hours and cause local flooding, Figure 9.
< 10 cm
20 cm
30 cm
40 cm
50 cm
60 cm
Legend
Figure 8. DSM of the bird reserve island Langenwerder
Figure 9: Flood endangered areas and closed sinks derived from the DTM
4.3 Summary and Outlook
In this paper it was demonstrated that in principle it is possible to count birds using UAS with great reliability. However, this methodology does not necessarily apply to other bird species, as the examined gulls provide very good contrast to its surround-ings.
The bird count with the UAS is to be continued in the current year. Special focus will be given on the study of the nest site fidelity.
5. References
Bibby J. C., Burgess N. D., Hill D. A., 1995. Methoden der Feldornithologie; Bestandserfassung in der Praxis. Neumann Verlag GmbH
Kulemeyer, C., Schulz, A. Weidauer, A., Röhrbein, V., Schlei-cher, K. Foy, T., Grenzdörffer, G. and Coppack, T., 2011. Geo-referenzierte Digitalfotografie zur objektiven and reproduzier-baren Quantifizierung von Rastvögeln auf See,- Vogelwarte 49, 2011: S. 105 – 110
Lemke, M., 2004. Geodatenerfassung and -fortführung für landschaftsökologische and naturschutzkundliche Aufgaben am Beispiel der Insel Langenwerder.- unveröff. Diplomarbeit TU Berlin, 121 S.
Sardà-Palomera, F., Bota, G., Viñolo, C., Pallarés, O., Sazatornil, V., Brotons, L., Gomáriz, S. And Sardà, F., 2012), Fine-scale bird monitoring from light unmanned aircraft sys-tems. Int. Journal of avian science (Ibis), 154: S. 177–183. Schneider, P., 2011. Hochmoderne luftbildgestützte Zählung von Vögeln mit Hilfe eines Multicopters - am Beispiel einer Sturmmöwenkolonie auf der Vogelinsel Langenwerder, Bache-lorarbeit, Universität Rostock 39. S.
von Blotzheim U.N. and Bauer, K.M., 2000. Handbuch der Vögel Mitteleuropas, Band 8/I, Charadriiformes (3. Teil), Schnepfen-, Möwen- and Alkenvögel, S. 440–493.
Watts, A. C., Perry, J. H., Smith, S. E., Burgess, M. A., Wil-kinson, B. E., Szantoi, Z., Ifju, P. G. and Percival, H. F., 2010. Small Unmanned Aircraft Systems for Low-Altitude Aerial Surveys. The Journal of Wildlife Management, 74: 1614–1619. International Archives of the Photogrammetry, Remote Sensing and Spatial Information Sciences, Volume XL-1/W2, 2013