A CLASS-OUTLIER APPROACH FOR ENVIRONNEMENTAL MONITORING USING
UAV HYPERSPECTRAL IMAGES
S. Hemissia∗
, I. Riadh Farahb
a
Faculty of Applied Medical Sciences in Turbah, Taif University, KSA,
RIADI Laboratory, University of Manouba, Campus universitaire de la Manouba, – [email protected] b
RIADI Laboratory, University of Manouba, Campus universitaire de la Manouba, Telecom Bretagne, Brest, France – [email protected]
KEY WORDS:Unnamed aerial vehicle, Hyperspectral images, Class-label outlier detection, Knowledge discovery, vegetation indices, partially supervised learning.
ABSTRACT:
In several remote sensing applications, detecting exceptional/irregular regions (i.e, pixels) with respect to the whole dataset homogene-ity is regarded as a very interested issue. Currently, this is limited to the pre-processing step aiming to eliminate the cloud or noisy pixels. In this paper, we propose to extend the coverage area and to tackle this issue by regarding the irregular/exceptional pixels as outliers. The main purpose is the adaptation of the class outlier mining concept in order to find abnormal and irregular pixels in hyperspectral images. This should be done taking into account the class labels and the relative uncertainty of collected data. To reach this goal, the Class Outliers: DistanceBased (CODB) algorithm is enhanced to take into account the multivariate high-dimensional data and the concomitant partially available knowledge of our data. This is mainly done by using belief theory and a learnable task-specific similarity measure. To validate our approach, we apply it for vegetation inspection and normality monitoring. For experimental pur-poses, the Airborne Prism Experiment (APEX) data, set acquired during an APEX flight campaign in June2011, was used. Moreover, a collection of simulated hyperspectral images and spectral indices, providing a quantitative indicator of vegetation health, were gener-ated for this purpose. The encouraging obtained results can be used to monitor areas where vegetation may be stressed, as a proxy to detect potential drought.
1. INTRODUCTION
Recently, hyperspectral sensors, deployed on UAVs (Unmanned Aerial Vehicle), is emerging as an irreproachable means for earth observation and environmental degradation monitoring. This evo-lution leads to a refined aerial recovery of all spectral and spatial features within the site of interest. Nevertheless, spatially uncor-related pixels is a rather challenging issue in statistical and cog-nitive researches. This is due to the large intra-class variability and view-point addiction. Efficient surveying, not only, implies to detect spectral homogeneous/heterogeneous regions, but also to properly separate the noise from outliers and then to induce the origins of suspicious areas. Therefore, approaches for mod-eling and detecting such outliers are drawing growing thinking (Hodge and Austin, 2004, Zimek et al., 2012).
Generally, outliers mining is the question of identifying rare events, irregular individuals, and exceptions. Nowadays, it is seen as an emerging data interpretation which arouses a great interest in di-verse application areas. Latterly, several works have been devoted to this problem and have tried to design effective techniques for outliers detection. It mainly concerns many fields such as fraud detection (Konijn and Kowalczyk, 2011), network security (Do-gan and Dalkilic, 2010), data mining (Agyemang, 2006), etc. Formally, an Outlier is an object that deviates considerably from other objects. This fact incites suspicion that it possesses a dif-ferent structure engendered by a divergent mechanism (Hodge and Austin, 2004) or generated by a different distribution. An outlier is then a sample that does not adhere to the the general na-ture of the data (mainly diagnosed as noise or exception) which is considerably fruitful for remote sensing data analysis. Over-all,methods devoted for outliers detection can be mainly catego-rized into statistical based, depth based, distance based, density based methods (Pasha and Umesh, 2013, Bakar et al., 2006). A
∗
Corresponding author : Selim Hemissi, [email protected]
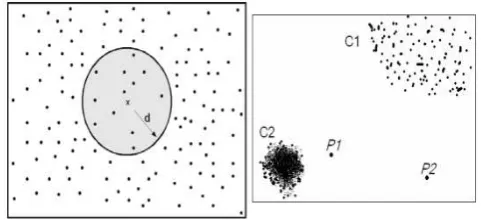
successful way for outlier detection is to explore the distance be-tween a sample and it’s nearest neighbors (Figure 1) (Hewahi and Saad, 2007).
Figure 1: Difference between distance-based approach (LEFT) and Density-based approach (Right)
Recent comparative studies have shown the noteworthy effective-ness of distance based approaches. We shall discuss, in this paper, these methods in detail due to its association to the proposed ap-proach. If the neighboring samples are approximately close, then the example is seen as regular. But otherwise (i.e, neighboring data are spaced apart), then the sample is seen as irregular. The contribution of distance-based mathods are that, no explicit dis-tribution needs to be specified to regulate irregularity. Therefore, such methods are perfectly suited for any feature space including a reliable distance metric (Hodge and Austin, 2004).
For this purpose, the Class Outliers: DistanceBased (CODB) al-gorithm is enhanced to take into account the multivariate high-dimensional data and the partially learning aspect of our data.
2. PROBLEM STATEMENT AND RELATED WORKS
Pixels or regions which can be observed as ”Outliers” are anoma-lous due to different reasons (e.g. climate change, natural disas-ter, epidemic, etc.). After detection, anomalous points can be retained because they contain interesting information or can be discarded/deleted. Outlier detection methods are used, mostly, to reduce the impact and effect of outliers in the ultimate stage of the proposed model, or as a prior pre-processing step before the data is being processed. In more interesting applications, such as change detection and anomalies detection, the concept of outliers are more attractive and helpful to identify abnormal regions and outliers detection algorithms should be upgraded to properly lo-cate them.
By updating the aim of outlier processing for the case of remotely sensed images, traditional approaches are often not suitable to treat hyperspectral data. Hence, recent researches were inter-ested on an adapted outlier detection for these kind of informa-tion. Specially, a significant number of contributions based on artificial intelligence and image processing have been proposed in order to develop new innovative approaches that can be more suitable in different application cases. Malpica et al. (Alonso and Malpica, 2009) propose an innovative technique for outlier detec-tion in hyperspectral images. As well known, each pixel of the hyperspectral cude is associated to a spectral vector and electro-magnetic spectrum. The authors develop an approach based on Projection Pursuit (PP) to detect potential anomalies. It is based on the use of linear combinations of the original features with the goal of maximizing an index representing an interestingness measure. The results show that PP technique can detect group of outliers or isolated outlier; the proposed algorithm was applied to AHS and HYDICE hyperspectral imageries.
The first issue experiencing the reviewed works is that the outlier identification process depends on the underlying distribution of the dataset. Thus, this field is became a productive area of applied statistical research. One solution is to make the assumption that the distribution is univariate (following an approximately normal distribution) (Hodge and Austin, 2004). Nevertheless, with real hyperspectral multivariate dataset, this hypothesis is not satisfied, and the outlier identification process will be guided by the type of the data rather than the presence of an outlier. In fact, due to high number of bands, the big amount of data can result redundant and the most interesting information is difficult to extract because of the high dimensionality of data themselves.
Smetel et al. (Smetek and Bauer, 2007) introduce the use of mul-tivariate outlier detection approach for detecting anomalies in hy-perspectral image data. They demonstrates the insufficiency of statistical methods for this end. Li et al. (Liu et al., 2014) adopt the use of outlier detection concept to detect small target un hy-perspectral images.
3. PROPOSED APPROACH
Let’s note by Z an hyperspectral image compsed of N pixels (samples). Each sample is assumed to belong to one ofCclasses. ζthe learning set is then defined as following :
ζ={(xi, ci), i= 1, . . . , N} (1)
Each sample is characterized by an attribute vectorx∈Rpand its similarity measure to all other samples (proximity data). The class membership of each object may be:
• Completely known, described by class labels (supervised learning);
• Completely unknown (unsupervised learning);
• Known for some objects, and unknown for others (semi-supervised learning).
A successful strategy to detect outliers is by considering the dis-tances to an example’s nearest neighbors (Knorr et al., 2000). In this approach, we precisely examine the local neighborhood of an object mostly defined by theKnearest examples. If the neigh-boring points are almost close, then the object is seen as regular; but if the neighboring points are far away, then the example is seen as irregular.
The distance-based outlier approach was introduced by Knorr and Ng (Knorr and Ng, 1998), where an outlier is considered as: ”An objectOin a datasetT is aDB(p, D)-outlier if at least fraction pof the objects inTremained at a distance greater thanDfrom O”, whereD: neighboring set of an outlier ; andpis the mini-mum set of objects that should stay outside ofD. In most cases, the Mahalanobis distance is used as outlying degree.
In this paper we investigate the adaptation of Class Outlier Min-ing formulated here as : given a set of hyperspectral pixels with class information, detect those that arouse suspicions, consid-ering the neighborhood classes and the related spectral indices. Based on the Class Outliers: DistanceBased (CODB) algorithm (Hewahi and Saad, 2007), the irregular pixels are those satisfying the following criteria :
1. has the minimum distance to itsKnearest neighbors.
2. has the largest deviation ;
3. its class label differs from theKnearest neighbors class.
The originality of this algorithm is to consider that it is judicious to take samples having a class label which is different from the majority of the KNN while considering the Class Outlier Factor (COF) for a sampleXdefined as :
CP F(X) =K∗P CL(X, K)+α∗ 1
Deviation(X)+β∗KDist(X) (2) where :
• P CL(X, K)is the probability of the class label of the in-stanceX with respect to the class labels of itsK nearest neighbors ;
• Deviation(X) is the degree of deviation that makes the sampleXfrom data of the same class,
• KDist(X)is the sum of distances betweenX and itsK nearest neighbors
• αandβare parameters to manage the effect ofDeviation(X) andKDist(X)
In real world, only a limited knowledge of class information is available. This situation is a transitional issue between supervised and unsupervised learning known aspartiallysupervised learning. In this case, the class membership is commonly predicted with uncertainty and the probabilityP CL(X, K)may not be suited to deal with hyperspectral data.
classical CODB algorithm by using he theory of belief functions which is suitable for modeling the partially supervised learning problem and to better handle uncertain and imprecise class infor-mation (me et al., 2009). In fact, the theory of belief functions showed a major potential and a reliable framework for modeling uncertain and imprecise class information in related fields such as classification, unmixing and feature combination (Hemissi et al., 2012).
Let now denote byΩthe set of classes and the learning dataset becomes :
ζ={(xi, mi), i= 1, . . . , N} (3)
where : xi is the attribute vector of objectxi andci ∈ Ω. A
potential outlier samplexis classically assigned to the majority class inΩk(x), whereΩk(x) is thek nearest neighbors ox x
in ζ. Each sampleei = (xi, mi) ∈ Ωk(x)is seen as a part
of knowledge regardingΩand the class of the samplex. The exactness of this evidence depends on the distance betweenxand xi. It may be illustrated by the following equations :
mi({ci}) =α.φ(d(x, xi)), mi(Ω) = 1−α.φ(d(x, xi)) (4)
whereαis a constant andφis a decreasing function fromR+to
[0,1]:limd→+∞φ(d) = 0(me et al., 2009). So, the proposed version of the CODB algorithm is illustrated by algo. 1..
Algorithm 1Pseudo-code of the modified CODB algorithm Require: ι={(xi, mi), i= 1, . . . , N},
K: Number of neighbors. 1: forg= 1, . . . , Ndo
2: Computemi({ci})andmi(Ω), formula 4
3: Compute COF for all instances, formula 2 4: end for
5: return Resort the topPlist according to theirCOFvalue.
The second contribution is to adapt the classical distance met-ric in order to take into account the dimentionality of the hyper-spectral data. This distance is computed based on some spec-tral indices relative to vegetation proprieties. The definition of spectral indices began with the Simple Ratio (SR) of bands. One of the most widespread and prevalent index for vegetation is the Normalized Difference Vegetation Index (NDVI) utilized the re-flectance of the infrared and red regions to reveal the presence vegetation in the study zone. The retained spectral indices of our research are synthesized by table 3..
Index APEX Band Combination (Wavelength inµm) NDBI 160,145(1.45µm,1.304µm)
MTVI1 81,17,52(0.7958µm,0.5567µm,0.6784µm) NDVI 236,225(2.09µm,2.007µm) NDWI 183,146(1.662µm,1.314µm)
MSAVI 85,53(0.8167µm,0.6816µm)
Table 1: Spectral indices retained for outliers detection detection.
4. EXPERIMENTAL RESULTS
4.1 Simulated Data
A collection of synthetic labeled hyperspectral images of150×
150pixel size was generated representing six classes (Cowberry,
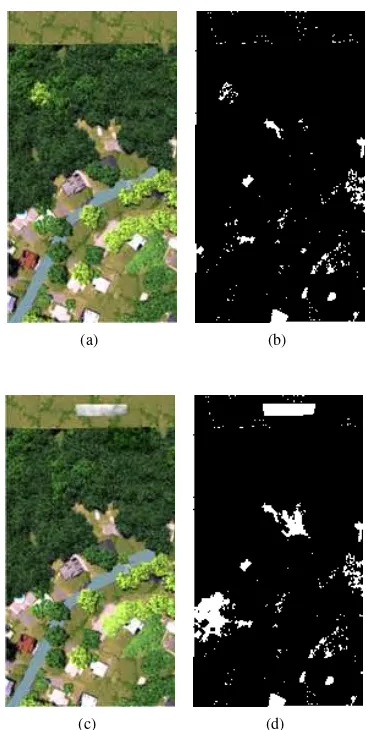
Spruces,Sparse Herbs,Bare Soil,WaterandUrban Area) that evolve over time. These images are a sample of the complexity in a real dataset, with many material classes of interest. The im-ages have10nmwidth in the reflected visible and near infrared spectrum(380−2500nm)and a spatial resolution of6m. The
similated images are illustrated by (figure 4.1 (a) and (c)). The experiment was performed on the synthetic data and the de-gree of detection is represented by the brightness value (figure 4.1 (b) and (s) respectively). The result show a good accuracy comparing to the associated ground truth.
(a) (b)
(c) (d)
Figure 2: Results of applying PA to the synthetic images.
4.2 Real Data
The airborne hyperspectral image was acquired in the vicinity of Baden, Switzerland. The study area (Figure 3) is on the banks
Figure 3: Study area, Baden, Switzerland
OSD data is provided along with ground truth information of 6 classes through a SPECCHIO spectral database (Kallepalli, 2014, Schaepman et al., 2015).
The proposed approach is compared with CODE and ISODepth algorithms. To better evaluate our approach, the receiver opera-tor characteristic (ROC) is generated by fluctuating the distance threshold. The area under the curve (AUC) is also chosen for ac-curacy assessment afterwards.
Table 4.2 illustrates the AUC results for proposed approach com-pared to the chosen baseline methods.
Algorithm Simulated data Real Data
PA(a) 0.917 0.747
PA(b) 0.915 0.852
CODE 0.865 0.754
ISODEPTH 0.858 0.798
Table 2: Comparing PA performance (AUC) with baseline meth-ods. PA(a):with Mahalanobis distance, PA(b):learned distance metric.
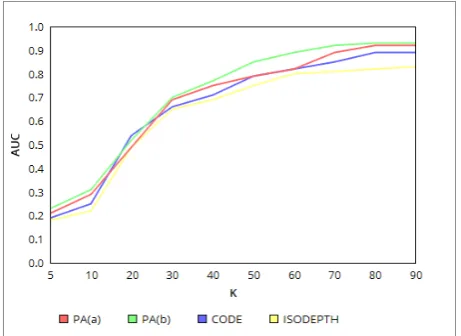
It can be remarked, that the proposed approach performs quite well compared to other techniques. It now remains the problem of interpretation of the outlier abnormality. Figure 4 shows the performance with different values ofk.
Figure 4: Comparing AUCs, k is the number of nearest-neighbors. PA(a):with Mahalanobis distance, PA(b):learned dis-tance metric.
Besides comparing the outlier detection accuracy, also the run time of the algorithms is an important factor to take into account. The mean execution time was taken using an Intel Xeon Nehalem processor. The proposed approach took21.7mson average and the reference method took28.0msto process the real data set. In general, all nearest-neighbor methods perform very similar since the worst case this algorithms is the nearest-neighbor search (O(n2
)). If mass function are computed beforehand, we noticed that the proposed approach is much faster than standard methods, especially on large data sets.
5. DISCUSSIONS AND FUTURE DIRECTIONS
The application of outlier detection algorithms finds its interest is several remote sensing applications. Outlier analysis has a tremendous scope for research, especially in the area of struc-tural and multivariate analysis. In this paper, we stated that the essence of all outlier detection algorithms is the creation of a den-sity, statistical or algorithmic model which describes the natural behavior of the data. The alterations from this model are consid-ered as outliers and must be interpreted to access the irregularity
causes.
We have also discussed the limited way in which the problem has been addressed in the literature. Hence, every unique problem formulation has a different specifications and requires an adapted approach, resulting in a large variety of algorithms. Each of this algorithms has been proposed to target a particular application domain. This survey can hopefully indicates some ways to map existing approaches to other application domains. We also con-cluded that a valuable domain-related knowledge of the data dis-tribution and model is often important in order to design efficient and accurate approaches which do not overfit the underlying data. When dealing with hypespectral images, the question of outlier detection becomes notably challenging. The main issues are the high dimentionnality, the significant relationships among pixels and the ralated uncertainty relative to class labels. Therefore, the modeling of learning set and the choice of an adaptable distance metric plays the key role in defining the outliers.
After outliers detection, the future direction of our work is to de-velop a knowledge-oriented process which must be investigated to access the sources of irregularity. This is done by giving a fruitful responses to the question : ”What are the causes of ab-normality?”. In fact, yet limit attention has been paid to the prob-lem of interpreting the abnormality causes; most related works focus on detecting and eliminating them. So, the main contribu-tion concerns the problem of discovering the set(s) of attributes that account for the abnormality belong to a class within a given land-cover type. It’s finding the minimal subset of features that explains the outlierness of a pixel, i.e., in which the pixel is still a doubtful observation. This will be achieved by proposing a knowledge discovery schema using the outlying subsets search algorithm for a class outlier (OSSA). This investigation can help the decision maker to restrain abnormality causes.
6. CONCLUSION
Outlier detection is an extremely fundamental issue with direct application in a wide variety of remote sensing fields. A prelim-inary notice observation with outlier detection is that it is not a well-explored and-formulated problem for remotely sensed im-ages. The proposed approach in this paper alleviates the draw-backs of the ”curse of dimensionality” on processing hyperspec-tral data where classical distance-based approaches often fail to afford better accuracy. Relative to the basic CODB algorithm, we proposed two contributions : a learning metric for distance com-puting which is more suitable for high-dimensional data sets, and a belief function for class label which is more suitable for par-tially learning problem and also for high-dimensional data. In a thorough evaluation, we demonstrate the effectiveness of our new approach to detect the right outliers with high precision and re-call. Furthermore, the evaluation discusses efficiency issues and explains the influence of the runtime.
REFERENCES
Agyemang, M., 2006. Web Content Outlier Mining: Motivation, Frame-work, and Algorithms. PhD thesis, Calgary, Alta., Canada, Canada. AAINR13617.
Alonso, M. and Malpica, J., 2009. The combination of three statistical methods for visual inspection of anomalies in hyperspectral imageries. In: Advances in Pattern Recognition, 2009. ICAPR ’09. Seventh Interna-tional Conference on, pp. 377–380.
Bakar, Z., Mohemad, R., Ahmad, A. and Deris, M., 2006. A comparative study for outlier detection techniques in data mining. In: Cybernetics and Intelligent Systems, 2006 IEEE Conference on, pp. 1–6.
Hemissi, S., Farah, I., Saheb Ettabaa, K. and Solaiman, B., 2012. A ro-bust evidential fisher discriminant for multi-temporal hyperspectral im-ages classification. In: Geoscience and Remote Sensing Symposium (IGARSS), 2012 IEEE International, pp. 4275–4278.
Hewahi, N. M. and Saad, M. K., 2007. International Journal of Computer, Control, Quantum and Information Engineering 1(9), pp. 2752 – 2765.
Hodge, V. and Austin, J., 2004. A survey of outlier detection methodolo-gies. Artificial Intelligence Review 22(2), pp. 85–126.
Kallepalli, A., 2014. Spectral and Spatial Indices based Specific Class Identification from Airborne Hyperspectral Data. PhD thesis, Enschede, The Netherlands.
Knorr, E. M. and Ng, R. T., 1998. Algorithms for mining distance-based outliers in large datasets. In: Proceedings of the 24rd International Con-ference on Very Large Data Bases, VLDB ’98, Morgan Kaufmann Pub-lishers Inc., pp. 392–403.
Knorr, E. M., Ng, R. T. and Tucakov, V., 2000. Distance-based outliers: Algorithms and applications. The VLDB Journal 8(3-4), pp. 237–253.
Konijn, R. and Kowalczyk, W., 2011. Finding fraud in health insur-ance data with two-layer outlier detection approach. In: A. Cuzzocrea and U. Dayal (eds), Data Warehousing and Knowledge Discovery, Lec-ture Notes in Computer Science, Vol. 6862, Springer Berlin Heidelberg, pp. 394–405.
Liu, Y., Gao, K., Wang, L. and Zhuang, Y., 2014. A hyperspectral anomaly detection algorithm based on orthogonal subspace projection. Vol. 9301, pp. 93012E–93012E–7.
me, E. C. E., Oukhellou, L., Denux, T. and Aknin, P., 2009. Learning from partially supervised data using mixture models and belief functions. Pattern Recognition 42(3), pp. 334 – 348.
Pasha, M. Z. and Umesh, N., 2013. Article: A comparative study on out-lier detection techniques. International Journal of Computer Applications 66(24), pp. 23–27. Full text available.
Schaepman, M. E., Jehle, M., Hueni, A., D’Odorico, P., Damm, A., Wey-ermann, J., Schneider, F. D., Laurent, V., Popp, C., Seidel, F. C., Lenhard, K., Gege, P., Kchler, C., Brazile, J., Kohler, P., Vos, L. D., Meuleman, K., Meynart, R., Schlpfer, D., Kneubhler, M. and Itten, K. I., 2015. Advanced radiometry measurements and earth science applications with the airborne prism experiment (apex). Remote Sensing of Environment 158(0), pp. 207 – 219.
Smetek, T. and Bauer, K., 2007. Finding hyperspectral anomalies using multivariate outlier detection. In: Aerospace Conference, 2007 IEEE, pp. 1–24.