INSTRUMENTS AND METHODOLOGIES FOR THE UNDERWATER TRIDIMENSIONAL
DIGITIZATION AND DATA MUSEALIZATION
L. Repola, R. Memmolo, D. Signoretti
Suor Orsola Benincasa University, via Suor Orsola 10, 80135, Napoli – [email protected]
Commission V
KEY WORDS: ScubaLibre, Survey, Tridimensional, Underwater, Archeology, Musealization, Computer vision, Stereoscopy
ABSTRACT:
In the research started within the SINAPSIS project of the Università degli Studi Suor Orsola Benincasa an underwater stereoscopic scanning aimed at surveying of submerged archaeological sites, integrable to standard systems for geomorphological detection of the coast, has been developed. The project involves the construction of hardware consisting of an aluminum frame supporting a pair of GoPro Hero Black Edition cameras and software for the production of point clouds and the initial processing of data.
The software has features for stereoscopic vision system calibration, reduction of noise and the of distortion of underwater captured images, searching for corresponding points of stereoscopic images using stereo-matching algorithms (dense and sparse), for points cloud generating and filtering.
Only after various calibration and survey tests carried out during the excavations envisaged in the project, the mastery of methods for an efficient acquisition of data has been achieved.
The current development of the system has allowed generation of portions of digital models of real submerged scenes. A semi-automatic procedure for global registration of partial models is under development as a useful aid for the study and musealization of sites.
INTRODUCTION
The experimentation about the employment of devices for tridimensional scanning and of dedicated softwares controlling machines and managing data is by now a permanent feature in the work of technologists, computer scientists and samplers.This kind of tools, be it laser, structured light or a software for image interpolation, in fact, permit to survey, with an accuracy to within one millimetre, tridimensional objects, whatever their forms and dimensions are, and to obtain digital models of the manufactures in the form of points – that we can describe as numerical-real since they correspond to the scanned objects with an accuracy to within one millimetre. Thus they are substantially different from the virtual models which are, instead, produced by bidimensional data, namely plane information developed in 3d.
The acquisitions through these new technologies do directly produce tridimensional information for a large amount of points which determine the totality of the surfaces of the object. The point clouds obtained, dynamically visible in real time, offer all of the spatial information concerning the manufacture, including their real image that, shoot with calibrated cameras, is associated with them as texture.
However, what has been said is true for emerged objects but can hardly ever be verified in subaquatic, submerged sites since the normal surveying operations conducted in a static environment are not reproducible in a dynamic environment: the different behaviour of light through liquids, the continual presence of interfering elements interposed between the equipment and the object, the variability of the clearness of the water and of the lightning conditions do reduce the quality of the data and their accuracy.
Nevertheless, the importance of the submerged objects and their large number, together with the difficulties connected to their detection, their study, monitoring and safeguard have made it necessary to find a surveying technique capable of applying to
them all the procedures followed for the emerged objects. Such a technique should be capable of producing numerical real models to be entered in an easily accessible database where to report the formal matrices (the geometry of DNA in order to recognize the objects when damaged or stolen), the global coordinates of the place of discovery, the textured models for a real time display (even in remote) of the object and for the reproduction of its copy through computer numerical control machines.
After careful consideration on these necessities, the University of Naples ‘Suor Orsola Benincasa’ started the project SINAPSIS, PON01_01063, financed by MIUR, which aims to the creation of an integrated system in favour of the valorization, use and safeguard of the cultural heritage both emerged and submerged through the development of innovative solutions integrated with the already existing technologies. Among its objectives Unisob had that of developing a tridimensional underwater scanning system, functioning through the elaboration of images, aimed at surveying the submerged archaeological sites and which could be integrated with the standard systems for the geomorphological surveying of the coasts.
1. HARDWARE
The hardware is composed of a supporting steel structure with two GoPro Hero Black Edition cameras arranged to guarantee the parallelism between the main axes (figure 1), and of a software which was to produce point clouds and to start processing data.
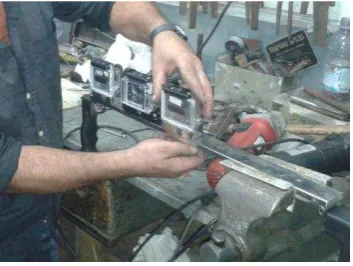
The project plan for the creation of the Scubalibre device has been arranged in various stages. They went from the preliminary ones, which included those of studying together with the software designers to decide on the final aims, and with the technicians involved in the progressive stages of testing as far as the previous prototype was concerned (subject of the preliminary control testing of the hardware and software system) (figure 2) up to the involvement of the operators who had to physically create the device, with whom were shared reflections on limitations and qualities of the device. In between there was the material planning stage, which included the virtual design and modeling and involved the use of dedicated instrumentation and software.
Figure 2. First prototype of ScubaLibre
The project stages saw the integration of various technologies for the acquisition of the correct dimension of every component: the protective suits for the cameras and the anchorage stirrups, the steel bar with its eyelets, the handles, the pivots. Especially as far as the protective suits and the bar were concerned, 3d data were acquired through optical triangulation scanners, from which polygonal models and NURBS were obtained. Then, thanks to reverse engineering processes, on these bases the anchorage stirrups and the steel components of the device were designed with a CAD modeling software. The construction methods of the Scubalibre were conform to the project plan and they can be considered a form of advanced craftwork. In fact, they comprehended both numerical control products and assembly work and manual adjustments (figure 3) necessary for the optimization of the device in its various configurations (figure 4).
Figure 3. Phase of assembly
First of all, the individual retaining blocks of the protective suits (both steel and plastic ones) were assembled, every single constituent part was modeled and welded and then fixed to its envelope.
Figure 4. Model from reverse engineering
Afterwards, a CAD design of the surface (obtained ‘unrolling’ the L-shaped support), was transferred to a numerical control unit which drilled it precisely in the expected spots.
2. SOFTWARE
2.1 Synchronization
In order to make Scubalibre flexible, we have chosen to synchronize the cameras with an acoustic signal, ensuring that there is no physical link between them. The first step for videos synchronization is delay estimation of the first video over the second, which is done through audio tracks analysis. From signal processing theory, cross-correlation represents the measure of similarity of two signals as a time shift function applied to one of them. For finite energy signals, and , the cross correlation is defined as
� = ∗ � = ∫+∞ ∗ � � + � �
−∞ (1)
where x and y are finite energy signals.
Similarly, in the case of discrete-time sequences, the cross correlation is defined as
� [ ] = ∗ [ ] = ∑�=+∞ [ ] [ + ]
�=−∞ (2)
Figure 5. audio signals cross-correlation
good estimate of the delay, it may often not be sufficient, due to audio-video delay. The causes of the AV delay, in this case, is due to an internal error synchronization. The purpose of the last step is the estimation of the delay in frame accuracy of the couple of video, and therefore we must omit the analysis of the audio and consider only the video. In order to obtain a precise estimate of this delay component, it is necessary to use images that have clearly recognizable and easily traceable points: for this reason, we have decided to use the calibration video. Finally, the delay between the two videos amounts to
� = � �� + � ������ (3)
2.2 Model Generation
The computational stereopsis is the process that allows you to obtain the depth information from a pair of images from two cameras filming a scene from different positions. It provides an articulated and complex branch of computer vision within which you can find generally two sub-problems:
the correspondences problem
the reconstruction of the 3D structure
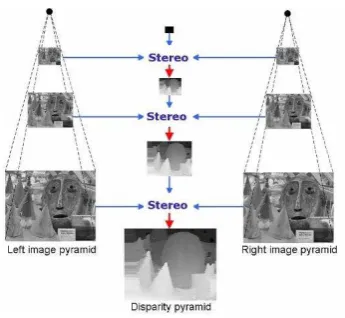
The first consists in coupling points in the two images. Coupling is possible by exploiting the fact that the two images differ only slightly, so that a particular scene appears "similar" in the two images. Once known couplings between the points of the two images and note the relative position of the cameras and the internal parameters of each sensor, it is possible to reconstruct the position of points in the scene projected on the two images. This process of reconstruction, however, requires the calibration of the stereoscopic system, i.e. the calculation of the internal parameters (intrinsic parameters) and the reciprocal position (extrinsic parameters) of the cameras.The solution to correspondences problem is a table, the disparity map, which contains information for associating, where possible, every point on the left image to a point in the right image. Uniqueness, smoothness, epipolar geometry, monotonic sorting, and other physical constraints are imposed to reduce the search space. Several techniques have been used to infer the value of the depth [1][2][3][4][5][6]. In this project, we have adopted a stereo matching algorithm that uses a coarse-to-fine strategy since it constitutes a good compromise between computational cost reduction and reliability of the results. The problem of correspondences requires comparing each pixel of the left image with each pixel in the right: that is, it performs an exhaustive search to achieve a good match. In our algorithm, we restricted the search space to a smaller range. To reduce the search range, each epipolar line uses the information obtained in the previuos step: to determine which pixels in the image on the right corresponds to a pixel in the left, disparity obtained at the previous level is used as starting point for the current estimation.
Figure 6. stereo correspondence algorithm
We adopt the above procedure for each level of the pyramid, and ends when the original images are processed. This approach has two advantages: a better estimate of the initial disparities and an increase in processing speed
STEP 1. Extracting pair of stereoscopic images STEP 2. Generating Gaussian pyramid
STEP 3. Disparity map computation at the lowest level (level 0) STEP 4. Calculation of the range of disparities for the level l + 1
STEP 5. Calculation disparities at level l + 1 from the range calculated to STEP 4.
STEP 6. If the pair of processed images is the original one, stop; otherwise return to STEP 4.
Table 1. stereo correspondence algorithm
2.3 Point Cloud Processing
The point cloud processing is illustrated in table 2.
STEP1. For each frame in frame collection do STEPs STEP2. Sample point cloud
STEP3. Extract featured from frame i STEP4. Extract features from frame i+ 1 STEP5. Project features in 3D space
STEP6. Find transformation between 3D corresponding points
STEP7. Initialize ICP with found transformation STEP8. Refine current transformation (ICP) STEP9. Accumulate point cloud using relative pose STEP10. Check for the loop closure
STEP11.Update the global pose using misclosure transformation from loop closure
Table 2. Point cloud processing pipeline
2.4 Point Cloud Sampling
2.5 Normal estimation
3D sensors scan surfaces by providing discrete sample points, usually with added noise. In this sampling process, information about the orientation and curvature of the surface is lost. Normal estimation has the purpose of restoring these values for each sample point by looking at its local neighborhood. The problem of determining the normal to a point on the surface is approximated by the problem of estimating the normal of a plane tangent to the surface, which in turn becomes a least-square plane fitting estimation problem. The solution for estimating the surface normal is therefore reduced to an analysis of the eigenvectors and eigenvalues (PCA) of a covariance neighborhood of �, �̅ represents the 3D centroid of the nearest neighbors, � is the j-th eigenvalue of the covariance matrix, and
� There are several features detector as corners detector (Moravec, Forstner, Harris, Shi-Tomasi, FAST) and blob with more than one feature in the first image. To decide which match to accept, the mutual consistency check can be used. This consists in pairing every feature in the second image with features in the first image. Only pairs of corresponding features that mutually have each other as a preferred match are accepted as correct.
2.7 Visual odometry
For the case of corresponding 3-D-to-3-D features, the camera motion � can be computed by determining the aligning transformation of the two 3-D feature sets. The general solution consists of finding the � that minimizes the distance between
To ensure that the displacement is calculated with accuracy, it is necessary that the outliers are removed. The idea behind RANSAC is to calculate different model hypotheses from a random points set, extracted from original points set, and then verify this model using all points of original set itself. The hypothesis that exhibits the best result, that is, the one with the
largest number of inliers, is taken as the solution of the problem. For the estimation of the relative displacement in two positions, the model is reduced to a roto-translation �, � , where � is rotation and � is translation.
STEP1. Let A be the set of 3D correspondences from one instant to another
STEP2-a. Select a random points set from A
STEP2-b. Use these correspondences to generate a model (R, t) STEP2-c. Calculate the distance of all the other points from this model
STEP2-d. Build the set of inliers (those points whose distance from the model is less than a certain threshold)
STEP2-e. If the maximum number of iterations has been reached go to step 3, otherwise go to step 2-a.
STEP3. The set with the greater number of inliers is chosen to build the solution to the problem
STEP4. Build the model using all the inliers
Table 3: inliers algorithm
2.9 Iterative closest point
A key advantage of pose estimation using visual features is that it can provide alignment without requiring initialization. The matching procedure is done after the feature extraction step with the aid of RANSAC for removing the outliers.The transformation obtained from visual odometry is then fed into the ICP as an initial guess to enhance the registration of point clouds. The idea behind ICP is to find the transformation that minimizes the sum of squared spatial error E(R,t) between associated points where R and t, are rotation and translation. It is necessary for ICP algorithm to not only have good initialization parameter, but also have enough overlap between frames. Otherwise, it may converge at an incorrect local minimum. Hence, the role of visual odometry for ICP initialization is critical. Moreover, maximum distance and rotation threshold �� , ��� are considered as an additional constrains to bound and weight ( ) the noise from visual odometry algorithm by replacing the current pose with the last pose obtained from previous frame, � � , � � .
2.10 Graph optimization
Employing incremental registration will lead to quick error accumulation, creating unacceptably erroneous maps only after a couple of hundred frames. Any error in the estimation of the transformation between a pair of two consecutive clouds will be passed on to all the subsequent clouds. This immediately leads to the idea of doing additional registrations between non-consecutive scans in order to correct for the precision of the absolute localization of each scan. These additional edges are meant to pull the track from drifting away, but the problem becomes overdetermined. This problem is often visually represented as a graph, where the nodes are the variables that needs to be solved for and the edges represent the constraints. Constraints between positions define the following cost function:
∑ ‖� − � � ‖ , (7)
Figure 7. pose graph without additional edge (1), pose graph with additional edges (2)
Ideally, to obtain good results, one would need as many edges in the pose graph as possible (maximum of N (N °1) edges, equivalent to having registered all the N frames against all the other frames in the sequence). Such an approach would make the computations intractable for longer sequences of clouds. A careful selection of the frames to be registered and the contents of the graph to be optimized needs to be done. Each frame is registered with its predecessor and the new edge is added to the graph if the registration was successful (i.e., converged). In order to reduce drift, as explained in the previous section, additional links between camera nodes have to be added. As a result, the concept of keyframes is introduced; an ordinary frame is considered a keyframe if it does not have sufficient correspondences with the other keyframes. This guarantees a uniform distribution of frames in the scene, such that most of the surfaces are covered, but the graph is not cluttered to ensure good optimization performance.
2.11 Loop closure
It refers to robustly determining when the current view of the scene exposes parts that have been seen before in the sequence and allows for a re-alignment between selected frames such that all the errors that have been accumulated are relaxed
Figure 8. pose graph without loop detected (1); pose graph with loop detected (2)
2.12 Case study: LIPARI
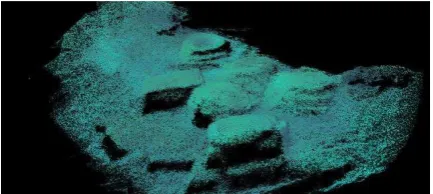
The first test on field has been conducted at the ancient Roman port of Lipari – in collaboration with the Superintendence for the Sea of Sicily and Professor Sebastiano Tusa – where performance has been evaluated. The developed software has three main functions: synch videos, build RGB-D by stereo images analysis and perform global registration by visual odometry, pose graph optimization and loop detection. Figures 9 and 10 show single RGB-D frame of the scene. Figures 14,15, show complete reconstruction without pose optimization and loop detection. Figures 11,12,13 show complete model created after pose optimization and loop detection.
Figure 9. Lipari particular RGB-D (1)
Figure 10. Lipari particular RGB-D (2)
Figure 11. Lipari after global registration (1)
Figure 12. Lipari after global registration (2)
Figure 14. Lipari without global registration
Figure 15. Lipari without global registration
3. PROCEDURES OF ACQUISITION
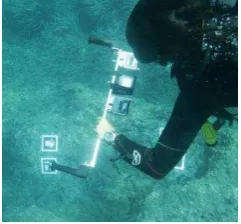
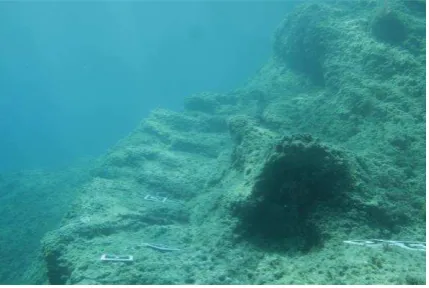
The conception and development of the hardware and software components has been improved through a series of underwater checks of the device carried out both during institutional campaigns with educational aims – of this kind were the missions conducted in the Gulf of Genito, around the isle of Vivara-Procida (Figure 16), together with the technicians from the STASS of the Ministry for Cultural Heritage and Cultural Activities, to acquire data about prehistoric settlements and around Cala Gadir, Pantelleria (Figure 17) and in the harbour of Lipari (Figures 9-15), in collaboration with the Superintendence for the Sea of Sicily and Professor Sebastiano Tusa, to acquire data about architectonic structures from the Roman era; together with these missions formative activities took place within the SINAPSIS project which consisted in two Second-level Professional Master's Programmes Beni Archeologici reali e virtuali tra mare e terra and Digital Cultural Heritage – Nuove tecnologie per la valorizzazione e il management del Patrimonio Culturale – and through tests organized to acquire objects of known shape and dimension which were to verify calculation algorithms along with the most possible adequate procedure to employ the system in different contexts and to prove the correspondence between models and real geometry.
Figure 16. Prehistoric scale, Gulf of Genito, Vivara-Procida
Figure 17. Roman remains of CalaGadir, Pantelleria
More specifically, the actual configuration of the device required a series of procedures for the preliminary calibration of the system and of the cameras, consisting in the underwater shooting of an aluminium chessboard measuring 60x42cm, with squares of 6cm. The vertices of the boxes do constitute the calibration points (Figure 18). To make the surveying system function, it is essential to know the matrix of projection and to provide this datum to the device which, full knowing the intrinsic parameters that describe the inner geometry and the optical characteristic of the camera, and the extrinsic parameters that refer to the position and the orientation of the camera coordinate system when compared to the physical world, can operate and measure distances. The calibration of the two cameras also permits the calculation of their geometric relation in space and, thanks to this datum, allows the correction of images to make them appear as if they were taken from a system with two perfectly aligned cameras with a punctual parallelism between their optical axes.
Figure 18 Procedures of calibration
During the calibration, the movements for the shooting– accurately tested over a long period on the basis of progressive verifications of the dimensions of the real objects scanned compared to the numerical-real models obtained – are made evaluating distances and positions from which it is possible to fulfill two main requirements, of fundamental importance to achieve the goal: the first one is to have at one's disposal images of the aim from different angle shots, the second one is to have at one's disposal a certain number of images, enough to deduce from them the value of the above mentioned parameters. It is useful to follow this procedure every time that there is an intervention on the cameras and that they are extracted from their protective suits.
The scanning procedures have been considered an extremely important matter for which it is necessary to coordinate the underwater balance of the operator with its tools with the device, neutralized to the purpose.
1. A preliminary study of the trajectories to be followed, taking into consideration the environmental conditions, the geometries and the dimensions of the objects and the surfaces that are to be shoot. This is a teamwork stage and it involves an inspection of the area, on the spot or through the analysis of the images depicting it. In particularly complex cases the images are imported to a CAD programme. They are thus vectored and transformed into illustrative tridimensional models, where the possible trajectories can be represented through polygons. To the latter, which are, in turn, imported to animation software, the surfaces that have to be shoot, taking into consideration the actual lighting conditions, the water transparency, the geometrical complexity of the objects to be shoot, especially in the case that these are composed of planes laying at different heights.
3. A determination of the gradient of the device in regard to the planes to be surveyed. This aspect is of great importance as far as the procedure of data processing and of the alignment of the point clouds associated with the different shooting positions are concerned. The trials run for the determination of a correct range of grade for the scanner have showed that this parameter has to be verified considering the lighting conditions and the planes which dominate the framed scene, paying particular attention to the relation between the objects that have to be scanned and the sea bottom.
The cameras of the device have been configured, at the end of the trials, so that they could focus in the best possible way surfaces at a distance of about three metres, a value considered optimal on the basis of the average water transparence and sea water lighting at a depth of 10m. This limits the dimensions of the area that can be framed to a maximum of 2.5m per side, variable depending on the shape of the scanned planes. To frame objects wider than 2.5m it is thus necessary to shoot them more than once, and to make sure that the framing have a common portion (to an extension of about 30% of the models) so that an alignment of the diverse parts is possible through corresponding points. It must also be considered that, due to the typical distortion of the peripheral areas of the framing, significant portions of the scene, the ones in the margins, will be lost and just the central part of the image will be apt for the processing. For this reason it is essential to focus, while shooting, on the surfaces that have to be framed.
The difficulties in acquiring data have been connected to the continuous variations as far as the sea environment is concerned, especially due to the lighting of the objects and the mucilage. To test the prototype in many different conditions dives have been done at several depths between minus 1 and minus 19 metres, at various hours of the day. The precautionary measures adopted, which are still to be optimized, were of two different kinds: the first ones were aimed at the variation of the default settings of the cameras to intervene on their levels of definition, while the second ones had the objective of controlling the variation of the environmental conditions. This has led to various trials concerning the illumination of the sea bottom, which involved the use of many different lamps and their different positioning against both the surfaces to be framed and the device, and to shooting trials during which the cameras were inclined against the planes within a 30° range gradation. The determination of the correct range for the inclination of the scanner is to be considered in relation to the lighting conditions and to the dominant planes and the framed scene, with particular reference to the relation between the objects that have to be scanned and the sea bottom. From the trials it is clear that the best results have been obtained with images captured when
the axis of shooting was perpendicular to the plane of the scanned surface. In the case of a particularly complex object the angle shot and the point of views from which the scanning process takes place are crucial, since the scanner, just like a camera, only surveys what it does ‘see’. For this very reason it is necessary to shoot more than once, intersecting different points of view and making full use of every viewing angle. Lastly, it is useful to guarantee a continuity in the shooting trajectories and to avoid sudden changes in the paths or interruption between the ‘strip-runs’, to ensure a continuity and thus an evident correlation between the points from adjoining images.
Further tests have examined the possibility of using markers in the phase of the acquisition of the images. The presence of these elements positioned on the sea bottom during the early phases of the immersions, distant about one metre one from another in correspondence to the surfaces that have to be shooted, is not only useful in the phase of the data elaboration, but also gives valid points of reference as far as the trajectory of the acquiring process is concerned. tridimensional data in augmented and immersive environments allow to conceive new forms of musealization where to render both the manufactures and their contexts for an active fruition.
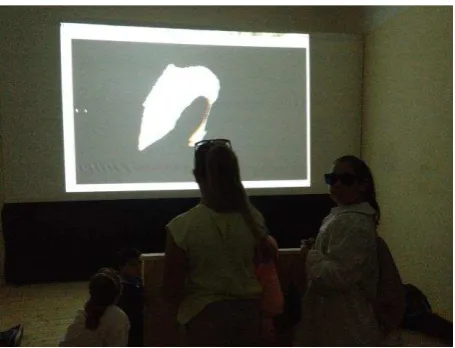
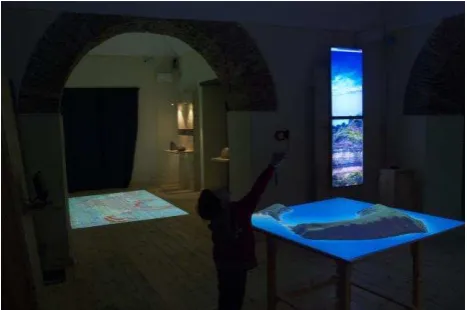
This is of particular importance in regard to the submerged cultural heritage, whose fruition is not usually possible despite the huge value it has in many cases, especially if it is safeguarded in loco, taking into consideration the context in which the discovery took place. The system we presented allows the extremely accurate production of 3d digital textured copies of cultural heritage and submerged scenaries which prove to be an essential aid for new forms of their safeguard and musealization. This is what has been realized in the exhibition area called TERRA – Terra Murata – in Procida. In the rooms on the ground floor of what it used to be the Conservatorio delle Orfanelle, now Palazzo della Cultura, a system for the combined communication of the results in the technological and archaeological fields has been realized and, through the use of low-cost devices, the data collected during both the excavations and the researching processes on land and underwater have been interactively musealized. In the exhibition area floor projections, 3d projection mapping on real models obtained from a tridimensional milling, interactive contents on screens furnished with infrared film, interactive stereoscopic projections of the submerged archaeological discoveries and designated positions for the fruition of the numerical-real models scanned with TOF scanners by Riegl have been inserted in order to experiment a widespread use of scientific data with educational and communicative aims, thus making the goods which are object of study an instrument to promote tourism and to spread culture.
Figure 21. Video projection mapping on model produced by tridimensional milling
This methodology for the research, the analysis and the promotion of cultural heritage had the aim to verify the outcomes of a common development in the fields of applied technologies and archaeology, where procedures and devices have determined a common strategy to produce data and to use them for new forms of communication.
REFERENCES
Adorno, G. C. 1965. Progetto e destino. Il Saggiatore, Milano. Adorno, G. C. 1970. L’arte moderna. Sansoni, Firenze.
Antinucci, F. 2004. Comunicare nel museo. Editori Laterza,.Bari.
Antinucci, F. 2007. Musei virtuali. Editori Laterza, Bari. Auriemma, E. 2007. Animazione e interazione nella rappresentazione digitale.Gangemi, Roma.
Berenson, B. 1948. Estetica, etica, e storia nelle arti della rappresentazione visiva. Electa, Firenze.
Bleyer, M. and Gelautz, M. 2005. A layered stereo matching algorithm using image segmentation and global visibility constraints. ISPRS Journal of Photogrammetry and Remote Sensing 59(3):128–150.
Capone, M. 2011. Virtual Cultural Heritage. Nuovi codici comunicativi per la fruizione dei beni culturali. La scuola di Pitagora, Napoli.
Deleuze, G. 1997. Differenza e ripetizione. Raffaello Cortina Editore, Milano.
Di Stefano, L., Marchionni, M. and Mattoccia, S. 2004. A fast area-based stereo matching algorithm. Image and Vision Computing 22(12):983–1005.
Forte, M. 1996. Archeologia. Percorsi virtuali nelle civiltà scomparse. Mondadori, Milano.
Hong, L. and Chen, G. 2004. Segment-based stereo matching using graph cuts. Proceedings of IEEE Computer Society Conference on Computer Vision and Pattern Recognition 1:74– 81.
Levy, P. 1997. Il virtuale. Raffaello Cortina Editore, Milano. Maldonato, T. 1993. Reale e virtuale. Feltrinelli, Milano. Murray, D. and Jennings C. 1997. Stereo vision based mapping and navigation for mobile robots. Proceedings of IEEE International Conference on Robotics and Automation 2:1694– 1699.
Repola, L. 2008. Architettura e Variazione attraverso Gilles Deleuze. Napoli, Istituto Italiano per gli Studi Filosofici. Unali, M. 2008. Abitare Virtuale significa rappresentare. Edizioni Kappa, Roma.
Veksler, O. 2006. Reducing search space for stereo correspondence with graph cuts. Proceedings of British Machine Vision Conference 2:709–718.
Yang, Q., Wang, L. and Yang, R. 2006. Real-time Global Stereo Matching Using Hierarchical Belief Propagation. Proceedings of British Machine Vision Conference 3:989–998.