Soil moisture evaluation using multi-temporal synthetic
aperture radar (SAR) in semiarid rangeland
M. Susan Moran
a,∗, Daniel C. Hymer
b, Jiaguo Qi
c, Edson E. Sano
d aUSDA Agricultural Research Service, US Water Conservation Laboratory, Phoenix, AZ 85719-1596, USAbNASA Goddard Space Flight Center, Greenbelt, MD, USA cMichigan State University, East Lansing, MI, USA
dEMBRAPA/CPAC, Planaltima, DF Brazil
Abstract
There have been several efforts to utilize satellite-based synthetic aperture radar (SAR) measurements to determine surface soil moisture (to 5 cm) conditions of rangeland regions. The results have been mixed since the relation between the SAR signal and surface soil moisture is confounded by variations in topographic features, surface roughness and vegetation density. We designed an experiment to investigate the sensitivity of C-band SAR backscatter (σ0) to surface soil moisture (θs) in a semiarid rangeland and to test a data-fusion approach based on both optical (Landsat TM) and radar (ERS-2 SAR) measurements to improve regional estimates of surface soil moisture content. The data-fusion approach [Sano, E.E. 1997. Sensitivity analysis of C- and Ku-band synthetic aperture radar data to soil moisture content in a semiarid regions. Ph.D. Dissertation. University of Arizona, AZ] utilized the difference between dry- and wet-season SARσ0to normalize roughness effects, and utilized surface reflectance in optical wavelengths to account for differences in vegetation density. We focused the study on three flat, uniformly vegetated sites of known surface roughness, monitored variations in surface soil moisture, vegetation density and SAR signal over time, and obtained eight optical/SAR image pairs throughout the dry and wet seasons. For these sparsely vegetated sites during this dry year (1997), we found that the SAR signal was not significantly attenuated by sparse green vegetation cover (green leaf area index<0.35) and dense standing brown vegetation cover (brown leaf area index up to 1.5). Consequently, the optical data was not required for this application, and the approach could be implemented by simply taking the difference between the dry- and wet-season SARσ0(σ0−σdry0 ). For a data set of eight dates at three study sites, we confirmed that the relation between ERS-2 C-band SARσ0andθswas weak (r2=0.27); yet for the same data set, that the relation betweenσ0−σdry0 andθswas strong and significant (r2=0.93). This study also raised two concerns: (1) the overall sensitivity of SARσ0toθswas relatively low, and (2) the approach required a high level of accuracy in the estimate of green leaf area level that may not be obtainable with standard optical remote sensing algorithms. In any case, the positive results from this study should encourage the use of a multi-temporal SAR and optical/SAR fusion for monitoring semiarid range conditions, and improving management of scarce resources. Published by Elsevier Science B.V.
Keywords: Soil moisture; Synthetic aperture radar; Semiarid rangeland
∗Corresponding author. Tel.:+1-520-670-4381, ext: 171;
fax:+1-520-670-5550.
E-mail address: [email protected] (M. Susan Moran).
1. Introduction
Knowledge of distributed surface soil moisture content (∼5 cm depth) is important for many hydro-logic applications including mapping rainfall events,
monitoring differential drying patterns, and assessing water availability for plant growth. Surface soil mois-ture can also be used to parameterize soil water simu-lation models that estimate soil moisture content with depth in the plant rooting zone (e.g., Hymer et al., 2000). Though the demand for distributed surface soil moisture information is high, the means for obtaining such information are few. Conventional measure-ment techniques (e.g., gravimetric and time-domain reflectometry (TDR)) are generally point-based, and require on-site operators and tedious post-processing. Such sensor attributes are not conducive to measure-ment of regional surface soil moisture conditions on a frequent basis.
There is some evidence that satellite-based syn-thetic aperture radar (SAR) sensors could provide a regional assessment of surface volumetric soil mois-ture content (θs) (Engman and Chauhan, 1995).
The-oretically, SAR backscatter (σ0) detected by orbiting satellite-based sensors is directly related to the target dielectric constant (ǫ′), where ǫ′ is the real part of a complex parameter that describes the electrical prop-erties of a medium relative to the dielectric constant of “free space”. For water,ǫ′∼=80; for dry soil,ǫ′ ∼=2. Consequently, an increase in soil moisture content changes ǫ′ markedly, and results in a strong sensi-tivity of the SAR signal toθs. In practice,σ0is also highly influenced by topographic features, vegetation density, and variations in small-scale surface rough-ness. For an agricultural test site, Wang et al. (1986) reported that L-band σ0 was strongly dependent on
θs and surface roughness, and to a lesser extent, on
vegetation cover. And in most cases, the range of
σ0 response to variations in surface soil moisture is equal to the range of σ0 response to variations in surface roughness of natural surfaces. Thus, it is a difficult task to convert single-channel SAR images directly into maps of regional θs for heterogeneous terrain.
Most reviews on this topic suggest that surface soil moisture could be retrieved with sufficient accuracy from a system providing two or more polarizations of a single frequency such as L-band SAR (e.g., Ulaby et al., 1996). Unfortunately, all currently or-biting satellite SAR sensors are single-polarization, single-frequency systems. Alternatively, several stud-ies have suggested that the accuracy of SAR-based
θs estimates could be improved by combining data
from optical sensors (e.g., surface reflectance and temperature) to discriminate the SAR signal response to vegetation (Moran et al., 1997).
In this project, we designed an experiment to study the link between SAR backscatter and surface soil moisture using the European remote sensing (ERS-2) SAR sensor (C-band (5.35 GHz), VV polarization and 23◦ incidence angle). To minimize the influence of other conditions, we focused our study on flat, uni-formly vegetated sites, and monitored the variations in surface soil moisture and vegetation cover over time. By choosing flat sites, we avoided the effects of topography, and by monitoring the sites over time (rather than multiple sites over space), we minimized the influence of variations in small-scale roughness conditions. Furthermore, by measuring vegetation density on a monthly basis at each site, we were able to quantify changes in vegetation that might influence SARσ0.
In addition, we ordered an image from a satellite-based optical sensor concurrent with each SAR scene acquisition. Images were obtained from the Landsat thematic mapper (TM) sensor which measures surface reflected radiance in six wavelengths (from 0.45 to 2.35mm) and measures surface temperature in a single spectral waveband covering 10.42–11.66mm. Due to orbital constraints, the Landsat TM scenes were gen-erally acquired within 0–7 days of the ERS-2 SAR acquisition.
The objectives of this work were to:
1. investigate the sensitivity of C-band SAR σ0 to surface soil moisture content (to 5 cm) in a semiarid rangeland with sparse vegetation cover, and 2. test an approach based on both optical (Landsat
TM) and radar (ERS-2 SAR) measurements to im-prove regional estimates of surface soil moisture content.
2. Approach
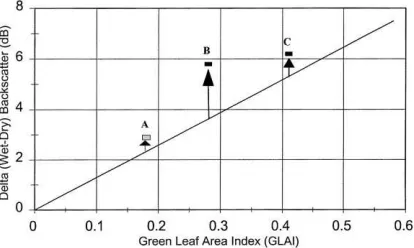
Fig. 1. A graphic illustration of the SAR/optical approach for evaluating surface soil moisture developed by Sano (1997). The vertical distance of points A–C from the solid line is related directly to soil moisture content.
in a semiarid region. In this approach, the effects of soil roughness were taken into account by taking the difference between the SAR backscatter from a given image and the backscatter from a “dry season” image (σ0−σdry0 ). The vegetation influence was corrected by using an empirical relationship betweenσ0−σdry0
and green leaf area index (GLAI), where GLAI is green leaf area divided by corresponding ground area. GLAI was derived using an operational approach based on a radiation model and measured reflectance in the red and near-infrared spectrum (Qi et al., 2000). This approach is illustrated hypothetically in Fig. 1. Sano (1997) found that the vertical distance between a given point and the line defining the (σ0−σdry0 )/GLAI relation was independent of surface roughness and vegetation density, and directly related to the surface soil moisture content of the site. This relation was found to be linear for low values of GLAI (GLAI<
0.6) as shown by Ulaby et al. (1984) in their Figs. 10 and 11. Furthermore, a given relation, as illustrated in Fig. 1, would be valid only for a single SAR config-uration (e.g., sensor polarization and frequency) and would need to be adjusted for the influence of topogra-phy on local incidence angle. In Fig. 1, though the val-ues ofσ0−σdry0 for points A–C increase from A (2 dB) to B (5 dB) to C (6 dB), the surface soil moisture con-ditions are related to the length of the vertical arrow; thus, the surface soil moisture content of B is greatest and A least, with C intermediate. Sano et al. (1998) reported that this approach worked well for estimating surface soil moisture conditions for sparsely vegetated (GLAI<1), semiarid sites in Arizona. However, they
admitted that validation of this approach was ques-tionable because the small number of soil moisture samples (three per site) did not properly characterize each site.
3. Experiment
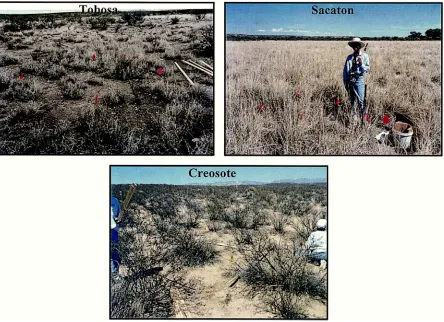
Three sites were chosen in the Upper San Pedro River Basin (USPB) in southeast Arizona for inves-tigation of the SAR/optical approach for monitoring surface soil moisture content. The sites were charac-terized by level terrain and uniform vegetation cover (over a 300 m×300 m area), and were named by the dominant vegetation type: Tobosa, Sacaton and Cre-osote (Fig. 2). The Tobosa site was located in a swale which supports a mix of Tobosa grass (Hilaria mutica) and Creosote (Larrea tridentata) shrubs. The Saca-ton site was dominated by big SacaSaca-ton (Sporobolus
wrightii) with some Tobosa grass. The Creosote site
was on a flat mesa and is characterized by scattered Creosote shrubs (L. tridentata) with very few grasses or annual forbs. The soils in this region are a very gravelly sandy loam.
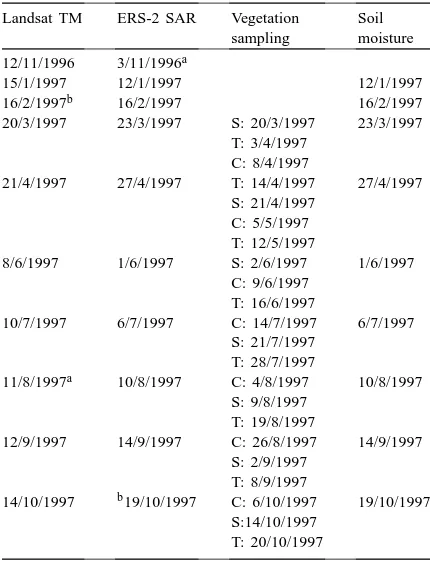
In this study, we requested 10 ERS-2 SAR scenes covering our study sites during late 1996 and through-out 1997. The dates of these overpasses were selected to correspond closely with the dates of overpasses of the Landsat-5 satellite (Table 1). In southeast Arizona, the majority of the precipitation is in late July and August, resulting in maximum vegetation greenness in August and September. Thus, the experiment was designed to continue through October 1997, when the vegetation had passed maximum density and was beginning to senesce.
3.1. Field measurements
Fig. 2. Photographs of the three experimental sites in the USPB in southeast Arizona, named by the dominant vegetation type: Tobosa (H.
mutica), Sacaton (S. wrightii), and Creosote (L. tridentata).
We also measured vegetation cover, biomass, height, and leaf area every 3 weeks to record seasonal changes. At each site, destructive samples of green and brown vegetation were made within seven system-atically selected 1 m2quadrats within the 90 m×90 m target area. Based on these samples, GLAI and brown leaf area index (BLAI), respectively) were measured in the laboratory using a LICOR LI3000 leaf area meter. Just prior to destructive sampling, the total plant area index (TPAI) was measured in situ using a LICOR LAI2000 plant canopy analyzer. A distinction is made here between GLAI, BLAI and TPAI: GLAI is an index of only green vegetation, BLAI is an in-dex of only dead, standing vegetation, and TPAI is an index of all standing live and dead vegetation. Note that the approach developed by Sano (1997) is based on the SAR signal attenuation by GLAI (Fig. 1). For
this study during the period from January through July, GLAI was near zero, i.e., BLAI=TPAI and both were composed largely of standing, dry grasses and desiccated Creosote shrubs.
Table 1
Dates of acquisitions of Landsat TM and ERS-2 SAR image pairs and dates of collection of supporting data at the Sacaton (S), Tobosa (T) and Creosote (C) sites
Landsat TM ERS-2 SAR Vegetation sampling
20/3/1997 23/3/1997 S: 20/3/1997 23/3/1997 T: 3/4/1997
C: 8/4/1997
21/4/1997 27/4/1997 T: 14/4/1997 27/4/1997 S: 21/4/1997
C: 5/5/1997 T: 12/5/1997
8/6/1997 1/6/1997 S: 2/6/1997 1/6/1997 C: 9/6/1997
T: 16/6/1997
10/7/1997 6/7/1997 C: 14/7/1997 6/7/1997 S: 21/7/1997
T: 28/7/1997
11/8/1997a 10/8/1997 C: 4/8/1997 10/8/1997 S: 9/8/1997
T: 19/8/1997
12/9/1997 14/9/1997 C: 26/8/1997 14/9/1997 S: 2/9/1997
T: 8/9/1997
14/10/1997 b19/10/1997 C: 6/10/1997 19/10/1997 S:14/10/1997
T: 20/10/1997 aOrdered but not acquired.
bField sites occluded by clouds.
changes between the measurement points. Individual lines were digitized using a Geographic Information System software package (Arc/Info) to derive the root mean squared (RMS) height, termed the roughness value. Data presented in Table 2 represent the average roughness value (cm) for the Sacaton and Creosote sites (data for the Tobosa site were not included since it was not covered by the imagery).
Table 2
Average surface soil roughness values for the Sacaton and Creosote sites. Separate measurements in the interspace and under Creosote cover were taken into account for discrete roughness changes between measurement points
Site Roughness value (cm)
Sacaton 0.53±0.15
Creosote (interspace) 0.55±0.23 Creosote (under shrub) 1.68±0.56
During each TM overpass, we visited the sites and made measurements of surface reflectance and tem-perature over large areas for comparison with the TM measurements. We also deployed a solar radiometer and arranged for the launch of a radiosonde bal-loon to measure atmospheric conditions for eventual atmospheric correction of the TM image to obtain estimates of surface reflectance and temperature. On several occasions, we deployed a radiometer aboard a small aircraft to measure surface reflectance and temperature at fine resolution (1–2 m) to provide us with local estimates of vegetation vigor for validation of our satellite-based analysis (Goodrich et al., 2000).
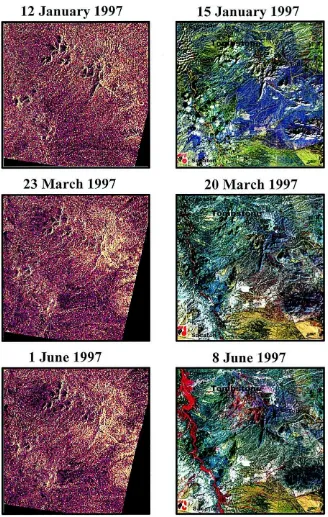
3.2. Image acquisition and processing
A temporal series of ERS-2 SAR images was obtai-ned covering our study area in southeast Arizona (Fig. 3). We used the standard, calibrated amplitude images provided by the European Space Agency (ESA) processed as 3-looks (reduced noise) with ground resolution of 12.5 m ×12.5 m. The digital numbers (DNs) were converted to a backscattering coefficient expressed in decibel using the SAR cali-bration coefficient (Tom Lukowski, Canadian Centre for Remote Sensing, personal communication). Values of C-bandσ0 within a 7×7 pixel window were av-eraged to one value for each of the three 90 m×90 m field targets. This averaging process minimized the effects of the characteristic SAR image “speckle” due to multiple within-pixel scatterers. It is notable in Fig. 3 that the image coverage shifted to the west after the January scene, and to our misfortune, the images no longer included the Tobosa site. Furthermore, on some dates (scenes acquired in April and September), the scene was shifted north such that the Sacaton site was not included.
NDVI=ρNIR−ρRed ρNIR+ρRed
(1)
whereρNIRandρRedare near-infrared and red
reflec-tance factors derived from TM DN using measureme-nts of atmospheric conditions and earth–sun geometry (Moran et al., 1995). A regression process and fuzzy neural system were used to find the best-fit equation (linear, exponential, power and polynomial) between image-derived GLAI and NDVI. The purpose of this step was to reduce the computing time and to remove some outliers due to model convergence failure or ex-ternal noise. For this region, the optimal equation for converting NDVI to GLAI was determined to be
GLAI=18.999NDVI3−15.240NDVI2
+6.124NDVI−0.3520 (2)
Qi et al. (2000) validated this approach with ground-based measurements and reported that GLAI measurements could be obtained with high accuracy. For the three experimental sites in this study, values of TM-derived GLAI were extracted from a 3×3 pixel window covering 90 m×90 m within each site, and averaged to one value per site per date.
4. Results
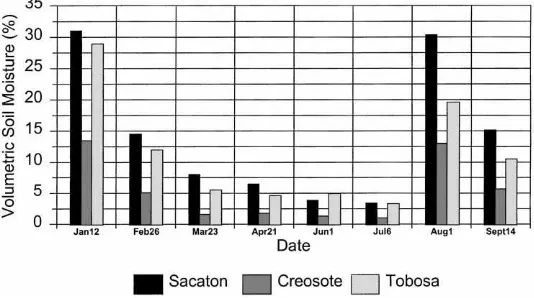
Due to favorable weather conditions, we obtained a wide range of surface soil moisture conditions for our study (see Fig. 4 and notes in Table 3). An unusual January snowstorm, followed by several days of hot
Fig. 4. Range of surface volumetric soil moisture conditions over the temporal and spatial range of this study.
sunny weather, resulted in regional soil moisture con-ditions near field capacity. February rains resulted in moist, variable soil conditions. A drying trend contin-ued through March and April; in June and July, soil conditions at all sites were very dry. Summer rain-storms preceded the August and September overpasses resulting in moist soil conditions, and in October, soil conditions were again dry.
During the July SAR overpass, the soil moisture conditions at all sites were extremely dry, and the late summer greenup of the vegetation had not yet oc-curred. Consequently, we designated it as the “dry” scene and subtracted the July SAR backscatter (σdry0 ) from the backscatter measured on the January, March, April, June, August and September dates to account for the contribution of surface roughness to the SAR signal.
Table 3
Surface (5 cm) volumetric soil moisture content (%) in 1997 at three sites in the USPB, Arizona Date Volumetric soil moisture (m3/m3) Notes
Sacaton Creosote Tobosa
12/1/1997 28.2±5.1 9.0±1.4 19.3±6.1 It snowed in early January, and the snow had melted by the time of the ERS-2 overpass. Thus, the soil conditions were near field-capacity throughout the region.
16/2/1997 13.2±5.7 3.4±0.9 8.0±3.8 It rained several times in February, resulting in moist soil conditions. 23/3/1997 7.3±4.3 1.1±0.8 3.7±1.1 There was minimal rain in March and April, and the soil conditions were
moderately dry. 27/4/1997 5.9±2.2 1.2±0.8 3.1±1.5
1/6/1997 3.5±1.3 0.9±0.2 3.3±1.1 During the hot months of June and July, the soil at all sites was very dry, the grass was brown, and no annuals were present.
6/7/1997 3.1±1.1 0.7±0.2 2.2±0.6
10/8/1997 27.6±7.3 8.7±1.7 13.1±7.5 A large storm preceded the August overpass, resulting in high soil moisture conditions in combination with peak vegetation greenness.
14/9/1997 13.8±5.0 3.8±1.1 7.0±2.6 A small storm preceded the September overpass.
19/10/1997 5.8±2.6 1.2±0.3 3.4±1.5 The soil conditions were dry and the vegetation was senescent.
period, there was no significant change in site TPAI. In summary, for the period from January through July, the TPAI was primarily a measure of dry, standing biomass which differed from site to site, but not from date to date.
We investigated the influence of standing dry biomass on the SAR σ0 by deriving a relation be-tweenσ0−σdry0 and TPAI for the June overpass at the Creosote and Sacaton sites (recall that due to an or-bital shift, the Tobosa site was not included in images after January). Based on these two points, there was no significant variation in σ0−σdry0 associated with the measured variation in TPAI at the two sites. Our conclusion was that the differences in standing brown vegetation biomass at these two sites were accounted
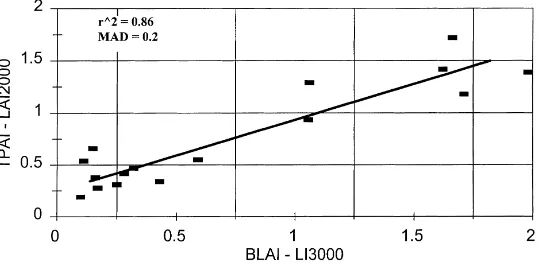
Fig. 5. Comparison of the TPAI estimated in situ with the LAI2000 plant canopy analyzer and the BLAI measured in the laboratory with the LI3100 leaf area meter for all sites and all dates. The solid line is the best-fit regression line with a correlation coefficientr2=0.86. The mean absolute difference (MAD) between the two measurements was 0.2.
for in the roughness correction. Consequently, for the dry season, the values ofσ0−σdry0 would be directly related to surface soil moisture conditions at the site, with no need for a vegetation-related correction.
Fig. 6. GLAI in September 1997 at the three field sites (Creosote, Sacaton and Tobosa) measured in the laboratory using the LI3000, and derived from the Landsat TM images.
samples were taken from multiple 2 m×2 m plots) or to the errors inherent in the derivation of Eq. (2), as discussed by Qi et al. (2000). Assuming that the lab-oratory GLAI measurements were the more accurate of the two GLAI estimates, then according to the re-lation presented in Fig. 1, the values ofσ0−σdry0 for this season did not require a correction for vegetation attenuation of the SAR signal. Thus, for these biomes during the 1997 growing season, values ofσ0−σdry0
would be directly related to surface volumetric soil moisture. This premise was supported by the follow-ing results.
As expected, results showed that measurements of C-band SAR backscatter (σ0, dB) were poorly corre-lated (r2 =0.27) with surface soil moisture content
Fig. 7. The relation between C-band SAR backscatter and surface (5 cm) soil moisture content for three sites (labeled S (Sacaton), C (Creosote) and T (Tobosa)) and six dates in January, March, April, June, August and September.
(θs) at the three field sites (Fig. 7). Theoretically, this
poor correlation was due to differences in surface roughness at the three sites (Table 2). Comparing the Creosote and Sacaton sites, the greater RMS rough-ness resulted in a generally higher SARσ0for the Cre-osote site than for the Sacaton site (Fig. 7). The data were subsequently corrected for differences in surface roughness and standing brown vegetation biomass by taking the difference between the SAR backscatter from a given image and the backscatter from the dry season image (July). This correction resulted in a good correlation (r2 =0.93) betweenσ0−σdry0 and
θs (Fig. 8). On the other hand, there was a general
insensitivity of SARσ0−σdry0 to low soil moisture conditions. That is, forθsfrom 0.07 to 0.20,σ0−σdry0
Fig. 8. Same as Fig. 7, except the SAR backscatter was normalized for differences in surface roughness by subtracting the July SAR backscatter signal from the backscatter signal of the other dates. The solid line is the best-fit regression line with a correlation coefficient
r2=0.93.
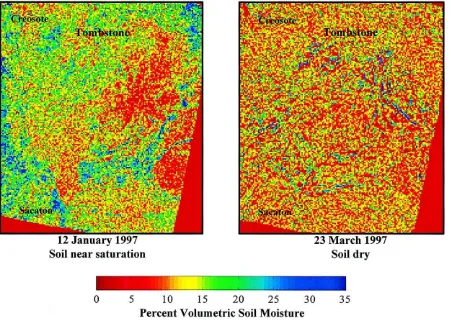
Fig. 9. Regional maps of surface volumetric soil moisture based on ERS-2 C-band SAR images and the relation betweenσ0−σdry0 and
registration for SAR scenes of mountainous terrain. This error was found to be as large as 200 m in the mountainous regions of the image.
5. Discussion and concluding remarks
Field validations, by their nature, are generally at the mercy of circumstances beyond the control of the experimenters. In this study, we were quite fortunate with atmospheric and surface soil moisture conditions; we were less fortunate with plant conditions and image acquisition. For a variety of reasons, the plant greenup was minimal and measured GLAI was lower than the threshold forσ0attenuation by vegetation set by Sano (1997) in Fig. 1. Thus, we were able to confirm the relation between σ0−σdry0 andθs for GLAI values
less than 0.35, but we were unable to test the relation between GLAI andσ0−σdry0 for GLAI>0.35.
Image acquisition was also problematic. Due to an unexpected orbital shift in the ERS-2 satellite, one of our field sites (Tobosa) was excluded from seven of eight SAR images. Furthermore, one of the Landsat-5 TM and two ERS-2 SAR images that were ordered were not acquired by the satellite sensor. This is not an uncommon experience in such field validation experi-ments (Moran, 1994). Finally, theσ0of the SAR scene acquired on 16 February was substantially lower than that of all other scenes. According to our ground-based measurements of meteorological conditions, vegeta-tion cover, roughness and surface soil moisture, it was unreasonable for the Februaryσ0to be 2–3 dB lower than σ0 measured in July. The February scene was consequently not included in the analysis, and is cur-rently being investigated with assistance from the ESA to explain this anomaly.
Despite these setbacks, we were able to provide preliminary validation of an operational approach for using SAR and optical data for monitoring vegetation growth and surface soil moisture conditions. The gen-eral approach requires a temporal set of SAR images during the “dry” and “wet” seasons, and intermittent optical data at times of vegetation greenup. The pre-liminary results were encouraging. As expected, the correction for surface roughness conditions resulted in a substantial improvement in the correlation be-tween the SAR signal andθs. We confirmed that for
GLAI values less than 0.35, it was unnecessary to
correct for attenuation of the SAR signal by vege-tation. Furthermore, it appeared that differences in standing brown vegetation (TPAI<1.5) did not affect the SAR backscatter signal after the correction for roughness was applied. The latter result is significant for two reasons. First, it means that accurate estimates of surface soil moisture may be possible without a priori information about standing dry biomass and dry litter. Second, it gives support to the use of an optical/SAR approach for mapping surface soil mois-ture because the optical data is sensitive to changes in GLAI rather than TPAI.
Results from this analysis also raised some con-cerns. First, the difference between measured and modeled GLAI was relatively small, but not negli-gible (RMS error 0.13). A high level of accuracy (∼0.05) in the estimate of GLAI is required for this approach since a minimal change in GLAI will result in a large change inσ0−σdry0 (see Fig. 1 and work by Troufleau et al., 1997). To achieve such accuracy, it may be necessary to assimilate remotely sensed information into a plant growth model to determine GLAI (e.g., Nouvellon et al., 1998). Second, despite the good relation betweenσ0−σdry0 andθs (Fig. 8), the overall sensitivity of the SAR signal to changes in surface soil moisture was low. For the Sacaton site, a change in surface soil moisture of 25% resulted in a change inσ0−σdry0 of only 3 dB. This is notable since 25% is the maximum soil moisture range expected for sandy loam soils in Arizona’s semiarid rangeland.
Acknowledgements
References
Engman, E.T., Chauhan, N., 1995. Status of microwave soil moisture measurements with remote sensing. Remote Sensing Environ. 51, 189–198.
Goodrich, D.C., Chehbouni, A., Goff, B., MacNish, B., Maddock III, T., Moran, M.S., Shuttleworth, W.J., Williams, D.G., Watts, C., Hipps, L.H., Cooper, D.I., Schieldge, J., Kerr, Y.H., Arias, H., Kirkland, M., Carlos, R., Cayrol, P., Kepner, W., Jones, B., Avissar, R., Begue, A., Bonnefond, J.-M., Boulet, G., Branan, B., Brunel, J.P., Chen, L.C., Clarke, T., Davis, M.R., DeBruin, H., Dedieu, G., Elguero, E., Eichinger, W.E., Everitt, J., Garatuza-Payan, J., Gempko, Gupta, H., Harlow, C., Hartogensis, O., Helfert, M., Holifield, C., Hymer, D., Kahle, A., Keefer, T., Krishnamoorthy, S., Lhomme, J.-P., Lagouarde, J.-P., Lo Seen, D., Laquet, D., Marsett, R., Monteny, B., Ni, W., Nouvellon, Y., Pinker, R.T., Peters, C., Pool, D., Qi, J., Rambal, S., Rodriguez, J., Santiago, F., Sano, E., Schaeffer, S.M., Schulte, S., Scott, R., Shao, X., Snyder, K.A., Sorooshian, S., Unkrich, C.L., Whitaker, M., Yucel, I., 2000. Preface paper to the semi-arid land-surface-atmosphere (SALSA) program special issue, Agric. For. Meteorol. 105, 3–19.
Hymer, D.C., Moran, M.S., Keefer, T.O., 2000. Soil moisture evaluation using a hydrologic model and calibrated sensor network. Soil Sci. Soc. Am. J. 64, 319–326.
Moran, M.S., 1994. Irrigation management in Arizona using satellites and airplanes. Irrig. Sci. 15, 35–44.
Moran, M.S., Jackson, R.D., Clarke, T.R., Qi, J., Cabot, F., Thome, K.J., Markham, B.L., 1995. Reflectance factor retrieval from landsat TM and SPOT HRV data for bright and dark targets. Remote Sensing Environ. 52, 218–230.
Moran, M.S., Vidal, A., Troufleau, D., Inoue, Y., Qi, J., Clarke, T.R., Pinter Jr., P.J., Mitchell, T.A., Neale, C.M.U., 1997. Combining multi-frequency microwave and optical data for farm management. Remote Sensing Environ. 61, 96–109. Nouvellon, Y., Lo Seen, D., Bégué, A., Rambal, S., Moran, M.S.,
Qi, J., Chehbouni, A., Kerr, Y., 1998. Combining Remote Sensing and Plant Growth Modeling to Describe the Carbon
and Water Budget of Semi-arid Grasslands. IGARSS, Seattle, WA, July 6–10, pp. 2393–2398.
Nouvellon, Y.P., Bégué, A., Moran, M.S., Lo Seen, D., Rambal, S., Luquet, D., Chehbouni, A., Inoue, Y., 2000. PAR extinction in shortgrass-ecosystems: effects of clumping, sky conditions and soil albedo. Agric. For. Meteorol. 105, 21–41.
Qi, J., Kerr, Y.H., Moran, M.S., Weltz, M., Huete, A.R., Sorooshian, S., Bryant, R., 2000. Leaf area index estimates using remotely sensed data and BRDF models in a semi-arid region. Remote Sensing Environ. 73, 18–30.
Sano, E.E., 1997. Sensitivity analysis of C- and Ku-band synthetic aperture radar data to soil moisture content in a semiarid regions. Ph.D. Dissertation. University of Arizona, Department of Soil, Water and Environmental Science, Tucson, AZ, 122 pp.
Sano, E.E., Qi, J., Huete, A.R., Moran, M.S., 1998. The use of SAR/TM synergy for estimating soil moisture content over a semi-arid rangeland. In: Proceedings of the Second Latino-American Seminar on Radar Remote Sensing INPE/ ESA, ESA-sp-434, Santos, Sao Paulo, September 11–12. Simanton, J.R., Dixon, R.M., McGowan, I., 1978. A
microrough-ness meter for evaluating rainwater infiltration. In: Hydrology and Water Resources in Arizona and the Southwest. American Water Resources Association, Nevada Academy of Science, Arizona.
Troufleau, D., Vidal, A., Beaudoin, A., Moran, M.S., Weltz, M.A., Goodrich, D.C., Washburne, J., Rahman, A.F., 1997. Optical-microwave synergy for estimating surface sensible heat flux over a semi-arid rangeland. Remote Sensing Rev. 15, 113–132. Ulaby, F.T., Allen, C.T., Eger III, G., Kanemasu, E., 1984. Relating the microwave backscattering coefficient to leaf area index. Remote Sensing Environ. 14, 113–133.
Ulaby, F.T., Dubois, P.C., Van Zyl, J., 1996. Radar mapping of surface soil moisture. J. Hydrol. 184, 57–84.