Changes in carbohydrates, leaf pigments and yield in potatoes induced
by different ozone exposure regimes
B. Köllner
∗, G.H.M. Krause
Landesumweltamt NRW (LUA, NRW), Wallneyerstr. 6, D-45133 Essen, Germany
Received 27 July 1998; received in revised form 5 March 1999; accepted 18 August 1999
Abstract
Potatoes (Solanum tuberosum cv. ‘Hela’) were exposed in closed fumigation chambers for nine weeks until harvest in 1995. In three treatments ozone was applied as constant concentration (35 ppb for 24 h/d) as well as with peaks (110 ppb for 4 h/d and 65 ppb for 8 h/d) under equal dose conditions. In addition ozone was applied at constant concentration (47, 65 ppb for 24 h/d) in two treatments. In 1996 potatoes were exposed for six weeks and kept until harvest for four weeks in charcoal filtered ambient air (<5 ppb). Ozone was applied as constant concentration (65 ppb for 24 h/d) as well as with peaks (110 ppb
for 4 h/d). In both years plants in control chambers were cultivated in charcoal filtered ambient air (<5 ppb). Effects of the
different treatments on pigment and carbohydrate (hexoses, sucrose, starch) content in leaves and/or tubers during and after exposure were determined and fresh tuber weight was assessed. Effects on physiological parameters, a decrease in sucrose up to 43% relative to control (p<0.05, 65 ppb for 24 h/d) and pigment content up to 25% relative to control (p<0.001, 65 ppb
for 24 h/d) of leaves were induced after four weeks of exposure. Under equal dose conditions (1995) ozone peaks induced much more pronounced effects on carbohydrate content than constant concentrations. Glucose content in leaves decreased after eight weeks of exposure to 65 ppb (8 h/d) resp. 110 (4 h/d) about 67% (p<0.001) resp. 62% (p<0.01) in comparison
with a decrease of about 43% ( p<0.05) after exposure to 35 ppb (24 h/d). Similar observations were made with respect to
tuber weight which decreased up to 20% (p<0.01) after exposure to 110 ppb peaks (4 h/d) and a four week period in charcoal
filtered air (<5 ppb). This was similar to the decrease of 26% (p<0.001) after exposure to 65 ppb constantly, the daily dose
being doubled (1996).
The results favour the hypothesis that ozone peaks induce much stronger effects than constant concentrations using the same total dose and that effects of ozone treatment are carried over for weeks in periods of relatively low ozone levels with respect to tuber weight as well as carbohydrate content. ©2000 Elsevier Science B.V. All rights reserved.
Keywords: Ozone; Potato; Carbohydrate; Pigments; Yield; Germany
1. Introduction
Negative effects of ozone on vegetation have been known for nearly fifty years, but it is only during the
∗Corresponding author. Tel.:+49-201-7995-1218;
fax:+49-201-7995-1574.
E-mail address: [email protected] (B. Köllner).
last two decades that ozone has become of serious con-cern to vegetation in European regions. The state of North Rhine Westphalia in Germany consists of a large urban and industrial agglomeration area (Ruhr area), but it also has intensive agricultural and horticultural land use in adjacent regions. As in other areas of Ger-many high ozone concentrations during the vegetation period are experienced nearly every year with varying
intensity and duration (Bruckmann et al., 1995): typi-cal situations with periods of >60 ppb as daily mean for more than one week and three month AOT40-values (accumulated exposure over a threshold of 40 ppb) up to 7 ppm h, e.g. at the LUA NRW monitoring station ‘Egge mountains’, were observed during the vegetation periods in the last years (air quality mon-itoring data 1996 and 1997, unpublished data Lan-desumweltamt NRW). Although several experimental programs in USA (e.g. NCLAN) and in Europe (e.g. European OTC network, ICP-crops) were initiated to evaluate crop loss from air pollution (Eric and Tingey, 1988; Benton et al., 1995; Sanders et al., 1995; Fuhrer et al., 1997), there is little knowledge whether effects, such as altered assimilate partitioning as a result of ozone exposure (Reiling and Davison, 1994; Pleijel et al., 1995) may cause reductions in quality and quan-tity of yield of commercially grown crops with special reference to economically important domestic culti-vars. Experiments with spring wheat (Triticum
aes-tivum cv. ‘Nandu’) show that (i) ozone episodes during
anthesis are affecting yield more than episodes dur-ing earlier developmental stages, (ii) peak situations are more effective during an ozone episode than con-stant concentrations and (iii) heat stress effects and ozone episodes with peak situations act synergistically (Meyer et al., 1997). Within this framework,
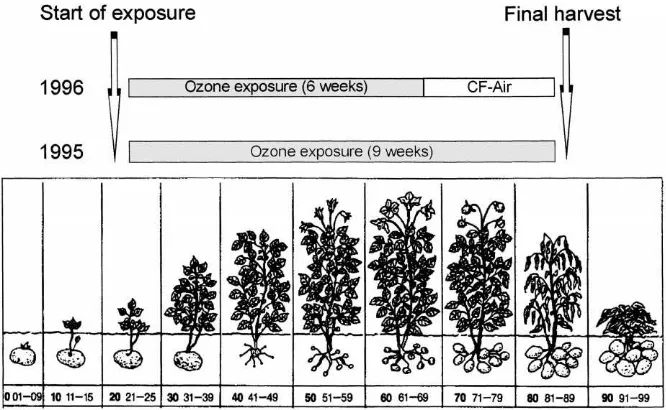
experi-Fig. 1. Stage of development of potato (source: Pflanzliche Erzeugung Vol. 2, 9th ed., 1987, Landwirtschaftsverlag Münster-Hiltrup). ments were carried out with potatoes (Solanum
tubero-sum), because several American cultivars were shown
to be very sensitive to ozone (Heggestad, 1973; Mose-ley et al., 1978; Pell et al., 1980; Pell and Pearson, 1984). Pell et al. (1980) reported a reduced number and weight of tubers as well as solids after fumigating two cultivars with 200 ppb ozone for 3 h every 14 days for a total period of 120 days in a two year experiment. The aim of the fumigation experiments carried out in 1995 and 1996 was to characterize the effects of ozone (constant concentrations vs ozone peaks under equal dose conditions) on one commercially important domestic potato cultivar with respect to concentration of pigments and carbohydrates in leaves as well as yield quantity and quality. In 1996 the ability of plants to recover from ozone effects after the end of exposure was also investigated.
2. Materials and methods
2.1. Cultivation of plants
Tubers of Solanum tuberosum (cv. ‘Hela’), pur-chased locally were kept in the dark for 25 days at
temperatures between 9◦C and 11◦C for sprouting.
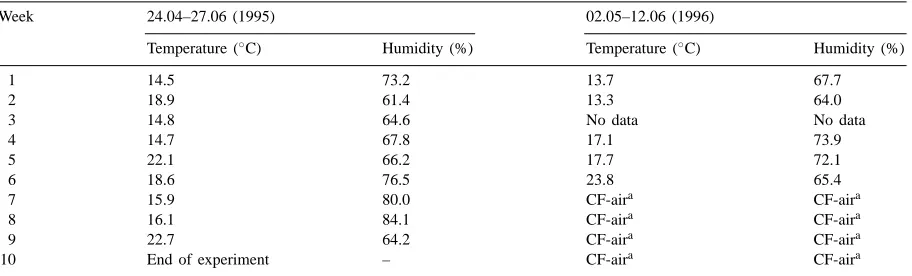
Table 1
Microclimatic conditions (24 h weekly means) within the chambers during ozone exposure
Week 24.04–27.06 (1995) 02.05–12.06 (1996)
Temperature (◦
C) Humidity (%) Temperature (◦
C) Humidity (%)
10 End of experiment – CF-aira CF-aira
aIn 1996 potatoes were exposed to ozone for six weeks and kept until harvest for four weeks in charcoal filtered (CF) ambient air (<5 ppb).
in 20 l growth containers in a mix of standardized soil (Frühtorfer Einheitserde ED 73) containing a slow release fertilizer and sand (4:1) and covered by a 7 cm soil layer. After emergence of first leaves, pots were filled with an additional 4 cm soil layer. Plants were cultivated under greenhouse conditions (not
clima-tized) with carbon filtered (CF) air (<5 ppb O3) until
the start of exposure (growth stage 20, Fig. 1). Six pots were transferred to each of the closed exposure chambers and kept there until harvest (growth stage 80, Fig. 1). Plants were watered regularly to 80% field capacity to guarantee a constant soil moisture content. During the exposure periods microclimatic conditions (temperature, humidity) within the cham-bers were registered continuously. Table 1 gives the weekly means.
2.2. Fumigation chambers
The experiments were carried out in hexagonal
closed fumigation chambers (basal area: 3.85 m2,
height: 2.6 m) at the Kettwig fumigation station of the North Rhine-Westphalia State Environment Agency. Chambers were ventilated by an axial blower, pro-viding one air change every 2 min. At the top of the chamber filtered air (a system containing charcoal KOH-coated, uncoated, Purafil®) was supplied and mixed by a special propeller, with adjustable rotations per minute, giving a uniform mixture of pollutant and filtered air. Ozone was generated from pure oxygen by electric discharge (VTU ozone generator). It was
added to charcoal-filtered air by means of mass flow controllers linked to a desktop computer programmed with the individual exposure profiles. Concentra-tions of ozone within the chambers were measured at plant height continuously by an UV absorption detector (Dasibi 1008-AH, Environm. Corp., CO). To control ozone concentration within the chambers, a timer provided one reading of 5 min every 60 min for each chamber and ambient air outside the chambers. During the exposure periods the concentration of
pol-lutants like NOx, SO2 within the chambers as well
as microclimatic conditions (temperature, humid-ity, photosynthetic active radiation) were monitored continuously.
2.3. Exposure of plants
Because of the large size of the plants, two chambers with identical treatment (six plants per chamber) were used to fumigate plants with ozone or charcoal-filtered air (control). In 1995 (12 chambers) plants were ex-posed from growth stage 20 until harvest (growth stage 80), and in 1996 (six chambers) plants were exposed from growth stage 20 to growth stage 60 and kept
under control conditions (<5 ppb O3) until harvest
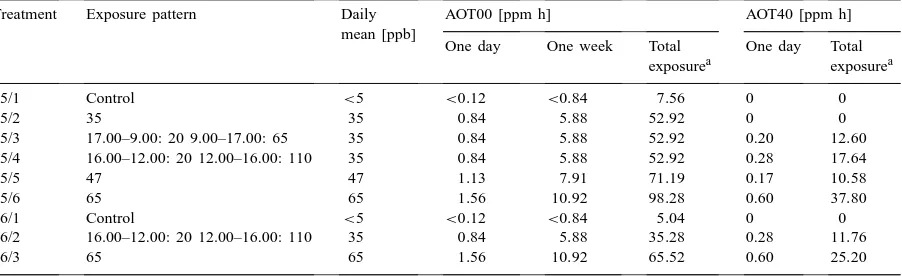
Table 2
Ozone exposure regimes; plants were exposed from growth stage 20 until growth stage 80 in 1995 (treatment 95/1–95/6) and from growth stage 20 until growth stage 60 in 1996 (treatment 96/1–96/3), respectively
Treatment Exposure pattern Daily AOT00 [ppm h] AOT40 [ppm h]
mean [ppb]
One day One week Total One day Total exposurea exposurea
a1995: nine weeks; 1996: six weeks.
2.4. Biochemical measurements
For carbohydrate and pigment analysis leaves from six plants (same position/height) of each treatment
were harvested in 14 days intervals, frozen (−25◦C)
and biochemically analysed subsequent to fresh-weight determination. At the end of the experiments at growth stage 80 (Fig. 1) fresh- and dry-weight of leaves and tubers were determined and cubes of about
1 cm3taken as samples for biochemical analysis from
the centre of each tuber of each plant, frozen and lyophilized. Chlorophyll a and b and carotenoids were extracted with DMSO according to Hiscox and Israel-stam (1979) and calculated according to Lichtenthaler (1987).
Carbohydrates were determined as follows: sam-ples of 50 mg of lyophilized material were extracted with 10 mg of Polyclar AT (Serva) and 1.5 ml of hot
water in a 2 ml vial at 80◦C for 15 min. After cooling,
the samples were shaken for 20 min and centrifuged (10.000 rpm, Centrifuge Force Seven, Denver Instru-ments Corporation). Pellets were washed twice with distilled water and supernatants pooled, lyophilized
and stored at −25◦C. Concentrations of glucose,
fructose and sucrose were analysed according to a modified version of the Boehringer UV-test kit as described by Hoffmann-Thoma et al. (1996). Starch content was analysed as glucose equivalents; the pel-let and supernatant of each sample were incubated for 15 h with amyloglucosidase in acetate buffer pH 4.5.
2.5. Statistics
Means of plants (n=10) from the different
treat-ments were compared with the control (charcoal fil-tered air during the whole experiment) and data
sta-tistically processed using Student’s t-test (∗p
<0.05;
∗∗p<0.01;∗∗∗p<0.001) from SPSS (Bühl and Zöfel,
1994).
3. Results
3.1. Photosynthetic pigments and carbohydrates in leaves
All ozone treated plants showed a distinct typical loss of green colour in both years, which may indi-cate a reduction in pigment content during exposure. Fig. 2 shows that shifts of pigment content reflected the tendency as described for leaf colour. After four weeks of ozone exposure, a strong decrease in pig-ments in all ozone treatpig-ments compared with controls was registered with ongoing exposure, the strongest effects being shown in the treatment with the highest dose (65 ppb, 96/3).
Fig. 2 and Table 3 show that the 65 ppb constant exposure (dose: 1.56 ppm h/d) resulted in the most pronounced decrease in both years.
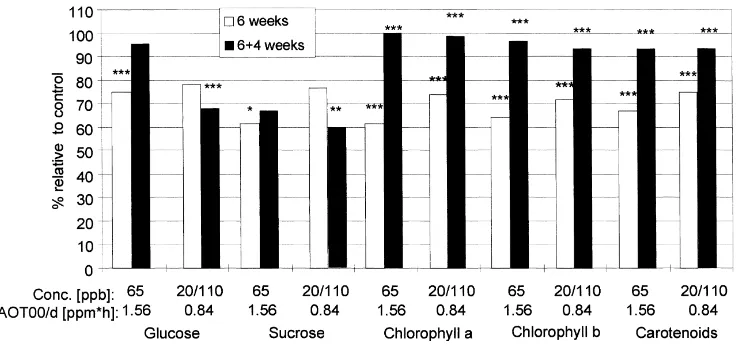
Fig. 2. Chlorophyll a+b content [mg/g DW] (relative to control, charcoal filtered air) of Solanum tuberosum (cv. ‘Hela’) after four and six weeks of different ozone treatments (∗p
<0.05;∗∗p<0.01;∗∗∗p<0.001).
Table 3
Comparison of pigment and carbohydrate content (% relative to control) after six weeks of exposure
Content in leaves (% relative to control) Concentration [ppb]; AOT00/day [ppm h]
1995 1996
20/110; 0.84 65; 1.56 20/110; 0.84 65; 1.56
Chlorophyll a 83∗ 67∗∗∗ 74∗∗∗ 62∗∗
Chlorophyll b 89∗ 78∗∗∗ 72∗∗∗ 64∗∗∗
Carotenoids 89∗ 74∗∗∗ 75∗∗∗ 67∗∗∗
Glucose 66∗ 39∗ 78 75∗∗∗
Sucrose 79∗ 77 77 62∗
Starch 34∗ 24∗∗ 52 47∗
∗p
<0.05.
∗∗p
<0.01.
∗∗∗p
<0.001.
Fig. 3. Glucose, sucrose and starch concentration (% difference relative to control) in leaves of Solanum tuberosum (cv. ‘Hela’) after four and eight weeks of different ozone treatments (1995). Ozone doses [ppm h] are presented for four and eight weeks of exposure, respectively. For ozone concentration see also Table 2 (∗p
(0.84 ppm h/d; 23.5 ppm h for four weeks) induced a significant decrease in sucrose only. Higher doses (1.13 and 1.56 ppm h/d; 31.6 and 43.7 ppm h for four weeks) reduced sucrose and starch content in a range of about 25–70%.
Eight weeks of exposure resulted in a decrease of glucose of about 40% (35 ppb), 65% (20/65 ppb) and 60% (20/110 ppb) under the same ozone dose regime (0.84 ppm h/d). Starch and to a lesser extent sucrose were decreased as well (up to 70%) in leaves of potato plants fumigated for eight weeks (Fig. 3). Treatments 95/3–95/6 induced more or less similar reduction patterns but comparing the equal dose treat-ments (0.84 ppm h/d; 47.0 ppm h for eight weeks), sugars were reduced most in treatments 95/3 and 95/4, receiving ozone peaks (65 ppb for 8 h and 110 ppb for 4 h) in comparison to constant concentration of 35 ppb for 24 h (95/2).
In both years the lower ozone dose (0.84 ppm h/d; total dose in six weeks: 35.3 ppm h) consisting of moderate peak concentrations (95/4 and 96/2) induced reductions with respect to pigment and carbohydrate content nearly in the same range as higher doses (1.56 ppm h/d; total dose in six weeks: 65.5 ppm h) consisting of comparatively high constant concentra-tions (95/6 and 96/3) (Table 3).
Fig. 4 shows that, irrespective of dose, pigments decreased after six weeks of exposure. Reduction
Fig. 4. Glucose, sucrose and pigment content in leaves (% relative to control, charcoal filtered air) of Solanum tuberosum (cv. ‘Hela’) after six weeks of two different ozone treatments and additionally four weeks of ozone free treatment (1996) (∗
p<0.05;∗∗p<0.01;∗∗∗p<0.001). after exposure to 20/110 ppb (0.84 ppm h/d) again was nearly in the same range as after exposure to 65 ppb (1.56 ppm h/d). Pigments recovered after four weeks in ‘ozone free’ air.
Four weeks after the end of exposure sucrose con-tent of potato leaves (formed during ozone exposure) was still reduced about 30% in both ozone treat-ments in comparison with the control, but significant
(p<0.01) only in the treatment 96/2 (20/110 ppb;
0.84 ppm h/d). Glucose content of plant leaves receiv-ing a comparably high constant concentration (24 h/d 65 ppb, 1.56 ppm h/d) was not significantly differ-ent from the control, whereas moderate ozone peaks (4 h/d 110 ppb, 0.84 ppm h/d) induced an irreversible reduction of about 30%, although the total dose was only half (Fig. 4).
3.2. Yield
In both experiments ozone had no significant in-fluence on the number of tubers per plant (data not shown). Determination of fresh weight and analysis of sucrose and starch content of tubers at harvest (Fig. 5) showed, however, that these parameters were affected quite similarly as described for the content of water soluble carbohydrates of leaves (Figs. 3 and 4).
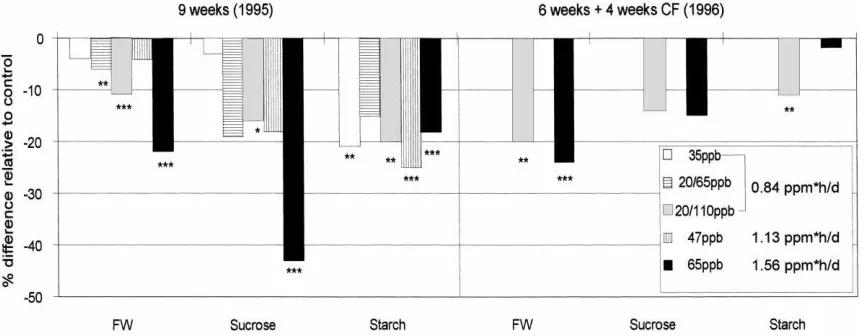
Fig. 5. Fresh weight, sucrose- and starch content (% difference relative to control) of tubers of Solanum tuberosum (cv. ‘Hela’) after nine weeks (1995) and six weeks (1996) of different ozone treatments (∗p
<0.05;∗∗p<0.01;∗∗∗p<0.001).
95/3 or 4 h 110 ppb, 95/4) induced in the case of fresh weight and sucrose content of tubers much stronger ef-fects than exposure to low constant concentration (24 h 35 ppb, 95/2): fresh weight of tubers decreased about
11% (p<0.001) after exposure to 110 ppb (4 h/d),
whereas exposure to 35 ppb (24 h) showed more or less no effect (Fig. 5).
In 1996 ozone effects were still detected at the end of the four week recovery period under ozone free con-ditions: fresh weight of tubers was reduced about 20%
(p<0.01) under a moderate ozone peak regime (96/2:
4 h 110 ppb; 35.3 ppm h) and about 24% (p<0.001)
after exposure to a constant concentration (96/3: 24 h 65 ppb; 65.5 ppm h). These results confirm, that peak concentrations are more effective than constant con-centrations.
4. Discussion
Ozone penetrates the leaves via stomata, so that the first targets of ozone or its reactive species are the plasma membranes of the mesophyll which are severely damaged if the detoxifying system of the apoplast is overcharged.
The data on pigment content showing a clear con-tinuos decline during exposure are in accordance with Nie et al. (1993), Sandelius et al. (1995) and Meyer et al. (1997), who reported a significant decrease of chlorophyll content with time and ozone concentration
in flag leaves of spring wheat. A reduced photosyn-thetic active leaf area, as a result of this, may induce a spiral of steady decline in plant vitality. There are good reasons to assume that the decline of photosyn-thetic pigments which are affected by ozone are sec-ondary effects (Grandjean Grimm and Fuhrer, 1992; Mortensen and Engvild, 1995).
Because leaves act as an active assimilate source, the increase of glucose and starch during the first weeks of exposure, especially under comparatively moderate ozone exposure conditions (lowest dose, constant concentration), indicate early membrane damage, interfering with sugar transport to the con-ducting elements or probably with the phloem loading process itself. After this partial increase of water soluble carbohydrates during the first days of expo-sure, there was a marked decrease in plants of all ozone regimes during the following weeks of expo-sure probably as a further consequence of membrane damage, as shown by Darall (1989). The burst in respiration which occurs following ozone exposure represents the increased costs associated with detox-ification of the pollutant and the repair of damage (Darall, 1989; Fuhrer et al., 1989; Bender and Weigel, 1995).
and Engvild, 1995; Polle, 1996) although the under-lying mechanism(s) remain to be elucidated.
In the present experiments leaves, formed during ozone exposure, from potato plants exposed to ozone
free air (<5 ppb) after ozone treatment (1996) show
that even four weeks after end of exposure glucose and sucrose content of leaves was still reduced espe-cially in the plants treated with peak concentrations (110 ppb 4 h/d). Although pigment content recovered, it can be assumed that the plants ability to compensate for ozone injury is reduced markedly with respect to assimilate allocation.
Because ozone changes the partitioning of plant assimilates, which may lead to altered growth re-sponses (Bender and Weigel, 1995), an effect of ozone on root crops can be expected (Bastrup-Birk and Mortensen, 1997). Although there was little ef-fect of ozone on number of tubers at harvest, fresh weight, sucrose and starch content, however, were reduced markedly. This might be explained by the fact that the number of tubers is established at a very early stage (stage 40) and ozone does not affect actual tuber initiation, whereas biomass and carbo-hydrate content are quantitatively influenced during the whole exposure period of the plants. Hence, it can be concluded that ozone-induced perturbation of assimilate allocation in potatoes is responsible for the observed reduced fresh weight and quality of tubers. Although there are some basic differences be-tween wheat and potatoes, this accords with Fuhrer et al. (1989) who fumigated cereals with ozone in open top chambers and found a reduced shoot: root weight ratio as a result of reduced assimilate pro-duction and disturbance of carbohydrate allocation, and consequently, a reduced yield. Ozone fumiga-tion of sensitive potato cultivars affected both yield and quality of potatoes, reducing the percentage of dry matter, tuber weight, number of tubers and to-tal sugars (Pell et al., 1980, 1988; Voss et al., 1982; Pell and Pearson, 1984). Jönsson and Skärby (1985) fumigated a Swedish potato variety over two years in OTCs with three different levels of ozone. During the two seasons at the highest concentration (51 ppb), the weight of tubers decreased with 35% and 20%, respectively.
The results indicate that under equal dose condi-tions, assimilate allocation in potatoes, and in con-sequence quality of tubers (fresh weight, sucrose
content) were affected most strongly by an ozone regime with moderate peaks in comparison with constant concentrations. These results accord with recent findings from time/concentration experiments with other crops (e.g. oat, spring wheat) in open-top chambers (Finnan et al., 1996, 1997a, b) as well as fu-migation experiments under controlled environmental conditions (Musselman et al., 1994). An analysis of open-top chamber data showed that cumulative expo-sure indices, which use weighting approaches giving increased weight to higher concentrations, are better related to plant response than seasonal averages (Plei-jel et al., 1995; Legge et al., 1995). In accordance with that, for example, one of the descriptors of ozone exposure used in the US is SUM06 (sum of all hourly concentration above 60 ppb) (Hogsett et al., 1995; Lee et al., 1988). In the UN-ECE studies, an exposure in-dex or critical level of AOT40 (accumulated exposure over threshold of 40 ppb) was selected as the best pre-dictor of adverse crop response and has been used to predict yield losses (Finnan et al., 1996; Fuhrer et al., 1997). However, because the highest ozone concentra-tions often coincide with moderate to low atmospheric conductivities, as has been shown by ozone flux den-sity measurements above a grassland ecosystem, it was concluded that ozone concentrations between 50 and 90 ppb are likely to bear a greater phytotoxic po-tential and are more important with respect to plant effects than concentrations >90 ppb (Grünhage and Jäger, 1994; Krupa et al., 1994). To establish adequate dose-response relationships for field situations, fur-ther investigations have to be done to elucidate the in-fluence of environmental (Grünhage and Jäger, 1994; Grünhage et al., 1997; Fuhrer, 1995) and plant specific conditions (Sellden and Pleijel, 1995; Vandermeiren et al., 1995) on the absorbed ozone dose, which in turn affects the economic parameters growth and yield of crops.
Acknowledgements
References
Bastrup-Birk, A., Mortensen, L., 1997. Effect of ozone on vegetation. In: Fenger, J. (Ed.), Photochemical Air Pollution. NERI Technical Report No. 199, Chapter 5, pp. 103–133. ISBN 87-7772-334-1.
Bender, J., Weigel, H.J., 1995. Zur Gefährdung landwirtschaftlicher Kulturpflanzen durch troposphärische Ozonkonzentrationen. Ber. Ldw. 73, 136–156.
Benton, J., Fuhrer, J., Gimeno, B.S., Skärby, L., Sanders, G., 1995. Results from the UN/ECE ICP-crops indicate the extent of exceedance of the critical level of ozone in Europe. Water Air Soil Pollut. 85, 1473–1478.
Bruckmann, P., Friesel, J., Külske S., 1995. Ozon im Sommer 1994. Konzentrationen und Auswertung von Einzelepisoden. In: LUA Jahresbericht 1994. Hrsg: LUA NRW, Essen. Bühl, A., Zöfel, P., 1994. SPSS für Windows, Version 6.
Addison-Wesley, Reading. ISBN 3-89319-689-6.
Darall, N.M., 1989. The effects of air pollutants on physiological processes in plants. Plant Cell Environ. 12, 1–30.
Eric, M.P., Tingey, D.T., 1988. The NCLAN program for crop loss assessment. In: Heck,W.W., Taylor, C.O., Tingey, D.T. (Eds.), Assessment of Crop Loss From Air Pollutants, Proceedings of an International Conference, Raleigh, NC, October 1987.
Finnan, J.M., Burke, J.I., Jones, M.B., 1997a. An evaluation of indices that describe the impact of ozone on the yield of spring wheat (Triticum aestivum L.). Atmos. Environ. 31, 2685– 2693.
Finnan, J.M., Burke, J.I., Jones, M.B., 1997b. A note on a non-destructive method of chlorophyll determination in wheat (Triticum aestivum L.). Irish J. Agric. Food Res. 36, 85–89. Finnan, J.M., Jones, M.B., Burke, J.I., 1996. A time–concentration
study on the effects of ozone on spring wheat (Triticum aestivum L.). 1. Effects on yield. Agric. Ecosystems Environ. 57, 159– 167.
Fuhrer, J., 1995. Critical level for ozone to protect agricultural crops: interaction with water availability. Water Air Soil Pollut. 85, 1355–1360.
Fuhrer, J., Egger, A., Lehnherr, B., Grandjean, A., Tschannen, W., 1989. Effects of ozone on the yield of spring wheat (Triticum aestivum L. cv. Albis) grown in open-top chambers. Environ. Pollut. 60 (3/4), 273–289.
Fuhrer, J., Skärby, L., Ashmore, M.R., 1997. Critical levels for ozone effects on vegetation in Europe. Environ. Pollut. 97, 91– 106.
Grandjean Grimm, A., Fuhrer, J., 1992. The response of spring wheat (Triticum aestivum L.) to ozone at higher elevations. I. Measurement of ozone and carbondioxide fluxes in open-top field chambers. New Phytol. 121, 201–210.
Grünhage, L., Jäger, H.-J., 1994. Influence of the atmospheric conductivity on the ozone exposure of plants under ambient conditions: considerations for establishing ozone standards to protect vegetation. Environ. Pollut. 85, 125–129.
Grünhage, L., Jäger, H.-J., Haenel, H.-D., Hanewald, K., Krupa, S., 1997. Platin (plant–atmosphere interaction). II. Co-occurrence of high ambient ozone concentrations and factors limiting plant absorbed dose. Environ. Pollut. 98, 51–60.
Heggestad, H., 1973. Photochemical air pollutioninjury to potatoes in the Atlantic coastal states. Am. Potato J. 50, 315–328. Hiscox, J.D., Israelstam, G.F., 1979. A method for the extraction
of chlorophyll from leaf tissue without maceration. Can. J. Bot. 57, 1332–1334.
Hoffmann-Thoma, G., Hinkel, K., Nicolay, P., Willenbrink, J., 1996. Sucrose accumulation in sweet sorghum stem internodes in relation to growth. Physiologia Plantarum 97, 277– 284.
Hogsett, W.E., Herstrom, A., Laurence, J.A., Weber, J.E., Lee, E.H., Tingey, D., 1995. An approach for characterizing tropospheric ozone risk to forest. In: Lee, S.D., Schneider, T. (Eds.), Proceedings of the Fourth US/Dutch International Symposium: Comparative Risk Analysis and Priority Setting for Air Pollution Issues, Air and Waste Management Association, Pittsburgh, PA, pp. 119–145.
Jönsson, B., Skärby, L., 1985. Effects of ozone on potatoes, spinach, peas, peas and beans. Växtskyddsnotiser 49, 9–11. Krupa, S.V., Nosal, M., Legge, A.H., 1994. Ambient ozone and
crop loss: establishing a cause–effect relationship. Environ. Pollut. 83, 269–276.
Lee, E.H., Tingey, D.T., Hocksett, W.E., 1988. Establishing a standard to protect vegetation ozone exposure/dose considerations. Atmos. Environ. 21, 561–568.
Legge, A.H., Grünhage, L., Nosal, M., Jäger, H.J., Krupa, S.V., 1995. Ambient ozone and adverse crop response: an evaluation of North American and European data as they relate to exposure indices and critical levels. Angew. Bot. 69, 192– 205.
Lichtenthaler, H.K. (Ed.), 1987. Application of Chlorophyll Fluorescence. Kluwer Academic Publishers, Dordrecht, p. 366. Meyer, U., Köllner, B., Willenbrink, J., Krause, G.H.M., 1997. Effects of ozone on agricultural crops in Germany. I. Different ambient ozone exposure regimes affect photosynthesis and assimilate allocation in spring wheat. New Phytol. 136, 645– 652.
Mortensen, L., Engvild, K.C., 1995. Effects of ozone on 14C translocation velocity and growth of spring wheat (Triticum aestivum L.) exposed in open top chambers. Environ. Pollut. 87, 135–140.
Moseley, A.R., Rowe, R.C., Weidensaul, T.C., 1978. Relationship of foliar injury to maturity classification and yield of potatoes. Am. Potato J. 55, 147–153.
Musselman, R., Younglove, T., McCool, P.M., 1994. Response of Phaseolus vulgaris L. to differing ozone regimes having identical total exposure. Atmos. Environ. 28, 2727–2731. Nie, G.-Y., Tomasevic, M., Baker, N.R., 1993. Effects of ozone
on the photosynthetic apparatus and leaf proteins during leaf development in wheat. Plant Cell Environ. 16, 643– 651.
Pell, E.J., Pearson, N.S., 1984. Ozone-induced reduction in quantity and quality of two potato cultivars. Environ. Pollut., Ser. A 35, 345–352.
Pell, E.J., Weissberger, W.C., Speroni, J.J., 1980. Impact of ozone on quantity and quality of greenhouse-grown potato plants. Environ. Sci. Technol. 14, 568–571.
Pleijel, H., Skärby, L., Wallin, G., Sellden, G., 1995. A process-oriented explanation of the nonlinear relationship between grain yield of wheat and ozone exposure. New Phytol. 131, 241–246.
Polle, A., 1996. Mehler Reaktion: Friend or foe in photosynthesis?. Bot. Acta 109, 84–89.
Reiling, K., Davison, A.W., 1994. Effects of exposure to ozone at different stages in the development of Plantago major L. on chlorophyll fluorescence and gas exchange. New Phytol. 128, 509–514.
Sandelius, A.S., Näslund, K., Carlsson, A.S., Pleijel, H., Sellden, G., 1995. Exposure of spring wheat (Triticum aestivum L.) to ozone in open-top chambers. Effects on acyl lipid composition
and chlorophyll content of flag leaves. New Phytol. 131, 231– 239.
Sanders, G.E., Skärby, L., Ashmore, M.R., Fuhrer, J., 1995. Establishing critical levels for the effects of air pollution on vegetation. Water Air Soil Pollut. 85, 189– 200.
Sellden, G., Pleijel, H., 1995. Photochemical oxidant effects on vegetation-response in relation to plant strategy. Water Air Soil Pollut. 85, 111–122.
Vandermeiren, K.L., De Temmermann, L., Hookham, N., 1995. Ozone sensitivity of Phaseolous vulgaris in relation to cultivar differences, growth stage , growth stage and growing conditions. Water Air Soil Pollut. 85, 1455–1460.
![Fig. 2. Chlorophyll a +six weeks of different ozone treatments ( b content [mg/g DW] (relative to control, charcoal filtered air) of Solanum tuberosum (cv](https://thumb-ap.123doks.com/thumbv2/123dok/3163414.1386680/5.612.86.523.70.252/chlorophyll-different-treatments-relative-charcoal-ltered-solanum-tuberosum.webp)