Human population growth and the extinction of the tsetse fly
Robin S. Reid
a,∗, Russell L. Kruska
a, Uwe Deichmann
b, Philip K. Thornton
a,
Stephen G.A. Leak
aaILRI, P.O. Box 30709, Nairobi, Kenya
bUnited Nations Statistics Division, 2 United Nations Plaza, New York, NY 10017, USA Received 15 February 1999; received in revised form 7 June 1999; accepted 19 July 1999
Abstract
Agricultural expansion is a major cause of biodiversity loss worldwide. In Africa, biologists have observed that the popula-tions of some tsetse species, which transmit human and livestock trypanosomosis, decline or disappear as human populapopula-tions grow and farmers clear fly habitat for cultivation. The objectives of this paper are to synthesize the available information concerning human and tsetse populations and to develop a model to estimate the future effect of human populations on tsetse populations. A spatial, GIS model was developed to estimate future impacts using a combination of fine-resolution human population data for the years 1960, 1980, 2000, 2020, and 2040; field data on the relationships between human and tsetse population densities; and the distribution of different types of tsetse fly. By 2040, many of the 23 species of tsetse fly will begin to disappear and the area of land infested and number of people in contact with flies will also decline. However, none of the species of flies will be under threat of extinction by human agricultural activities in the near term. An area of Africa larger than Europe will remain infested by tsetse and under threat of trypanosomosis for the foreseeable future. ©2000 Elsevier Science B.V. All rights reserved.
Keywords:Land-use; GIS; Trypanosomosis; Biodiversity; Africa
1. Introduction
Human modification of ecosystems is reducing bi-ological diversity worldwide (Ehrlich, 1988; Wilson, 1992), most commonly caused by habitat loss during the expansion of agriculture (Wilcove et al., 1998). One possible case of human-driven extinction con-cerns the 23 species of tsetse fly (Glossinaspp.) which
are endemic to the African continent. Several species of tsetse are expected to decline in numbers as
hu-∗Corresponding author. Tel.: +254-2-630743; fax: + 254-2-631499.
E-mail address:[email protected] (R.S. Reid).
man populations grow, tsetse habitat is cleared and its wildlife hosts are reduced in numbers (Jordan, 1986). Thus, human population growth may eventually cause the extinction of the tsetse fly.
More is at stake than species extinction – this African fly can be considered a ‘critical structuring species’ (e.g., Holling et al., 1995) in human and ecological systems across 10 million km2of the conti-nent. Tsetse flies transmit trypanosomosis, a parasitic infection that causes morbidity and mortality in sev-eral livestock species and in people. Wildlife species are the principal vertebrate hosts for trypanosomosis, but usually are unaffected by the disease, unless un-der stress (Jordan, 1986). However, over 29 million
people, 45 million cattle and unknown millions of sheep and goats in Africa are at risk of contract-ing trypanosomosis (or sleepcontract-ing sickness in people) from the tsetse fly (calculations by the authors from data of Deichmann, 1996; Ford and Katondo, 1977; WHO/FAO, 1979). On the other hand, the tsetse fly is considered by some (Ormerod, 1978; 1986; 1990) to be the guardian of African ecosystems, prevent-ing people and their livestock from over-usprevent-ing vast areas of the continent. Thus, if human population growth extirpates the tsetse fly in the near future, rural Africans may see short-term health benefits but longer term environmental costs. Environmental costs could include loss of wildlife populations and habitat (and thus income-earning opportunities), loss of eco-logical goods and services from wildlands (e.g., water recycling, soil erosion protection, natural genetic di-versity, access to fuelwood and timber) and loss of soil fertility. Possible disappearance of the fly also suggests the need for a major redirection of current research in trypanosome and tsetse biology, host im-munology, and the socio-economic and environmental impacts of tsetse control.
This paper reports the results of testing the old hy-pothesis that human population growth will cause the decline and extinction of the tsetse fly across Africa. The overall objectives of this paper is to synthe-size the available information concerning human and tsetse populations and to develop a model to estimate the future impact of human populations on tsetse populations. This is now possible because the authors developed the first, fine-resolution GIS coverages of future human populations for the African continent for this analysis. These coverages were combined with in-depth field observations of the relationship between the densities of people and flies to create scenarios of tsetse and trypanosomosis across Africa in the mid-21st century.
2. Methods
2.1. Synthesis of information on human and tsetse populations
To develop future scenarios, all the available in-formation about the relationship between human and
tsetse populations was synthesised. Most of this in-formation came directly from published accounts. In one case, the authors overlaid maps of human popula-tion density with maps of different fly species appear-ing in Jordan (1963) to obtain information about this relationship for Nigeria and Cameroon.
2.2. Tsetse scenario development
Once published data were synthesised, the first step in scenario development was to establish a quantita-tive relationship between human population density and tsetse populations from published accounts. Bi-ologists who have attempted to quantify this rela-tionship differentiate the effects of human population density on the three different groups of tsetse fly, dis-tinguished by their preferred habitats:morsitansflies
(five species) prefer open savanna woodlands, pal-palisflies (five species) prefer riverine vegetation, and fuscaflies (thirteen species) prefer forested habitats
(Jordan, 1986). For example (see results for details), only savanna and forest flies are affected strongly by human use. Thus, future scenarios for fly populations were only developed for savanna and forest, but not riverine, flies. In addition, this synthesis (see below) showed that this relationship differed from place to place, so two scenarios (one conservative, one liberal) were developed that captured the range of variation in the relationship between human and tsetse population densities.
The second step was to develop fine-scale, GIS cov-erages showing estimated, future human populations for the African continent. Before this analysis, hu-man population projections were available only at a national-level resolution (UN, 1997). Such a coarse resolution is inappropriate for this analysis because it does not match the resolution of the data on the distribution of tsetse species; tsetse data were col-lected during ground surveys of populations at a land-scape scale (Ford and Katondo, 1977; Katondo, 1984). To estimate future human populations, fine-resolution GIS layers (1.4 million, 5 km×5 km-grid cells) of
were used because they best represent the reduced mi-gration into unsettled rural areas expected in the fu-ture because of continued high rural-urban migration (Foote et al., 1993). For the years 2020 and 2040, it was found that the cell-based growth rates resulted in country-level human populations that were higher than the ‘medium’ UN country-level projections for the same years (UN, 1997) because the growth rates did not account for the expected decline in fertility and the effect of AIDS on African human populations. Therefore, after 2000, the projected aggregate popu-lation totals for each country were uniformly adjusted to match the UN population projections.
The final step was to use the quantitative relation-ship between the densities of people and flies (de-scribed above) to predict future tsetse populations. This was done by distinguishing three general classes describing the effect of human populations on fly pop-ulations: (1) a lower class where human populations are so low that they have no effect on tsetse popula-tions, (2) a moderate class where human populations are associated with a decline in tsetse populations, and (3) a higher class where human populations are high enough to extinguish tsetse populations. Human pop-ulation maps for the years 1960, 1990, 2020, and 2040 were then grouped into these three classes and then overlaid with the distribution of each fly group (Ford and Katondo, 1977; Katondo, 1984) to create scenar-ios of the changes in the health of tsetse populations between 1960 and 2040.
3. Results
3.1. Synthesis – relationships between human and tsetse populations
Not all three groups of tsetse flies (savanna, forest and riverine flies) are affected by human use. In partic-ular, tsetse biologists have observed a decline in pop-ulations of savanna and forest flies as growing human populations clear fly habitat for cropping and reduce wildlife species on which these flies feed (Nash, 1948; Ford, 1971; Putt et al., 1980; Jordan, 1986; Rawlings et al., 1993; the author’s calculations from Jordan, 1963; Hendrickx, 1999). By contrast, some species of river-ine flies can survive in densely populated villages by
living among human-made structures or in groves of trees planted near dwellings (Baldry, 1970; Gouteux et al., 1982; Okoth, 1982; Jordan, 1986; Hendrickx, 1999).
For savanna flies, the most detailed observations were made by Nash (1948) concerning the species
G. morsitans in Nigeria (Table 1). Nash compared
the state of tsetse populations with existing human populations in different parts of Nigeria. He wrote (Nash, 1948; p. 9), ‘Generally speaking, G. morsi-tansoccurs in areas with population densities ranging
from 0 to 40 per square mile; occasional flies of this species are found in areas of 40–100, but never when the population exceeds 100, to the square mile’ (see Table 1 for conversion into km2). His work is
sup-ported by tsetse surveys in Lafia Division, Nigeria, in 1954–1956, where populations ofG. m. submorsi-tansand G. longipalpis, two species of savanna fly,
were already in decline when human populations were about 14 people km−2 (Putt et al., 1980). In surveys in 1976–1978, when human populations had reached 61 km−2in Lafia, these species had disappeared from the entire division, save a protected forest area (Putt et al., 1980). In Togo, species ofG. morsitans submor-sitans, andG. longipalpiswere rarely found in areas
with more than 50 people km−2 (Hendrickx and
Na-pala, 1997; G. Hendrickx, unpublished data). Recently, Rawlings et al. (1993) both contradicted and supported these observations in The Gambia for G. morsitans submorsitans. In 12 of 19 rural districts (63%), tsetse
populations still existed in areas with more than 40 people km−2. In the remaining seven districts with
greater than 40 people km−2, noG. m. submorsitans
was left. Jordan (1986) claims that the Gambian sit-uation is relatively unique with the interspersion of bushy areas growing on lateritic soil in areas where human populations are high.
The evidence for a relationship between human pop-ulation density and poppop-ulations of the forest flies is similar to that of the savanna flies. In Togo, G. Hen-drickx (unpublished data) shows thatG. fuscais not
found in areas with more than 50 people km−2. In
Nigeria and western Cameroon, forest flies declined strongly as human population density increased in dif-ferent locations (Jordan, 1963). For spot records, 71% were found in areas with less than or equal to 38 peo-ple km−2, 19% were found in areas with 39–77
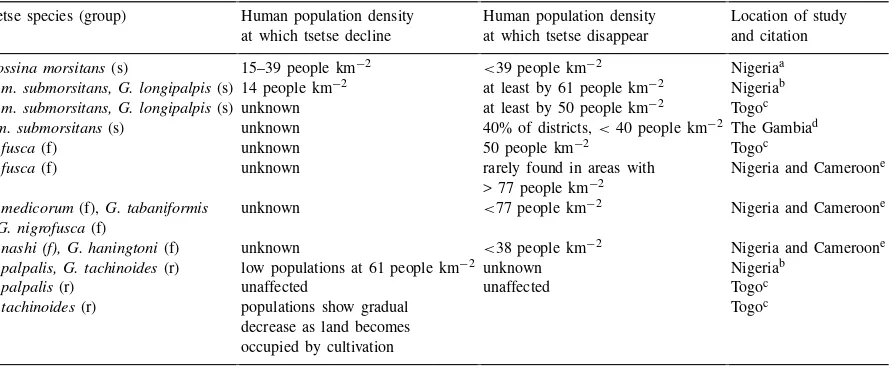
Table 1
Synthesis of quantitative field data on the relationship between human and tsetse population densities (s: savanna fly, r: riverine fly, f: forest fly)
Tsetse species (group) Human population density Human population density Location of study at which tsetse decline at which tsetse disappear and citation
Glossina morsitans(s) 15–39 people km−2 <39 people km−2 Nigeriaa
G. m. submorsitans, G. longipalpis(s) 14 people km−2 at least by 61 people km−2 Nigeriab
G. m. submorsitans, G. longipalpis(s) unknown at least by 50 people km−2 Togoc
G.m. submorsitans(s) unknown 40% of districts,<40 people km−2 The Gambiad
G. fusca(f) unknown 50 people km−2 Togoc
G. fusca(f) unknown rarely found in areas with Nigeria and Cameroone > 77 people km−2
G. medicorum(f),G. tabaniformis unknown <77 people km−2 Nigeria and Cameroone (f)G. nigrofusca(f)
G. nashi (f), G. haningtoni(f) unknown <38 people km−2 Nigeria and Cameroone
G. palpalis, G. tachinoides(r) low populations at 61 people km−2 unknown Nigeriab
G. palpalis(r) unaffected unaffected Togoc
G. tachinoides(r) populations show gradual Togoc decrease as land becomes
occupied by cultivation aNash, 1948.
bPutt et al., 1980.
cHendrickx, 1999; unpublished data. dRawlings et al., 1993.
eJordan, 1963; Table 2.
people km−2 (authors’ analysis). Of the six species,
only one,G. fusca, was found in areas with more than
77 people km−2. In Uganda, populations ofG. fuscipes
(a forest fly) declined in areas where human popula-tions had recently increased (Okoth, 1982).
By contrast, the riverine flies appear to be largely unaffected by human population density and can even adapt to human-made environments with a few impor-tant exceptions (Jordan, 1986). In Busoga, Uganda, although G. pallidipes (a savanna fly) and G. bre-vipalpis(a forest fly) declined as human populations
increased, another species,G. fuscipes(a riverine fly),
co-existed with people living in dense settlements (Okoth, 1982). In Lafia Division, Nigeria,G. palpalis
and G. tachinoides (also riverine flies) still existed
(although in low numbers) when human populations were 61 km−2 (Putt et al., 1980). Hendrickx (1999)
showed thatG. palpalispopulations are unaffected by
land-use in Togo. However, Hendrickx also showed that populations of G. tachinoides do decrease as
land-use intensifies. Similarly, Bourn (1983) suggests that the removal of riparian forests (which is favoured habitat for riverine flies) will reduce the extent of
riverine flies, especially at the drier limit of their range (where forest is restricted to wet areas).
The relationship between human population density and tsetse populations of savanna and forest flies is re-lated directly to the amount of land under cultivation (and the hunting pressure on wild hosts). In an analy-sis of Zambia, Mali and Burkina Faso, human popula-tion density was related strongly to the amount of land cultivated (Reid and Ellis, 1995; Reid et al., 1995). Below 15 people km−2, an average of 12% of the land
is cultivated in these three countries. Above 39 people km−2, more than two-thirds of the land is cultivated,
and above 78 people km−2, over 95% of the land is
cultivated. In semi-arid West Africa, the practice of fallowing disappears when human populations reach between 50–85 km−2(Goddard et al., 1975).
Synthe-sis of additional data from McIntyre and colleagues (McIntire et al., 1992; pp. 8+9) shows that fallowing
disappears at about 85 people km−2in 33 sites spread
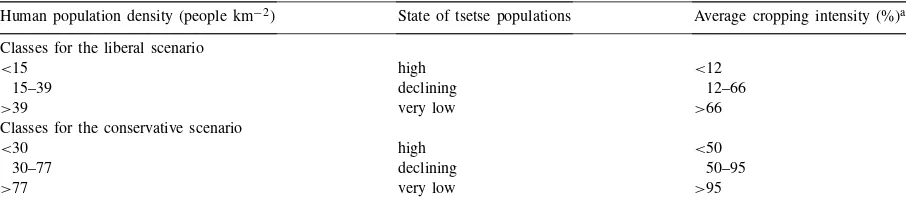
Table 2
The two sets of classes used to create the liberal and conservative scenarios to estimate future tsetse populations
Human population density (people km−2) State of tsetse populations Average cropping intensity (%)a
Classes for the liberal scenario
<15 high <12
15–39 declining 12–66
>39 very low >66
Classes for the conservative scenario
<30 high <50
30–77 declining 50–95
>77 very low >95
aFrom a previous analysis of the relationship between human population densities and cropping-use intensity for Zambia, Mali and Burkina Faso (Reid and Ellis, 1995; Reid et al., 1995).
In summary, populations of savanna flies decline when human populations rise above 15 km−2and
dis-appear altogether when they reach between 40 and 60 people km−2. Many species of forest fly disappear
when human densities rise to between 38 and 77 peo-ple km−2. In some areas, riverine flies decline before
human populations reach 60 km−2, whereas in others,
their populations are unaffected by human population density. These ranges were used to create two sets of classes (one liberal, one conservative) that bracket the quantitative data depicting the relationship between human and tsetse populations (Table 2). The next sec-tion describes the results of the applicasec-tion of these classes to develop future scenarios of populations of savanna and forest flies.
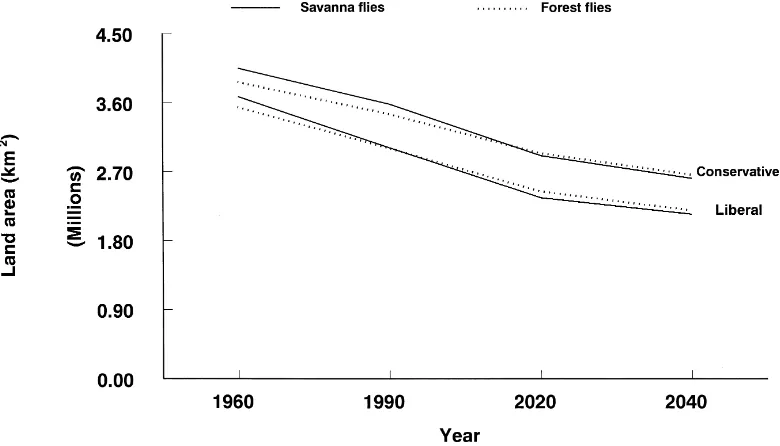
3.2. Future scenarios of fly populations
By the year 2040, the distribution of tsetse flies will contract in different areas across Africa, but will not disappear (Figs. 1, 2). About 50–60% of the 8 mil-lion km2 currently infested with these flies will sus-tain high fly populations and an additional 15–20% of the area will support moderate fly populations. The greatest decline and contraction in savanna fly popu-lations will occur in West Africa, the Lake Victoria Basin, northwestern Uganda, the coastal areas of East and southern Africa, and parts of central Africa (see black and dark gray, Fig. 1). Significant populations will remain in eastern, central, and southern Africa (see light gray, Fig. 1). Forest flies will disappear from most of coastal West Africa and large patches of the central African interior. The small patches of forest flies currently infesting eastern and southern Africa
may disappear entirely by 2040. The liberal and con-servative scenarios principally differ in the speed that tsetse populations decline over time rather than in the location of this decline.
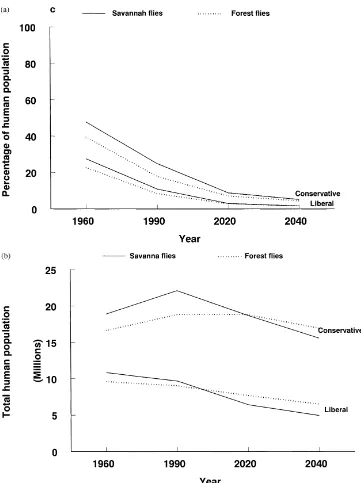
The percentage of people within the original fly dis-tributions who will remain in contact with high pop-ulations of savanna and forest flies will decrease sub-stantially in the future (Fig. 3a). In 1960, about a third of rural Africans lived in scattered settlements where savanna and forest tsetse populations were high; this will fall to about 5% by 2040. Most people (95%) will live in areas free of savanna and forest flies.
Even though a smaller proportion of people will live in contact with savanna and forest flies in the future, the total number of people in these zones will not de-crease greatly between 1960 and 2040 (Fig. 3b). In 1960, 10–20 million people lived in areas with these flies; by 2040, 5–17 million people will still live in these fly-infested areas. Consequently, millions of peo-ple and their livestock will still be at risk of contract-ing trypanosomosis.
4. Discussion
Fig. 1. Future scenarios of the effect of human population growth on savanna and forest flies, showing both liberal and conservative scenarios.
Fig. 3. Two scenarios of the percentage (a) and number (b) of people who have lived or may live in areas with high populations of savanna and forest flies between 1960 and 2040.
In other areas, the disease that the fly transmits only slows the spread of agriculture, rather than preventing its spread altogether (Erdelen et al., 1994). Thus, the decline and extinction of the tsetse fly is having from
moderate to strong effects on the state of ecosystems across the continent.
there will be significant shifts in the type and distri-butions of flies present. Savanna and forest flies will be in decline all over Africa; some species in these groups may approach extinction. In contrast, riverine flies appear to be affected little or not at all by hu-man population growth and are thus likely to remain extant indefinitely. Nearly 7 million km2will remain infested with riverine flies in 2040, an area signifi-cantly larger than Europe (assuming that the riverine fly distribution mapped by Ford and Katondo (1977) remains unchanged in the future). These areas are in western and central Africa; no riverine flies ex-ist in eastern and southern Africa. It is, thus, only in eastern and southern Africa that human popula-tion growth may eradicate the fly from some areas altogether.
Despite the reduction of many tsetse fly species, human population growth will only cause a 7% con-traction in the overall tsetse fly distribution by 2040 (solely in areas with no riverine flies). Veterinary pro-grams currently control the fly over about 1% of the total area infested in eastern and southern Africa (All-sop, 1999). Barring breakthroughs in control, tsetse flies will be widespread in Africa for a considerable time.
How might the reduction of tsetse vectors affect the incidence of human trypanosomosis in the future? The severe form of sleeping sickness is transmitted by savanna flies (Trypanosoma brucei rhodesiense)
whereas the chronic form (T.b. gambiense) is
trans-mitted by riverine flies (Jordan, 1986). Thus, only the severe form, transmitted by savanna flies, will be affected by human population growth. This reduction will only occur in eastern and southern Africa where the severe form is found.
In contrast to human sleeping sickness, animal try-panosomosis is found throughout the 10 million km2 of Africa infested with tsetse flies (Jahnke et al., 1988). A reduction of tsetse fly populations by human popula-tion growth should enhance livestock health if the dis-tribution of livestock follows that of people. Evidence suggests that it does. The density of tropical livestock units (TLU’s) in five African countries was positively correlated with both the percentage of land cultivated and the human habitation density (Bourn and Wint, 1994). A GIS analysis by the authors showed a sig-nificant positive correlation (r=0.55) between human
and livestock population densities for the continent.
The results shown here for people are thus probably also applicable to livestock.
That savanna flies are more affected by human pop-ulation growth than forest or riverine flies has large significance. Of the three groups, these flies not only transmit the severe form of human sleeping sickness, but they have the highest trypanosome infection rates (Putt et al., 1980; infection rates of 20–25% for sa-vanna flies, 3–25% for forest flies and 5% for river-ine flies) and thus are the most efficient vectors of trypanosomosis. Moreover, these species can be dif-ficult to trap (Jordan, 1986), and so the options for control are correspondingly limited. Human popula-tion growth will consequently have the greatest effect on the most efficient vectors of the disease and cause a greater proportional decrease in trypanosomosis risk than would be expected simply from a consideration of the area infested.
Despite the logic of the inverse relationship between human and tsetse populations, there will be exceptions to this pattern. Flies may be abundant in heavily pop-ulated areas because of the existence of small but cru-cial patches of tsetse habitat (Rawlings et al., 1993).
G. pallidipes, a savanna fly, survived in low numbers in
heavily cultivated areas among remnant trees in Tanza-nia (Swynnerton, 1936). Felling of forest and repeated burning by encroaching human populations can create ideal new habitats for savanna flies (Jordan, 1986). In Togo (Hendrickx, 1999), even thoughG. tachinoides
populations declined as human populations grew, the prevalence of trypanosomosis in cattle remained a se-rious problem. As more and more land was cropped, cattle were pushed into marginal riverine habitats and thus came into increased contact with tsetse.
Over the shorter term, the predicted disappearance of tsetse fly populations from some areas will increase human and livestock welfare both directly, through better health, and indirectly, through better food pro-duction resulting from greater use of livestock. The longer term costs and benefits of regional disappear-ances of the fly are unknown. But reliable human pop-ulation growth rates for Africa are now available to help predict where and when ecosystems will change, and thus scientists are better placed to determine the long-term costs and benefits of changes on the con-tinent. This higher-quality research information is ur-gently needed by decision-makers, who face increas-ingly hard choices as human populations grow and the pressures on ecosystems escalate.
Acknowledgements
The authors thank B. Perry, J. Ellis, B. Swallow, J. Slingenburgh, and G. Hendrickx for stimulating dis-cussions during the course of this work, O. Okello for excellent technical assistance, and J. McDermott and S. MacMillan for thoughtful reviews. The work was partially supported by grants from the Rockefeller Foundation and the International Fund for Agricultural Development (IFAD) to R.S.R and R.L.K.
References
Allsop, R., 1999. Implementation of odour bait techniques for the control of tsetse flies in eastern and southern Africa. In: Proceedings of the 24th Meeting of the International Scientific Council for Trypanosomiasis Research and Control, Maputo, Mozambique. OAU/ISCTRC, Nairobi, Kenya, pp. 411–426. Baldry, D.A., 1970. Observations on the peri-domestic breeding
behaviour and resting sites of Glossina tachinoides Westw. near Nsukka, East Central State. Nigeria. Bull. Ent. Res. 59, 585– 593.
Bourn, D., 1983. Tsetse control, agricultural expansion and environmental change in Nigeria, Ph.D. Thesis. University of Oxford, UK.
Bourn, D., Wint, W., 1994. Livestock, land use and agricultural intensification in sub-Saharan Africa. Pastoral Development Network Paper No. 37a, ODI, London, UK.
Deichmann, U., 1996. Africa Population Database, Digital Database and Documentation. University of California, Santa Barbara, CA, USA.
Ehrlich, P.R., 1988. The loss of diversity: causes and consequences. In: Wilson, E.O., Peter, F.M. (Eds.), Biodiversity. National Academic Press, Washington, D.C, pp. 21–27.
Erdelen, W., Nagel, P., Peveling, R., 1994. Tsetse control, land use dynamics and human impact on natural ecosystems A conceptual framework and preliminary results of an interdisciplinary research project in Ivory Coast West Africa. App. Geog. Dev. 44, 17–31.
Foote, K.A., Hill, K.H., Martin, L.G. (Eds.), 1993. Demographic Change in Sub-Saharan Africa. National Academy Press, Washington D.C., USA
Ford, J., 1971. The Role of the Trypanosomiases in African Ecology. Clarendon Press, Oxford, UK.
Ford, J., Katondo, K.M., 1977. Maps of tsetse flies (Glossina) distribution in Africa, 1973, according to sub-generic groups on scale of 1 : 5,000,000 (plus a set of 9 maps in colour). Bull. Anim. Hlth. Prod. Afr. 2, 187–193.
Goddard, A.D., Mortimore, M.J., Norman, D.W., 1975. Some social and economic implications of population growth in rural Hausaland. In: Caldwell, J.C. (Ed.), Population Growth and Socio-Economic Change in West Africa. Columbia University Press, New York (Chapter 15).
Gouteux, J.-P., Laviessière, C., Boreham, P.F.L., 1982. Écologie des glossines en secteur pré-forestier de Côte d’Ivoire 2. Les preferences trophiques deGlossina palpaliss.l. Cah. ORSTOM sér. Ent. méd. Parasit. 20, 3–18.
Hendrickx, G., 1999. A geo-referenced decision support methodology towards trypanosomosis management in west Africa, Ph.D. Thesis. University of Gent, Gent, Belgium. Hendrickx, G., Napala, A., 1997. Le contrôle de la trypanosomose
‘à la carte’: une approche intégrée basée sur un Système d’Information Géographique. Académie Royale des Sciences d’Outre Mer – Mémoires Classe Sciences Naturelles & Médédicales, in 8ième, Nouvelle Série, Tome 24–2, Bruxelles, Belgique, 100 pp.
Holling, C.S., Schindler, D.W., Walker, B.H., Roughgarden, J., 1995. Biodiversity and the functioning of ecosystems: an ecological synthesis. In: Perrings, C., Maler, K.-G., Folke, C., Holling, C.S., Jansson, B.-O. (Eds.), Biodiversity Loss. Cambridge University Press, Cambridge, UK.
Jahnke, H.E., Tacher, G., Keil, P., Rojat, D., 1988. Livestock Production in Tsetse-Affected Areas of Africa. ILCA/ILRAD, Nairobi, Kenya, pp. 3–21.
Jordan, A.M., 1963. The distribution of the fusca group of tsetse flies (Glossina) in Nigeria and West Cameroon. Bull Ent. Res. 54, 307–323.
Jordan, A.M., 1986. Trypanosomiasis Control and African Rural Development. Longman, London, UK.
Katondo, K.M., 1984. Revision of second edition of tsetse distribution maps. An interim report. Insect Sci. Applic. 5, 381–388.
McIntire, J., Bourzat, D., Pingali, P., 1992. Crop-Livestock Interaction in Sub-Saharan Africa. World Bank, Washington, D.C, USA.
Nash, T.A.M., 1948. The Tsetse Flies of British West Africa. His Majesty’s Stationary Office, London, UK.
Okoth, J.O., 1982. Further observations on the composition of Glossina population at Lugala, South Busoga. Uganda. E. Afr. Med. J. 59, 582–584.
occurred in West Africa and how its progress might be halted. J. Arid Environ. 1, 357–379.
Ormerod, W.E., 1986. A critical study of the policy of tsetse eradication. Land Use Policy 3, 85–99.
Ormerod, W.E., 1990. Africa with and without tsetse. Insect. Sci. Applic. 11, 455–461.
Putt, S.N.H., Shaw, A.P.M., Mathewman, R.W., Bourn, D.M., Underwood, M., James, A.D., Hallam, M.J., Ellis, P.R., 1980. The Social and Economic Implications of Trypanosomiasis Control. A Study of its Impact on Livestock Production and Rural Development in Northern Nigeria. Veterinary Epidemiology and Economics Unit, University of Reading, Reading, UK.
Rawlings, P., Ceesay, M.L., Wacher, T.J., Snow, W.F., 1993. The distribution of the tsetse fliesGlossina morsitans submorsitans
and G. palpalis gambiensis (Diptera: Glossinidae) in The Gambia and the application of survey results to tsetse and trypanosomiasis control. Bull Ent. Res. 83, 625–632. Reid, R.S., 1999. Impacts of trypanosomosis on land-use and
the environment in Africa: state of our knowledge and future directions. In: Proceedings of the 24th Meeting of the International Scientific Council for Trypanosomiasis Research and Control, Maputo, Mozambique. OAU/ISCTRC, Nairobi, Kenya, pp. 500–514.
Reid, R.S., Ellis, J.E., 1995. The environmental implications of
controlling tsetse-transmitted trypanosomiasis. Final Report to the Rockefeller Foundation, ILRI, Nairobi, Kenya, 49 pp. Reid, R.S., Kruska, R.L., Perry, B.D., Ellis, J.E., Wilson,
C.J., 1995. Environmental impacts of trypanosomiasis control: conceptual model, approach and preliminary results of studying indirect effects through changes in land-use. In: Sones, K. (Ed.), Proceedings of 22nd Meeting of the International Scientific Council for Trypanosomiasis Research and Control. OAU/ISCTRC, Nairobi, Kenya, pp. 235–243.
Reid, R.S., Kruska, R.L., Muthui, N., Taye, A., Wotton, S., Wilson, C.J., Woudyalew M., 1999. Land-use and land-cover dynamics in response to changes in climatic, biological and socio-political forces: method development and a test case in southwestern Ethiopia. Landscape Ecology, in press
Swynnerton, R.J.M., 1936. The tsetse flies of East Africa. Trans. Roy. Ent. Soc. London 84, 1–679.
United Nations, 1997. World Population Prospects: The 1996 Revision. United Nations, New York, NY, USA.
WHO/FAO, 1979. Report of an Joint WHO Expert Committee and FAO Expert Consultation. World Health Organization, Geneva. Wilson, E.O., 1992. The Diversity of Life. Belknap Press,
Cambridge, MA, USA.