INTEGRATION OF POINT CLOUDS DATASET FROM DIFFERENT SENSORS
C.K.A.F. Che Ku Abdullah, N.Z.S Baharuddin, M.F.M. Ariff, Z. Majid, C.L. Lau, A.R. Yusoff, K.M. Idris, A. Aspuri
Department of Geoinformation, Faculty of Geoinformation and Real Estate, Universiti
Teknologi Malaysia, UTM Skudai, Malaysia – (ckfuad2419, aryonnnzs83, lauchongluh, ahmadrazali89, drzulmajid)@gmail.com (mfaridma, khairulnizami, anuaraspuri)@utm.my
Commission II
KEY WORDS: laser scanners, Airborne Laser Scanner (ALS), Terrestrial Laser Scanner (TLS), accuracy assessment, three dimensional (3D) model
ABSTRACT:
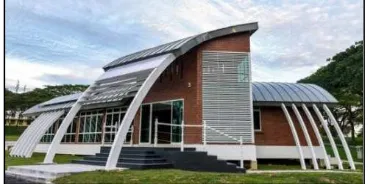
Laser Scanner technology become an option in the process of collecting data nowadays. It is composed of Airborne Laser Scanner (ALS) and Terrestrial Laser Scanner (TLS). ALS like Phoenix AL3-32 can provide accurate information from the viewpoint of rooftop while TLS as Leica C10 can provide complete data for building facade. However if both are integrated, it is able to produce more accurate data.The focus of this study is to integrate both types of data acquisition of ALS and TLS and determine the accuracy of the data obtained. The final results acquired will be used to generate models of three-dimensional (3D) buildings.The scope of this study is focusing on data acquisition of UTM Eco-home through laser scanning methods such as ALS which scanning on the roof and the TLS which scanning on building façade. Both device is used to ensure that no part of the building that are not scanned. In data integration process, both are registered by the selected points among the man-made features which are clearly visible in Cyclone 7.3 software. The accuracy of integrated data is determined based on the accuracy assessment which is carried out using man-made registration methods. The result of integration process can achieve below 0.04m. This integrated data then are used to generate a 3D model of UTM Eco-home building using SketchUp software. In conclusion, the combination of the data acquisition integration between ALS and TLS would produce the accurate integrated data and able to use for generate a 3D model of UTM eco-home. For visualization purposes, the 3D building model which generated is prepared in Level of Detail 3 (LOD3) which recommended by City Geographic Mark-Up Language (CityGML).
1. INTRODUCTION
Rapid development in the city has established development and skyscrapers with unique architecture. With the high population density and limited land space, better technology is needed in the management and construction of the future. Thus laser technology has been applied in the measurement.
Laser scanning is contactless technology using laser light used to obtain information of the physical object and digitally stored in the form of point cloud (Frohlich & Mettenleiter, 2004). The capability of data acquisition in point cloud form contains the coordinate value and in high accuracy capable to regenerating the scanned model in the form of 3D models accurately.
ALS is an active remote sensing technology that able to collect data from a wide area (Shan & Toth, 2008). The used of ALS to observe from difference heights has developed the maximum uses of ALS technologies in various fields. Thus this technologies is widely used in 3D city models, in agriculture, city planning, and many more (Mohammed, 2015).
Staiger (2003) stipulates that TLS is recently so useful for measurements in the field with allows data obtained quickly and efficiently in a form of point clouds. TLS have different type of resolution selection for data acquisition such as high, medium, and low. The resolution give the different dense of point cloud data. The
high resolution is the dense of the data with more information of the building.
Data integration means combination data from various sources and to provide users with a unified view of data. According to Zhang (2010) data integration typically includes the combining of the multidisciplinary data from various sources to produce quality data. Integrated data from multiple sources can improve information and facilitate the data processing task (Gruen et al., 2013).
One of the study from (Chhatkuli et al., 2015) has shown the integrated data process using point cloud from RGB imageries to derived 3D model. This study create a detailed 3D model in better accuracy and good result. It is the reason of forestry tend to use the integration data as for tree modelling and mapping of wide area purposes (Kankare et al., 2015; Jones et al., 2016). For 3D modelling of the building, complete data from building facade until the rooftop is emphasized because from the 3D model of the building can be applied for other uses such as as-built, building information modeling (BIM), documentation of historical building (Kedzierski et al., 2015), 3D city modelling and others.
The methodology of this study describe on how this study conducted from planning stage, processing and finally get the result. To ensure the methodology is in the right track, objective of this study need to be clear and understand. The methodology of this study are divided into four (4) phases which are:
i. Phase I : Preliminary phase. ii. Phase II : Data acquisition phase. iii. Phase III : Data processing phase. iv. Phase IV : Accuracy assessment phase.
2.1 Preliminary phase
Preliminary phase concerning on the preparing and planning stage using in this study. This phase ensuring the instrument used are appropriate with the study. Besides that, the processing stage need to determine properly so that it meets the objective of the study. Previous study need to refer to get an idea on how the study conducted and guided to achieve the aim of the study.
2.2 Data acquisition phase.
In this phase explaining on how collecting data in field using appropriate instruments. The ALS and TLS are using in this study to collect the data in field and each instrument have its own capability.
In this study, ALS is using to scanning the top of the Eco-home building. Before the scanning process, the instrument need to be check the GPS connection and the IMU on board are in good condition. This checking to ensure the scanning process as planned and capable to scan the entire rooftop of the Eco-home building.
Leica ScanStation C10 used for TLS collecting data of scanning the façade of the Eco-home building. The capability of Leica ScanStation C10 to collect the data with suitable range, high speed laser scanner and friendly user is consistent with this study. The Leica ScanStation C10 comes with camera and optional of scanning resolution makes the data collection work easy, save time and accurate. Figure 4 shows the Leica ScanStation C10 used in this study. The Leica ScanStation C10 scanning process used with spherical target for registration purposes. In this study, 10 spherical target used to cover the façade of the Eco-home building during scanning process. Figure 5 shows the spherical target used in this study.
The scanning process used 4 scan station with 10 spherical target to cover the façade of the Eco-home building. The scan station need to plan properly to make sure no area not to be scan and minimize the scanning work. The data collection from Leica ScanStation C10 imported directly into Cyclone software for processing such as registration and integration. Figure 6 shows the data successful imported to Cyclone software from different scan station.
Figure 2. The concept of ALS in collecting data in field. Sources : (Höfle & Rutzinger, 2011)
Figure 3. Aerial LiDAR Phoenix AL3-32. Sources: www.phoenixlidar.com
Figure 4. Leica ScanStation C10. Sources:
hds.leica-geosystems.com
2.3 Data Processing Phase.
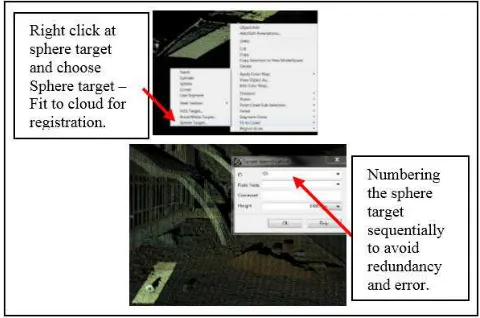
The different scan station give the different view of Eco-home building and to make it only 1 view, the registration process need to be done using spherical target used in this study. The Cyclone software capable to do registration process and recognize the spherical target automatically. Figure 7 shows the registration process for all 4 scan station.
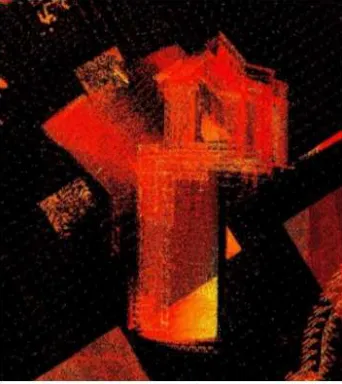
Registration process is done by clicking the center of the spherical target and automatically recognize by Cyclone software as a target registration. The registration process done from station to station systematically to avoid redundant registration. Finishing the registration process for all 4 scan station, data well unify from 4 view to 1 view only. Figure 8 shows the façade of the Eco-home building after registration process and cleaning process.
Ensuring the unify data is accurate, constraints ID need to be review to check the registration error. Figure 9 shows the result of registration process by giving the constraints ID error. The result is accurate where most of the registration point give error below than 0.005m.
The data from ALS is represent in LASer (LAS) format by using Quick Terrain Modeler software. The LAS format enable user to view, process and analyze the compact dense of point cloud from laser scanner instrument in accordance to this study. The LAS format data imported into Cyclone software for integration process with TLS data. Figure 10 shows the top view of LAS format data from ALS successful imported into Cyclone software.
Figure 6. The different scan station scanning the façade of the Eco-home building.
Figure 9. Accuracy of registration process. The result shows the accuracy can achieve below than 0.005m. Figure 8. The façade of Eco-home building unify well
After completing registration process for TLS data and imported process for ALS data into Cyclone software, the integration process from TLS and ALS is made through the registration method by using man-made. The registration using man-made is chosen due to the most prominent elements from both dataset. Selected examples of man-made for integration purposes such as street corner, building corner, roof edges, vertices window or door and others. Figure 11 shows the integration process for both dataset.
3. RESULT AND ANALYSIS
The result and analysis need to explained more to make sure the process is keep in track and qualified to use for other purposes for example 3D city modelling, forestry mapping, historical documentation and many more.
3.1 Result
The result from the integration can be used to generate 3D model of Eco-home building. Before generate the 3D model, the integration process already revised the level of accuracy before. Figure 13 shows the integration of ALS and TLS from different view of Eco-home building. Blue points cloud is from ALS and others points cloud is from TLS.
Figure 10. LAS format data from ALS successful imported in Cyclone 7.3 software.
Figure 11. The integration process for ALS and TLS dataset using man-made registration method.
Figure 12. The result of integration process for all 7 points of man-made can achieve below 0.04m.
Side view of Eco-home
Front view of Eco-home
Building
Top view of Eco-home
3.2 Analysis
The integration data have to go through the accuracy assessment process to ensure the accuracy of the data in high-quality. The analysis carried out by making a comparison between the integration data with field work dimension survey using total station. Field work dimension survey is used as a bench mark for comparing process where the example of dimension used such as measurement of floor, door, window, balconies, stairs and many others. These measurement were taken from integration data and field work data for comparing process. Figure 14 shows the selected measurement taken for comparing process from integration data.
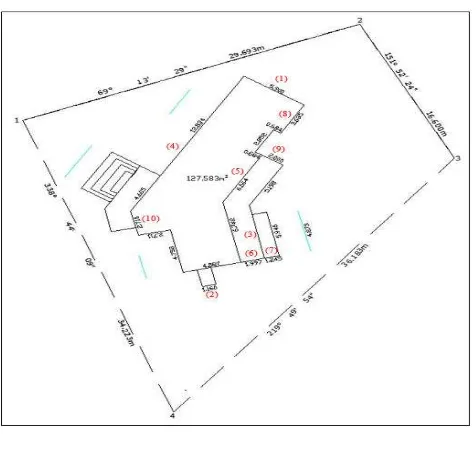
The field work dimension survey using total station is measure the Eco-home building and the data is generate in 2D drawing using AutoCAD software. The measurement from field work give bearing and distance collected using total station. Figure 15 shows the 2D drawing of field work in AutoCAD.
The comparison process used 20 dimension of Eco-home building from integration data and field work data because these dimension is obviously can be measured in both dataset. The 20 samples from both dataset is calculated to get the error and the error is used to get the reasonable conclusion either the result of integration give high-accuracy or vice versa. Refer to the table 1 below, the value of residual from both dataset.
Based on the table above, the differences can be present in graph. The graph obtained 20 samples of dimension from both dataset and from the graph can be conclude that the differences was found has slight variation and intangible. Figure 16 shows the graph of residual error.
Besides calculated the residual error of both dataset, from 20 samples of dimension can get the mean of sample, variance of sample and standard deviation of sample value. These value is used for decision making either the integration dataset have significant different or otherwise compared with field work dimension survey. The hypothesis testing is used for decision making in this study where the significant level used is α = 0.005 because it shows the
Samples Point
Figure 14. A part of measurement used for the comparison purpose. The 1 and 2 are measurement of dimension of floor
while 3 and 4 are measurement of stairs and window size.
Figure 15. The 2D drawing from field work dimension survey.
Table 1. Residual value from integration data and field work data.
The decision making of hypothesis testing, if t value < -t critical two tail or t value > t critical two tail, rejected the null hypothesis. In this case, -2.10092204 < 1.164239487 < 2.10092204, therefore failed to reject the null hypothesis. The difference between 2 dataset is not convincing enough to say that the measurement between integration data and field work dimension survey have significant different. The conclusion from the hypothesis testing can be conclude that the result from integration data have no significant different compared with field work dimension survey using total station and it is correct decision. That’s mean the integration data is able to achieve high-accuracy and can used for other purposes.
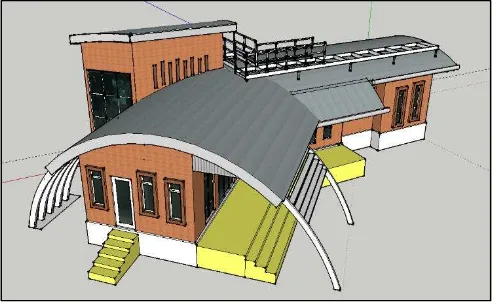
After being satisfied with the integration result obtained, the integration data generated in 3D model as a final product of this study. Sketch Up software is using to generate the integration data to 3D model of Eco-home building in LOD3. Figure 17 shows the 3D model of Eco-home building as a final product of integration points cloud process.
The quality of 3D model must meet the requirements LOD3, where specified accuracy is 0.5m (Bryan, 2000).
From the study, there are some recommendation that can be consider for further study. GPS values can be included in TLS ground control point station to get the exact position of point cloud data. So it can use for integration data process of point cloud using the coordinate value. Filtering process must be carried out to remove the outliers and avoid the problem during the processing stage due to high dense of point cloud due to multi-sensor combination. In future, the integration technique can be applied using multiple sensors by using the similar method. The data of interior building, façade of the building and roof top of the building from multiple sensor can be integrate to give more information and can be applied to other fields. This can increase the data collection with more detail of the object and information. This advantages can be expand for many more application in various field.
ACKNOWLEDGEMENT
Ministry of Higher Education (MOHE), and Faculty of Geoinformation & Real Estate, Universiti Teknologi Malaysia (UTM) are greatly acknowledged. The authors also would like to thank the Infocomm Research Alliance (IcRA), Universiti Teknologi Malaysia for providing the fund from vote number Q.J130000.2527.4L149 to enable this study is carried out.
REFERENCES
Bryan, P., and Blake, B., 2000. Metric survey specifications for English heritage: English Heritage.
Chhatkuli, S., Satoh, T., & Tachibana, K., 2015. Multi Sensor Data Integration for AN Accurate 3d Model Generation. The International Archives of Photogrammetry, Remote Sensing and Spatial Information Sciences, 40(4), pp. 103.
Fröhlich, C., and Mettenleiter, M., 2004. Terrestrial laser scanning–new perspectives in 3D surveying. International archives of photogrammetry, remote sensing and spatial information sciences, 36(Part 8), W2, pp. 7-13.
Gruen, A., Huang, X., Qin, R., Du, T., Fang, W., Boavida, J., & Oliveira, A., 2013. Joint processing of UAV imagery and terrestrial mobile mapping system data for very high resolution
city modeling. Int. Arch. Photegramm. Remote Sens. Spat. Inf.
Sci, pp. 175-182.
Jones, T., Marzen, L., & Chappelka, A., 2016. Mapping, Modeling, and Estimating Tree Measurements of Urban Tree Canopy Structure Using Terrestrial LiDAR Scanning. Papers in Applied Geography, pp. 1-7.
Kankare, V., Liang, X., Vastaranta, M., Yu, X., Holopainen, M., & Hyyppä, J., 2015. Diameter distribution estimation with laser scanning based multisource single tree inventory. ISPRS Journal of Photogrammetry and Remote Sensing, 108, pp. 161-171.
Kedzierski, M., Fryskowska, A., Wierzbicki, D., Dabrowska, M., & Grochala, A., 2015. Impact of the method of registering Terrestrial Laser Scanning data on the quality of documenting
cultural heritage structures. The International Archives of
Photogrammetry, Remote Sensing and Spatial Information Sciences, 40(5), pp. 245.
Mohammed, H., 2015. Fusion of Terrestrial and Airborne Laser Data for 3D Modeling Applications (Doctoral dissertation, University of Calgary).
Shan, J., and Toth, C. K., 2008. Topographic laser ranging and scanning: principles and processing: CRC press, pp. 2-3
Staiger, R., 2003. Terrestrial laser scanning technology, systems and applications. Paper presented at the 2nd FIG Regional Conference Marrakech, Morocco http:// http://www.fig.net/ news/archive/news_2004/morocco_conf/report.asp (28 Nov. 2016).