PLÉIADES PROJECT: ASSESSMENT OF GEOREFERENCING ACCURACY, IMAGE
QUALITY, PANSHARPENING PERFORMENCE AND DSM/DTM QUALITY
Hüseyin Topan a *, Ali Cam a, Mustafa Özendi a , Murat Oruç a , Karsten Jacobsen b, Talha Taşkanat c
a BEU, Engineering Faculty, Department of Geomatics Engineering, 67100 Zonguldak, Turkey - ([email protected], [email protected], [email protected], [email protected])
b Leibniz University Hannover, Institute of Photogrammetry and GeoInformation, Hannover, Germany - ([email protected])
c Erciyes University, Engineering Faculty, Department of Geomatics Engineering, Kayseri, Turkey - ([email protected])
Commission I, WG I/5
KEY WORDS: Pléiades, Georeferencing Accuracy, Image Quality, Pansharpening, DSM/DTM
ABSTRACT:
Pléiades 1A and 1B are twin optical satellites of Optical and Radar Federated Earth Observation (ORFEO) program jointly running by France and Italy. They are the first satellites of Europe with sub-meter resolution. Airbus DS (formerly Astrium Geo) runs a MyGIC (formerly Pléiades Users Group) program to validate Pléiades images worldwide for various application purposes. The authors conduct three projects, one is within this program, the second is supported by BEU Scientific Research Project Program, and the third is supported by TÜBİTAK. Assessment of georeferencing accuracy, image quality, pansharpening performance and Digital Surface Model/Digital Terrain Model (DSM/DTM) quality subjects are investigated in these projects. For these purposes, triplet panchromatic (50 cm Ground Sampling Distance (GSD)) and VNIR (2 m GSD) Pléiades 1A images were investigated over Zonguldak test site (Turkey) which is urbanised, mountainous and covered by dense forest.
The georeferencing accuracy was estimated with a standard deviation in X and Y (SX, SY) in the range of 0.45m by bias corrected Rational Polynomial Coefficient (RPC) orientation, using ~170 Ground Control Points (GCPs). 3D standard deviation of ±0.44m in X, ±0.51m in Y, and ±1.82m in Z directions have been reached in spite of the very narrow angle of convergence by bias corrected RPC orientation. The image quality was also investigated with respect to effective resolution, Signal to Noise Ratio (SNR) and blur coefficient. The effective resolution was estimated with factor slightly below 1.0, meaning that the image quality corresponds to the nominal resolution of 50cm. The blur coefficients were achieved between 0.39-0.46 for triplet panchromatic images, indicating a satisfying image quality. SNR is in the range of other comparable space borne images which may be caused by de-noising of Pléiades images. The pansharpened images were generated by various methods, and are validated by most common statistical metrics and also visual interpretation. The generated DSM and DTM were achieved with ±1.6m standard deviation in Z (SZ) in relation to a reference DTM.
1. INTRODUCTION
1.1 Pléiades and Related Projects
Following the successful launch in December 17th 2011 and, December 2nd2012, Pléiades 1A and 1B became the first sub-meter EO satellites of Europe’s with 70cm original and 50cm resampled GSD in panchromatic band within the joint program of ORFEO between France and Italy. SPOT (Satellite Pour l'Observation de la Terre) 6 and 7 completed the constellation with launches in September 9th 2012 and in June 30th 2014, respectively.
At the ISPRS XXIIth Congress held in Melbourne (2012) Astrium Geo Services (renamed as Airbus Defence and Space) announced the Pléiades Users Group Program (renamed as MyGIC), receiving 180 project proposals worldwide. 120 of total 180, and 1 of 3 from Turkey were approved (Airbus, 2016). In addition, one project supported by BEU (Project ID: 2014-47912266-01), and the one research project subjecting the Pléiades images was completed within TÜBİTAK 1001 program (Project ID: 114Y380).
* Corresponding author
1.2 Research Scopes and Test Site
The common geospatial applications such as georeferencing accuracy assessment, pansharpened image generation and validation, and the DSM/DTM generation, and also the radiometric evaluation were carried out over Zonguldak test field (Turkey). The academic software, epix and SharpQ, were developed and the existing GeoEtrim and BLUH were updated during the investigations.
The main characteristics of Zonguldak test site are its mountainous and extremely undulating topography, dense forest and agricultural areas, various water bodies and open mining areas (Figure 1).
The Zonguldak City centre is also settled on this undulating mountainous topography (Figure 2). Such kind of various land covers and undulating topography makes this test site an important for evaluation with respect to the geospatial applications.
Figure 1. Zonguldak city centre and its inland
Figure 2. A scene from Zonguldak city centre
1.3 Investigated images
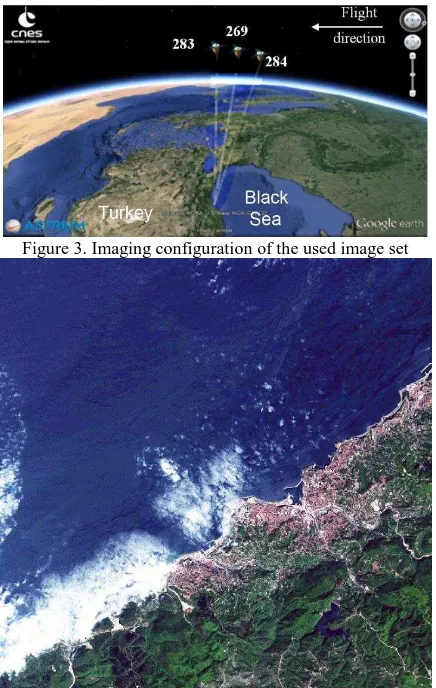
Two set of triple stereo images in primary level were downloaded within the context of MyGIC project. Figure 3 illustrates the imaging configuration and Figure 4 shows one sample image of triplet set which is investigated in these projects. The other triplet set was ignored since it covers out of Zonguldak City centre. Table 1 presents the main characteristics of used images.
Figure 3. Imaging configuration of the used image set
Figure 4. Sample of Pleiades images
Image ID 269 283 284 Table 1. Main characteristics of used images.
2. ANALYSIS
2.1 Georeferencing Accuracy Assessment
2.1.1 Absolute Accuracy: The direct sensor orientation of the
used Pleiades 1A images is specified with 8.5m CE90 corresponding to SX=SY=4m. The georeferencing accuracy of direct sensor orientation based on Pléiades sensor model were estimated by ~170 GCPs (Table 2), satisfying the accuracy
Table 2. Georeferencing accuracy of sensor-based direct orientation model without adjustment (±m)
2.1.2 2D Accuracy: The major limitation of the discrepancies of
the used approximately 170 ground control points is the point identification in the images. By bias corrected RPC-orientation of the individual images, the GCP heights are fixed and only standard deviations in X and Y can be determined (Table 3). A bias correction by 2D affine transformation was required, most affine coefficients are significant. Nevertheless, if the bias correction is reduced just to a shift in X and Y, the standard deviations are just approximately 5% higher.
Scene # GCP SX SY
283 168 0.42m 0.49m
269 171 0.45m 0.48m
284 170 0.44m 0.48m
Table 3. Summary of root mean square differences at GCPs
2D accuracies at Figure Condition Points (FCPs) in image domain shown in Table 4 are the combination of accuracy of both GCP and DTM on orthoimage’s accuracy, estimated by figure condition concept (see Topan et al. (2014a) for more details). Bias compensation models are required, as mentioned above, and presented similar results. The FC accuracy presented in Figure 5 was the best at the geometric centre of GCPs and were propagated through outer part of the centre accompanying with height change.
Accuracies at GCPs
Bias Comp. Model No Sim/Aff.
Standard deviation 7.4 1.1
m0 6.4 0.8
Accuracies at FCPs
minimum 2.5 0.3
maximum 22.0 2.7
Table 4. Summary of the accuracies at GCPs and FCPs for 1st degree RFM (± pixel).
Zonguldak
2.1.3 3D Accuracy: The 3D georeferencing accuracy was
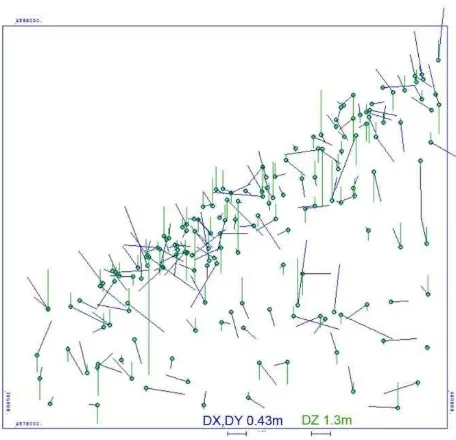
estimated via bias corrected RPC orientation using ~170 GCPs. The bias correction applying only the shift parameter instead of all affine parameters increases the standard deviation 4% in X and Y directions. Most affine parameters were significant and must be considered in bias compensation. An improvement of the view direction did not reduce the standard deviation (Jacobsen, 2015). Table 5 presents the accuracies and Figure 6 illustrates the error vectors at GCPs for stereo set 283-284.
Stereo pairs SX SY SZ
283-284 0.43m 0.49m 1.08m
283-269 0.44m 0.48m 2.15m
269-284 0.46m 0.56m 2.04m
Table 5. 3D georeferencing accuracy by bias corrected RPC-orientation
Figure 6. Error vectors at GCPs derived by RPC-orientation for stereo combination 283-284
2.2 Image Quality and Radiometric Evaluation
2.2.1 Effective ground resolution: The effective GSD was
determined by edge analysis (Jacobsen et al. 2014). The factor for effective resolution is in the range between 0.9 and 1.0. This means the effective resolution is even a little better as the nominal resolution even related to 50cm panchromatic GSD respectively 2m multispectral GSD in spite of the physical resolution of just 70cm respectively 2.4m. This is only possible with good original images and very good image restitution. The effect of deconvolution process is very good (Cam et al., 2014; Jacobsen et al., 2014). Nevertheless, this process increases the noise but also a de-noising process is applied by the vendor (Airbus, 2012). The developed program, epix, can be used for the effective GSD analysis with several options (Topan et al., 2014b)
2.2.2 Blur Analysis: The blur analysis suggested by
Crété-Roffet (2007) compares the original image with the smoothed version by average filter which is applied separately in horizontal and vertical direction with 9×9 pixels window. The blur coefficients were estimated between 0.39-0.46 for panchromatic images, indicating a satisfying image quality. Nevertheless, the meaning of the blur coefficient is limited (Jacobsen et al. 2007).
2.2.3 SNR Analysis: The Pléiades images are distributed
applying the deconvolution process. This process raises the image noise which has been improved by de-noising. So that, the noise or better the SNR should be estimated for grey value groups due to the fact that SNR depends on the size of signal. Figure 7 shows the weighted SNR values averaged for images 269, 283 and 284, considering different grey groups.
Figure 7. SNR for 16 bit images
Panchromatic images have the highest SNR values compared to the other bands. This has been compared with results from other high resolution optical satellite imagery available for the Zonguldak test area (Table 6). The SNR is similar for Pléiades and IKONOS, whereas WorldView-1 and QuickBird have larger noise. This means Pléiades and IKONOS have better radiometric quality in the test area compared to QuickBird and WorldView-1. This has to respect the imaging conditions (sun and sensor elevation and azimuth, atmospheric conditions etc.) which may influence the image quality, so the result may be different for other images.
Pléiades (average)
WorldView-1 QuickBird IKONOS
91 24 48 98
Table 6. SNR for panchromatic images with 16 bit Figure 5. Accuracy at FCPs with bias compensation for 1st
degree RFM (range: ± 0.3-2.7 pixels)
2.3 Pansharpened Image Generation and Validation
Pansharpened images were generated by Principal Component Analysis (PCA), Intensity Hue Saturation (IHS) and Brovey transformation which are mostly used in commercial and academic/educational software. Figure 8 illustrates the sample pansharpened images generated by SharpQ developed during the mentioned projects. In addition, pansharpened images have been generated by modified Brovey transformation using BLUH (Jacobsen, 2011). The selectable parameters for this method allow a fit to the original colour balance, but also values for the optimal object identification can be chosen as it has been done in last image of Figure 8.
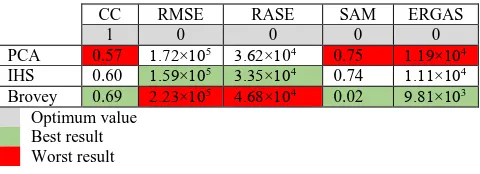
With the exception of the modified Brovey transformation the images were quantitatively analysed for their correct colour balance by the common metrics Correlation Coefficient (CC), Root Mean Square Error (RMSE), Relative Average Spectral Error (RASE), Spectral Angle Mapper (SAM) and Erreur Relative Globale Adimensionnelle de Synthése (ERGAS) (Ozendi et al., 2016; Özendi et al., 2014). Table 7 shows the results of quantitative analysis, comparing the pansharpened image with original red, green and blue bands.
CC RMSE RASE SAM ERGAS
Table 7. Results of quantitative analysis
The colour balance of the PCA method resulted in not optimal values. Also the image in figure 6 shows the limitation which does not allow an identification of the vegetation. This situation makes the resulting image varying from the original colour balance, as it can be observed from the CC and SAM metrics. For the IHS and Brovey pan-sharpened images, all five metrics were very close to each other except for the SAM. The explanation for this observation may be that these two methods result in images that have similar grey value distributions (Ozendi et al., 2016). In terms of the shape of histograms, the IHS pan-sharpened image is the most similar one. However, in terms of the distribution, the Brovey was the most similar one. This situation results in the highest RMSE value for the IHS pan-sharpened image. Since the PCA pan-sharpened image has the most changed colour balance, the ERGAS metric was the worst for this image. On the other hand, the Brovey transform distorts the original images spectrally least and this case yields the highest value for the ERGAS metric.
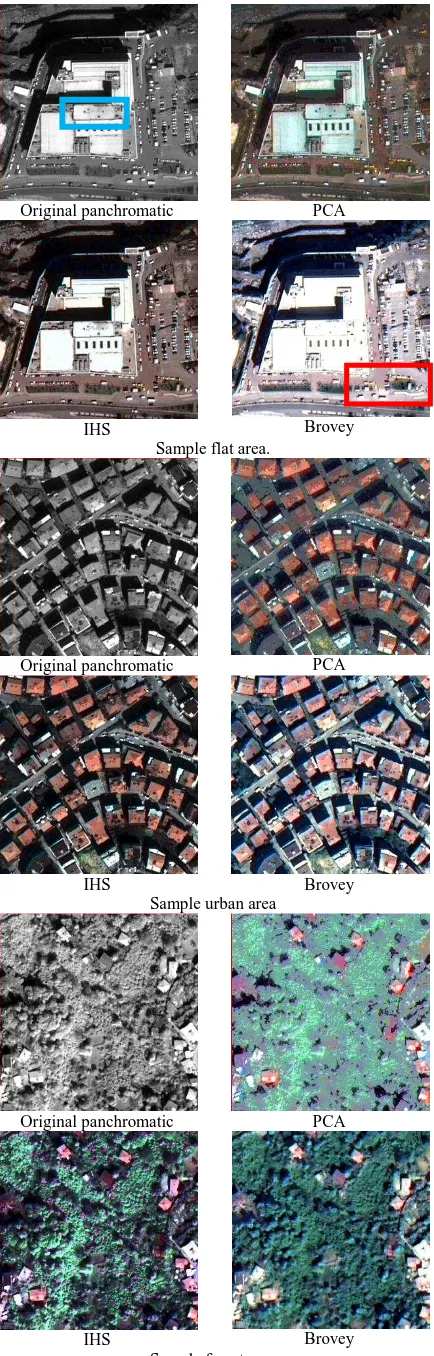
A visual comparison of the pansharpened images shows some colour bands in the building roofs for PCA, IHS and Brovey transformation, but not for the modified Brovey transformation. In the modified Brovey transformation image, the objects can be identified better as in the other images. This can be seen also in Figure 10, compared to Figure 9.
The pansharpened images were qualitatively evaluated for various land covers (flat, urban and forest areas). At flat areas, IHS method generates the most natural image whereas PCA yielded the most synthetic one (Figure 9). IHS was the best method while Brovey transform the worst w.r.t. the object discriminability, due to the brightness of the object generated by Brovey transform, causing weak recognition of the objects in such bright areas. Finally, the yellow colour was blurred in the PCA image.
PCA
IHS
Brovey
Modified Brovey transformation
Figure 8. Generated pansharpened images for sample area.
Since the images cover dense and natural forest around Zonguldak city centre, this third visual analysis was carried out on the forest areas. PCA generates the most synthetic image like in flat and urban areas, Brovey transform has the most natural image. The classification of forest and non-forest areas via PCA image was not available. It must be noticed that the IHS image can be used for the classification of various different vegetation types.
Figure 10. Sample areas generated by modified Brovey transformation.
2.4 DSM/DTM Generation and Validation
One important product from stereo satellite images are the DSM and the DTM. Pléiades images are acquired in tri stereo mode to cope with occlusions caused by high objects (buildings etc.) especially in the urban areas. The stereo imaging configuration is shown in Figure 3 and Table 8. The base length of the investigated tri stereo combination is very short even for the combination of first and last (284-283) images the angle of convergence is just 12.6°.
A reference DTM with SZ=50 cm, generated from UltraCam images with 30 cm GSD, was used for the comparison. Because of not well known datum shift between the Turkish national coordinate system and the ground control point measurements by GNSS, it was necessary to determine and respect the shift between the reference and the generated height models by adjustment.
Stereo pairs
Time difference of imaging
Base base / height ratio
Converge angle
283-284 20.75 sec 156.7 km 1:4.5 12.6° 283-269 10.50 sec 79.8 km 1:8.8 6.5° 269-284 10.25 sec 76.9 km 1:9.0 6.3°
Table 8. Stereo imaging configuration
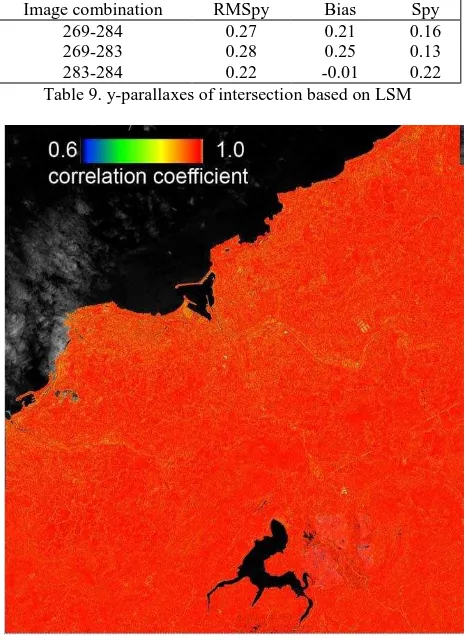
A DSM was generated by Least Squares Matching (LSM). The frequency distribution (Figure 11) shows better values for image combinations with a small angle of convergence as with larger angle of convergence. With a small angle of convergence the images are not so different as with larger values what is obvious for WorldView-2 with a base to height ratio of 1:1.26. The area distribution of correlation coefficients in Figure 12 shows also for forest areas high values, clearly higher as for a WorldView-2
Original panchromatic PCA
IHS Brovey
Sample flat area.
Original panchromatic PCA
IHS Brovey
Sample urban area
Original panchromatic PCA
IHS Brovey
Sample forest area
Figure 9. Sample areas for qualitative analysis.
model, causing gaps in the DTM (Büyüksalih et al., 2012). Although Pléiades triplets have very small base/height ratio, such kind of effect was not observed (Jacobsen and Topan, 2015).
The correlation coefficients are below 0.60 on water bodies, in cloudy areas, and also in extremely rough terrain and some areas with same textures (such as sports fields).
The corresponding image coordinates of matching were used for intersection based on the bias corrected RPC orientations. The resulting y-parallaxes (Table 9) show some systematic errors, but the standard deviation for the y-parallaxes (Spy) is small in spite of the not optimal terrain. Spy for the larger angle of convergence is larger as for the other, demonstrating again the influence of the image similarity depending upon the angle of convergence. This was different as with the GCP (Table 3), but the GCPs were measured manually in the individual images, not improved by matching.
Image combination RMSpy Bias Spy
269-284 0.27 0.21 0.16
269-283 0.28 0.25 0.13
283-284 0.22 -0.01 0.22
Table 9. y-parallaxes of intersection based on LSM
Figure 12. Distribution of correlation coefficients for Pleiades model with base to height relation 1:4.5
2.4.1 Filtering: The initial height model is the DSM including
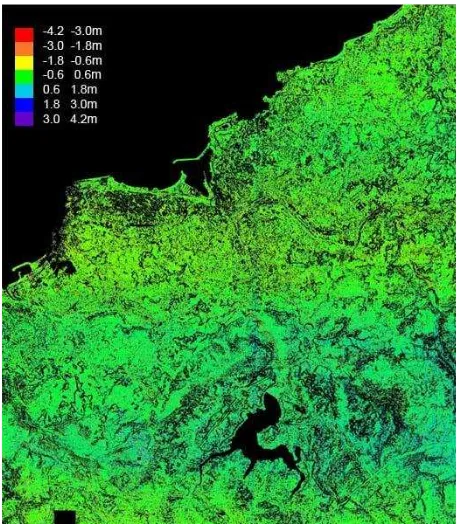
the objects above the bare ground as vegetation and buildings. Since the reference DTM describes the bare ground, the DSM must be filtered to remove objects not belonging to bare ground. 29% of object points are removed by filtering which is simple in the build-up areas whereas more difficult in forest areas without ground points on the rough terrain. Since the reference DTM does not cover the forest areas, these areas were not considered in the comparison. Figure 13 illustrates the result of filtering.
Figure 13. Result of filtering (black: filtered objects and Black Sea, colour = terrain height)
2.4.2 Comparison of Height Models: All three DTMs
generated with different image combinations and also one combined DTM were compared with the reference DTM with two metrics, i.e. SZ (standard deviations of the height) and the NMAD (Normalized Median Absolute Deviation) (Höhle and Höhle, 2009). Figure 14 shows the frequency of the differences in height between the DTM based on combined triplet images and the reference DTM. The frequency distribution is not smooth due to the just 3752 discrepancies. However, as usual, the normal distribution based on NMAD fits quite better to it as the normal distribution based on SZ.
Figure 14. Frequency distribution of differences in height between DTMs of all images and the reference
The next comparison is between the DSMs based on the image combinations 283-284 and 269-284 (Figure 15). Here the frequency function is smooth due to 9 million discrepancies. Figure 11. Frequency distribution of correlation coefficients
for the different image combinations
Again the normal distribution based on NMAD describes the accuracy characteristic better as SZ.
Stereo pairs b:h SZ NMAD
283-269 1:9.0 2.00m 1.71m
269-284 1:8.8 1.96m 1.73m
283-284 1:4.5 1.87m 1.65m
Table 10. Differences Pleiades DSMs against reference DTM
The achieved height accuracy of the Pleiades DSMs against the reference DTM (Table 10) shows only a very small improvement by the larger base to height relation. The NMAD corresponds to a standard deviation of the x-parallax of 0.44 pixels for the base to height relation 1:9 and 0.73 pixels for the base to height relation 1:4.5, indicating the limited influence of the base to height relation to the height accuracy. There are still some systematic effects of the determined height obvious in Figure 16.
The differences of DSM 283-284 against 269-284 in Figure 17 shows only small height differences, but also indicates with the green-blue tone in the elevated parts a small scale difference of the heights of 0.13%, but it may be caused also by some systematic errors of the used RPCs. The small incidence angle is sensitive for small deviations of the direct sensor orientation which was improved in the horizontal plane only by bias correction.
Figure 16. Differences in height between DSM 283-284 and reference DTM
Figure 17. Colour coded height differences of the filtered DSM 283-284 against 269-284
3. CONCLUSION
The potential of Pléiades images covering Zonguldak test site (Turkey) has been demonstrated. The radiometric analysis shows an image quality corresponding to 50cm GSD and not to the physical size of 70cm. A comparison with WorldView-1 and QuickBird having a physical GSD of 0.5m respectively 0.6m, in the same test site shows better image quality of the Pleiades images. The georeferencing accuracy and performance of DSM/DTM generation demonstrates the limited influence of the base to height relation to the height accuracy. A small angle of convergence leads to better matching in forest areas and has also advantages in built up areas.
The generated pansharpened images show a different quality depending upon the used method. The pansharpening is different for purposes of classification where the colour balance is important or for purposes of mapping where the object identification is important.
ACKNOWLEDGEMENTS
Authors would like to thank to Airbus Defence and Space, BEU (Project ID: 2014-47912266-01), and TÜBİTAK (Project ID: 114Y380) for their support on the Pléiades projects.
REFERENCES
Airbus, 2012. Pléiades Imagery User Guide, V 2.0 ed.
Airbus, 2016. MyGIC - Airbus Defence and Space's Users Group Platform.
Buyuksalih, G., Baz, I., Alkan, M., Jacobsen, K., 2012. "DEM generation with WorldView-2 images", ISPRS 22th Congress, Melbourne (Australia).
Figure 15. Frequency distribution of the difference height model 283-284 against 269-284
Cam, A., Topan, H., Ozendi, M., Oruc, M., 2014. "Pléiades-1A Görüntülerinin Gerçek Geometrik Çözünürlüğünün ve Radyometrik Kalitesinin Belirlenmesi", 5. Uzaktan Algılama ve Coğrafi Bilgi Sistemleri Sempozyumu, İstanbul.
Höhle, J., Höhle, M., 2009. Accuracy assessment of digital elevation models by means of robust statistical methods. ISPRS Journal of Photogrammetry and Remote Sensing, 64, 398-406.
Jacobsen, K., 2015. "Geometric potential of Pleiades models with small base length", 35th EARSeL Symposium on European Remote Sensing - Progress, Challenges and Opportunities, Stockholm, Sweden.
Jacobsen, K., Topan, H., 2015. "DEM Generation With Short Base Length Pléiades Triplet", International Archieves of Photogrammetry Remote Sensing and Spatial Informaiton Sciencies XL-3/W2, 81-86.
Jacobsen, K., Topan, H., Cam, A., Özendi, M., Oruc, M., 2014. "Radiometric and geometric characteristics of Pleiades images", Int. Arch. Photogramm. Remote Sens. Spatial Inf. Science, XL-1, 173-177.
Ozendi, M., Topan, H., Oruç, M., Cam, A., 2014. "Pléiades-1A Görüntülerinin Pan-Sharpening Performansının İncelenmesi", 5. Uzaktan Algılama ve Coğrafi Bilgi Sistemleri Sempozyumu, İstanbul.