○○○○○○○○○○○○○○○○○○○○○
Of the several kinds of creative activity being promoted in contemporary developments, arguably the most empowering for students is mathematical modelling (Galbraith, 1995, p. 312).
While mathematical modelling has had a continuous history as long as mathematics itself, the same cannot be said of the history of mathematical modelling within the secondary school curriculum. A good deal has been written about modelling as a classroom teaching and learning strategy (see for instance, Carr, 1989; Lowe, 1989; Swetz & Hartzler, 1991; White, 1994, 1995). The importance of mathematical modelling is reflected in the current syllabuses, such as the inclusion of a modelling option within the NSW Years 9/10 Advanced Mathematics Syllabus (BOS, 1996), and the spirit and direction of the NSW General Mathematics Stage 6 Syllabus (BOS, 1999).
A concern voiced by business, related to the need for mathematical modelling, is the perceived lack of transfer of school mathematical knowledge by students to the workplace. School provides students with an extensive mathematical “toolkit” but may not prepare them adequately in its use. Business and economic interests are demanding that students be prepared as flexible problem solvers in order to be ready to meet the challenges and uncertainties of their fast-changing workplaces. In short, they are demanding a smarter, more adaptable and better educated worker.
The modelling process
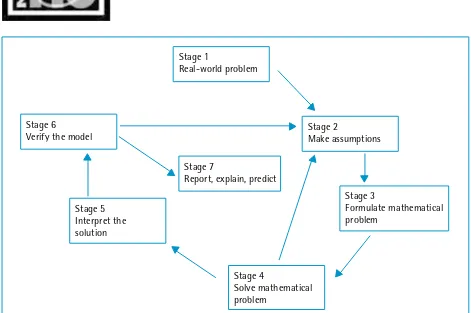
The modelling process is best illustrated in diagrammatic form (see fig. 1). Although there are many variations of the process, most of the modelling processes are essentially saying the same thing. However, the various classroom approaches can be very different in aim and implementation.
Galbraith’s (1989) three approaches to
teaching modelling
Galbraith proposed three teaching approaches to modelling:
• The “generalised applications approach” concentrates upon a particular application. Usually the teacher has taught the model and students are manipulating it under controlled conditions. This approach is common in secondary classrooms and usually involves only stages 4 and 5 of the modelling process. This is supported by the General Mathematics Syllabus (BOS, 1999, p. 6), which recommends that students gain experience in problem solving by:
“(i) gathering, interpreting and analysing mathematical information and
(ii) applying mathematics to model situations.”
The Key Competencies resonate strongly with the full modelling process.
• The “structured modelling approach” uses real-life situations and the full modelling process from stages 1 to 7. In this approach the teacher exerts considerable control over the mathematical model to be used in stage 3.
• The “open modelling approach” allows students to study a problem at the level of mathematics that they are comfortable using. All stages of the modelling process are completed. Students are asked to work with a problem with limited teacher assistance, because the teacher does not control the mathematics chosen by the students. This approach is not often used because of the time constraints, although there has been considerable support given recently for more open investigations to be included at all levels of the mathematics syllabuses.
Carr (1989) proposed a similar division of approaches. Carr’s division resonates with Galbraith’s but he calls the three approaches:
standard applications using established models;
direct modelling; and open modelling.
○○○○○○○○○○○○○○○○○○○○○
○○○○○○○○○○○○○○○○○○○○○○○○○○○○○○○○○○○○○○○○○○○○○○○○○○○○○○○○○○○○○○○○
“Hoping” is not common in teaching methodology and most teachers require more explicit management strategies.
Some management strategies
Galbraith’s structured modelling approach uses teacher intervention to control the mathematical model chosen. Other intervention strategies include:
• Subtle intervention. In this process the teacher chooses one or more groups that are open to suggestion and subtly suggests which model to use. During the class discussion, the teacher then ensures that the suggested model is chosen.
• Open intervention. This occurs during stage 3 of the modelling process. After a general class discussion of what mathematics could be used, the teacher presents to the class the mathematical model that is commonly used by mathematicians for the type of problem situation being considered.
• Delayed intervention. This strategy requires the teacher to allow the class to complete the modelling process once, using the mathematical model the class feels is appropriate. The teacher then leads a discussion to ensure that the deficiencies of the model used are revealed. This allows the teacher to suggest a different mathematical model for the students to use in
Figure 1. The modelling process
another circuit of the modelling process. The first circuit has the advantage of helping the students to fully understand and appreciate the complexity of the problem. It also increases the students’ appreciation of the merits of the suggested mathematical model.
The modelling process in the
classroom
The following example, adapted from the excellent AAMT 1994 Mathematics Week publication by Henry & McAuliffe (1994), is entitled Drying Out and uses a structured modelling approach.
Stage 1: Real-world problem
The problem: There are many lakes in Australia that are dry for most of the time, only filling for short periods immediately after rain. Lake Eyre in South Australia is an example of one of these normally dry lakes. When a dry lake bed is filled with water, how rapidly will the lake empty? (p. 42).
The problem statement should be very general and free of as much data as possible, as later stages of the modelling process will consider and gather what is needed. Often teachers will have to rewrite a typical textbook problem to reduce the initial information included.
Stage 1
Real-world problem
Stage 2
Make assumptions
Stage 3
Formulate mathematical problem
Stage 4
Solve mathematical problem
Stage 5 Interpret the solution Stage 6
Verify the model
Stage 7
○○○○○○○○○○○○○○○○○○○○○
○○○○○○○○○○○○○○○○○○○○○○○○○○○○○○○○○○○○○○○○○○○○○○○○○○○○○○○○○○○○○○○○
Suggested classroom techniques include:
• Allowing students individually to read and think about the problem statement.
• Dividing the class into groups and allowing them to discuss the problem. Some classes may need the structure of focusing questions for their discussion. A good technique is to get the students to list key words, to restate the problem, and to determine what units will be used to express the answer.
Listing key words: shallow, empty, filled.
Restating problem: Find how long it takes the lake to become dry again. We expect the answer to be in days.
Stage 2: Make assumptions
I regard this as the most valuable part of the process and it should not be rushed. It consists of listing all the variables involved and then trying to simplify or modify the list. In this process, it becomes obvious that there is a need to obtain certain information that will constitute the initial conditions of the problem.
Suggested classroom techniques include:
• Individually, or in groups, have the students brainstorm the problem to uncover the variables involved. The teacher could collect and write the variables on the board or overhead projector transparency.
• The teacher could then lead a class discussion in which each variable is considered and is either regarded as being important to the model or is discarded or controlled. This discarding process is really a way of controlling the model for certain variables and thus reducing the complexity of the model. For example, if the problem involves cars, then we can reduce the variables to be considered, such as size, make and colour, by limiting our model to a particular car. Average rates can also help to overcome a host of seasonal variables but can cause your model to be less sensitive.
• During this stage the class also compiles a list of the initial information that is required. The students could be directed to do some library research in order to find this information. Commonwealth and State Government publications are useful sources. The use of simulations, databases or spreadsheets can also provide the raw data from which the students can select the data they regard as important.
The following is a list of variables and the results of their consideration:
• size, shape, depth, surface area of water: will depend upon initial conditions, thus more information is needed.
• temperature, evaporation: will depend partly upon surface area; more information is needed.
• seepage: will depend upon surface area of bed and type of bed surface; more information is needed.
• rainfall, seepage, ground water, etc.: It was decided that there will be no more input for this lake for the period of our study.
• vegetation, irrigation: Because of desert conditions these are unlikely to be significant.
• animals: because of desert conditions, unlikely to be significant
• salinity: controlled by using average evaporation rates
• runoff: Lake Eyre is the lowest point, therefore nil runoff.
Stage 3: Formulate mathematical problem
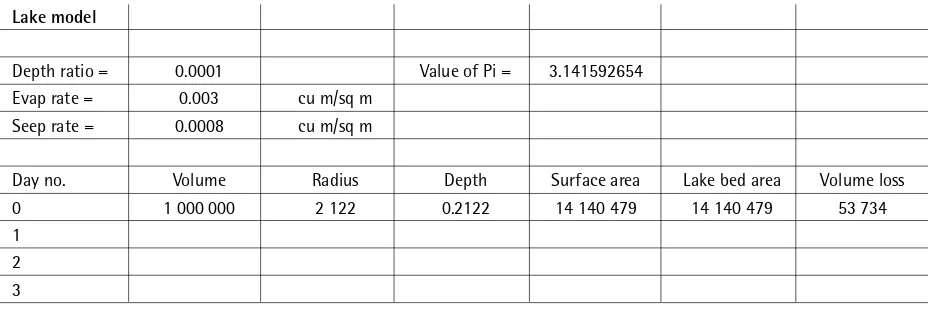
The choice of mathematical model will depend upon the approach used by the teacher and the demands of the syllabus. If the class decides upon a model that does not match the teacher’s, then the teacher has a choice to either intervene (a structured approach) or to delay until the completion of one cycle of the modelling process. The teacher has the option of algebraically constructing the model with the class or providing a spreadsheet containing the model (see fig. 2).
Suggested classroom techniques include:
• Groups discussing the mathematics they can use to make sense of the problem and reporting back to the class. For example, if the situation or problem includes a collection of data, then the use of various graphs may be an adequate model.
• Listing the calculations that need to be made.
○○○○○○○○○○○○○○○○○○○○○
○○○○○○○○○○○○○○○○○○○○○○○○○○○○○○○○○○○○○○○○○○○○○○○○○○○○○○○○○○○○○○○○
Initial data (in this case provided by Henry & McAuliffe):
Shallow lake dimensions: the ratio of maximum depth to maximum radius = 0.0001
Volume of Lake Eyre = 1 000 000 cu m
Evaporation rate per day = 0.003 cu m/ sq m of surface area
Seepage rate per day = 0.0008 cu m/ sq m of lake bed.
Now some may feel uneasy with using the volume as 1 000 000. Why not use a realistic figure, some may ask? Well at some stage the volume of the lake will be 1 000 000, but it is easier to begin with this figure as later, when the spreadsheet is set up, you can use any input and it will automatically adjust.
To select the model of lake: The best model is probably a very flat cylinder; however, we will use a flat cone as proposed by Henry & McAuliffe because it raises some interesting discussion in stage 6 of the process.
With some classes you may decide to round off certain data (which is the case for our solution that follows). If this is done, when you reach stage 6 in the modelling process, you can go back and undo this and see how much the result is changed.
Discussion: The class will determine that the calculations needed are:
• surface area of lake
• surface area of lake bed
• radius of the lake
• loss of volume/depth due to evaporation
• depth of the lake
• loss of volume/depth due to seepage
Stage 4: Solve the mathematical problem
This stage describes the process used by the students when applying a procedure to given data. Using the modelling process may mean a return to the initial assumptions in order to modify the problem being considered.
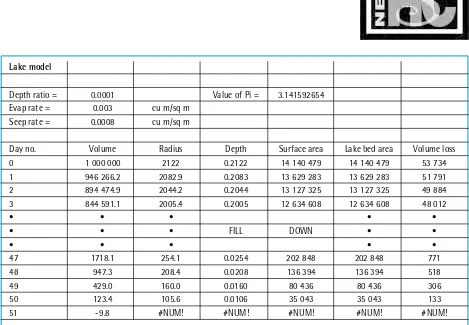
Using the fill down option on the spreadsheet, we are able to continue until we get negative values for the volume of the lake (see fig. 3). Note that we are really using an iterative “salami slicing” technique, whereby the spreadsheet calculates the volume loss at the end of the day, then adjusts and repeats the calculations for the new volume. The spreadsheet formulae can be found in Appendix 1.
Stage 5: Interpret the solution
After obtaining their solutions, the students are directed back to the problem. They must check to ensure that they have answered the problem within the assumptions they have made. Interpretations made should make explicit the assumptions and initial conditions. This is an important step in helping students realise that solutions to problems are constrained by the context and are not easily transferable to other situations.
The students will discuss the results and will need to decide whether the answer is the last day water was in the lake or the first dry day. Therefore our answer is not just 50 days. It requires an answer of the type: If the volume of our lake was ... etc. then it is empty on the 50th day.
Lake model
Depth ratio = 0.0001 Value of Pi = 3.141592654 Evap rate = 0.003 cu m/sq m
Seep rate = 0.0008 cu m/sq m
Day no. Volume Radius Depth Surface area Lake bed area Volume loss 0 1 000 000 2 122 0.2122 14 140 479 14 140 479 53 734 1
2 3
○○○○○○○○○○○○○○○○○○○○○
○○○○○○○○○○○○○○○○○○○○○○○○○○○○○○○○○○○○○○○○○○○○○○○○○○○○○○○○○○○○○○○○
Stage 6: Verify the model
In this stage the strengths and weaknesses of the model are discussed. This involves reflecting upon the mathematics that has been used. The statement that “all models are wrong, but some are useful” is an important reminder of the dangers of oversimplification and of ignoring the underlying assumptions. Models should be evaluated in terms of the variables used and, more importantly, those omitted.
Suggested classroom techniques include:
• Exploring ways of improving the model by considering more variables and carrying out further simulations. By varying initial conditions in the spreadsheet, the class is able to examine their effect.
• Repeating the process with the new improved model. In considering the process of improving the model, the more variables that can be included, the more sensitive the model will be to the context of the original problem.
The class can consider different models from the flat cone, and consider different variable values. This is extremely easy to do because it merely involves minor adjustments to the spreadsheet. The students are able to experience the power of their mathematics in making predictions and improving their model. The students also discuss their mathematical Lake model
Depth ratio = 0.0001 Value of Pi = 3.141592654 Evap rate = 0.003 cu m/sq m
Seep rate = 0.0008 cu m/sq m
Day no. Volume Radius Depth Surface area Lake bed area Volume loss 0 1 000 000 2122 0.2122 14 140 479 14 140 479 53 734 1 946 266.2 2082.9 0.2083 13 629 283 13 629 283 51 791 2 894 474.9 2044.2 0.2044 13 127 325 13 127 325 49 884 3 844 591.1 2005.4 0.2005 12 634 608 12 634 608 48 012
• • • • •
• • • FILL DOWN • •
• • • • •
47 1718.1 254.1 0.0254 202 848 202 848 771 48 947.3 208.4 0.0208 136 394 136 394 518 49 429.0 160.0 0.0160 80 436 80 436 306 50 123.4 105.6 0.0106 35 043 35 043 133 51 -9.8 #NUM! #NUM! #NUM! #NUM! #NUM!
Fig. 3. Spreadsheet solution
understanding, and this provides the teacher with an opportunity to introduce more sophisticated mathematics.
Stage 7: Report, explain, predict
This is a valuable part of the process, as students need experience in using language to express mathematical ideas. It is here that we reflect upon the quality of the students’ thinking. It should include documentation of the students’ progress through the stages of the cycle as well as their final predictions and answers. The structure of the modelling process provides a good organising device for their report.
Suggested classroom techniques include:
• Keeping a problem field book which keeps a running record of students’ thinking. Problems, possibilities and solutions are all recorded. This is a valuable source for later reports.
• A report prepared by the class, either individually or in groups. This can take many forms and can be used for display and assessment purposes. • A class discussion of the reports. This is a valuable
opportunity for students to think and to discuss their mathematics as well as propose further investigations.
○○○○○○○○○○○○○○○○○○○○○
○○○○○○○○○○○○○○○○○○○○○○○○○○○○○○○○○○○○○○○○○○○○○○○○○○○○○○○○○○○○○○○○
assumptions concerning the variables to observe the effect upon the answers.
Conclusion
Obviously, mathematical modelling problems don’t always require a computer or a spreadsheet. However, scattered throughout the General Mathematics Stage 6 Syllabus (Board of Studies, 1999) are suggestions on using spreadsheets. It has long been acknowledged that students can learn mathematical modelling only by participating in the experience of constructing models and in the struggle to perfect their models. This requires the teacher to allow the students to formulate, to test, to discuss and to adjust their thinking. The role of the teacher is to provide the opportunity for this learning to take place and to guide the students through the modelling process, while allowing them freedom within each stage. No amount of looking at, or of applying, models made by others can produce the confidence and skills that flow from making one’s own models, no matter how crude. The open modelling approach, rather than an application approach to modelling, is needed if we are to equip our students with the confidence needed to apply mathematics in their day-to-day lives.
References
Board of Studies NSW (1999). General Mathematics Stage 6 syllabus: Sydney: Board of Studies.
Carr, A. (1989). Teaching Mathematical Modelling. In D. Blane & M. Evans (Eds.), Mathematical modelling for the senior years (pp. 66-71). Parkville: The Mathematical Association of Victoria.
Galbraith, P. (1989). From applications to modelling. In D. Blane & M. Evans (Eds.), Mathematical modelling for the senior years (pp. 78-86). Parkville: The Mathematical Association of Victoria.
Galbraith, P. (1995). Assessment in mathematics: Developments, innovations and challenges. In L. Grimison & J. Pegg (Eds.) (1995). Teaching Secondary School Mathematics. (pp. 289-314). Sydney: Harcourt Brace. Henry, M. & McAuliffe, R. (1994). Drying Out. Mathstralia. (pp. 41-8). Melbourne: A.A.M.T.
Keitel, C. (2000). Mathematical and science curricula: For whom and for whose benefit? (or, the crisis of mathematics and science education as part of general education). In M. A. Clements, H. Tairab, & K. Y. Wong (Eds.), Science, mathematics and technical education in the 20th and 21st
centuries (pp. 299-316). Brunei: University Brunei Darussalam.
Lowe, I. (1989). Mathematics at Work: Modelling Your World, Vol. 1 & 2. Canberra: Australian Academy of Science.
Swetz, F., & Hartzler, J.S. (1991). Mathematical Modeling in the Secondary School Curriculum: A Resource Guide of Classroom Exercises. Reston Virginia: N.C.T.M.
White, A. L. (1994). Managing the Modelling Process in the Secondary Classroom. In D. Rasmussen & K. Beesey,
Mathematics without Limits (pp. 442-446). Brunswick Melb: M.A.V.
White, A. L. (1995). The mathematical modelling option. In Ann Richards, Flair: Forging Links and Integrating Resources (pp. 405-413). Darwin: A.A.M.T.
Appendix
Spreadsheet formulae
• Radius of the lake:
Cell C8=(3*B8/(3.141592654*$B$3))^(1/3) • Depth of the lake: Cell D8 =C8*$B$3 • Lake surface area: Cell E8 =$E$3*C8^2 • Lake bed surface area:
Cell F8 =$E$3*C8*(C8^2+($B$3*C8)^2)^(1/2) • Volume/depth loss due to evaporation and
seepage: Cell G8 =E8*$B$4+F8*$B$5
Allan White University of Western Sydney, Nepean
Use of calculators in the 2001 Higher
School Certificate Examinations
Candidates attempting the 2001 HSC mathematics examinations, with the exception of General Mathematics, may use only calculators appearing on the Board’s list of approved scientific calculators. This list is revised from year to year and published in the Official Notices section of the Board Bulletin. The list is also available on the Board’s web site: (http:// www.boardof studies.nsw.edu.au). Calculators to be used by candidates must have been switched off before entry into the examination centre.
Candidates attempting the General Mathematics HSC examination will be permitted to use calculators, including graphics calculators, that are silent, hand-held, and either battery or solar powered. Calculators that are capable of communicating or exchanging data are not to be used for this purpose in the examination. A calculating device that incorporates a set of keys whose primary function is to represent the alphabetic characters (e.g. a QWERTY keyboard) is not deemed to be a calculator for the purpose of this examination, and will not be allowed. Calculators to be used by candidates in the HSC examination in General Mathematics must have been switched off and have had all storage facilities cleared before entry into the examination centre.
○○○○○○○○○○○○○○○○○○○○○
○○○○○○○○○○○○○○○○○○○○○○○○○○○○○○○○○○○○○○○○○○○○○○○○○○○○○○○○○○○○○○○○
cs
DESIGNING
ASSESSMENT TASKS
Developing school assessment tasks that reflect the nature of the course and providing feedback to students on their progress compared with the expected standard of the syllabus are challenges which schools have faced for many years. With the introduction of the New HSC a further challenge has been to increase the emphasis on the communication aspect of assessment.
Apart from the introduction of the General Mathematics course, the HSC mathematics courses have had no change to content. Consequently, what was a good question to assess the content of the Mathematics, Mathematics Extension 1 or Mathematics Extension 2 courses can still form the basis of good standards-referenced assessment. What needs to be added is a way of communicating how the question or task relates to the curriculum standards and how the results of the assessment link to the expected standards of performance.
In developing quality assessment tasks it is important to recognise that all tasks should:
• be integral to the overall teaching and learning program
• have a direct link with syllabus outcomes
• be explicit in what students are required to do
• be valid and reliable
• be fair and equitable
• allow each student to demonstrate his or her level of achievement
• be time efficient and manageable
• have clear and explicit criteria for making judgements
• have identified marking guidelines
• provide opportunities for meaningful feedback to students.
Keeping in mind these general principles and the need to provide alignment between what is assessed and what is valued in the course, developing assessment tasks appears quite daunting. Yet in many ways it is no harder than cooking a rabbit.
First catch your hare
The Art of Cookery Made Plain and Easy was a best seller for nearly 100 years. It is a popular story that the book instructed the reader to “first catch your hare.” When developing sound standards-referenced assessment tasks, it is useful to adopt a similar principle. Instead of first catching your hare, start with an assessment task that you think fairly assesses a significant component of the course. This should provide immediate syllabus links for the task in both course content and the outcomes addressed.
The most obvious area of divergence from previous practice in mathematics appears to be the use of criteria in marking guidelines. Criteria are descriptive statements that markers use for making judgements about the marks to be awarded for different levels of performance. General descriptions of key features of these criteria should also be communicated to students before the task is set.
The criteria used in marking guidelines help to clarify the intent of the task in terms of the expected standard of the syllabus. That is, the criteria help to link the task to the syllabus outcomes through the content of the syllabus.
The development of marking
guidelines
The establishment of marking guidelines is an integral part of the whole process of task design. The design of the task and the drawing up of the marking guidelines are processes that influence each other and cannot be seen as discrete parts of the process. As the task is developed it is helpful to think about the criteria that will be used to distinguish between student responses.
Good assessment tasks focus on specific outcomes and content and allow students to demonstrate achievement at different levels. Marking guidelines set out the criteria for assessing achievement of the outcomes and content at different levels, and should include marks or mark ranges to be awarded at each level.
What key features should be
considered when developing
marking guidelines?
Marking guidelines should:
○○○○○○○○○○○○○○○○○○○○○
○○○○○○○○○○○○○○○○○○○○○○○○○○○○○○○○○○○○○○○○○○○○○○○○○○○○○○○○○○○○○○○○
• have clear criteria to distinguish between the different levels of achievement demonstrated in student responses
• use criteria that match the information given to students about what they will be assessed on when the task is given to them
• have mark allocations that reflect the relative importance and difficulty of what students have been asked to do
• allow for a range of student achievement in the context of the expected standards for the course.
Why are marking guidelines
important?
Marking guidelines play an important role in the New HSC. The alignment of marking guidelines to curriculum standards helps to give marks meaning in relation to those standards.
Marking guidelines are important because they can: • provide a link between the assessment task and
the outcomes being assessed
• assist in the process of communicating to students before the task about the criteria on which they will be judged
• support consistency in marking during the time taken to assess student responses and where more than one marker is involved
• provide a clear basis for distinguishing between different levels of achievement
• support the gathering of specific information about student performance that can be used to monitor ongoing performance and shape teaching and learning programs.
As the number of outcomes relating to an assessment task can be quite small, the criteria used in the marking guidelines provide a more detailed description of the key components of the assessment.
One way to develop confidence with creating appropriate guidelines for school-based assessment of the Higher School Certificate courses is to use previous HSC questions to tease out the links to the new syllabus outcomes and the marking criteria. This is not to suggest that school assessment practice should be restricted to merely emulating the final examination. Rather, it is to recognise that significant components of the HSC mathematics courses can be, and will continue to be, assessed effectively through formal examinations.
Becoming proficient at developing criteria within the marking guidelines that link the task to the syllabus
standards takes practice. An individual or a faculty can refine the skill of articulating appropriate criteria in mathematics courses with the following style of simple professional development activity.
Step 1 Select an appropriate task. The following example is based on Question 9 from the 1984 HSC examination paper in 2/3 Unit (Common) Mathematics.
Step 2 Work through a response to the task to become familiar with the level of challenge and the components of the syllabus being assessed. Do not allocate marks to your response.
Step 3 Determine which outcomes are being assessed in a significant way. Record these outcomes on the task. The General Mathematics syllabus clearly outlines the main outcomes related to each unit of work. Consequently, assessment tasks related to specific units of work will readily identify which outcomes are being addressed. For the Mathematics, Mathematics Extension 1 and Mathematics Extension 2 courses, you will need to read the new outcomes carefully to determine the strongest links.
Step 4 Look over your response to the task and determine the essential elements of a quality response. Write down what is valued in the response to the task. These general criteria should be independent of the specific values of variables within the task. For example, “change the subject of an equation” may be appropriate, whereas “make l the subject of the equation 0.27 = 4x2 + 5xl” would be
inappropriate.
The example provided on the following page has been completed up to the end of step 4.
Step 5 Determine and record the range of marks related to each criterion.
Step 6 Check that the marking guidelines provide a clear basis for distinguishing between different levels of student achievement.
The school-based mathematics assessment does not need to attempt to anticipate the HSC performance bands. This would be inappropriate for assessment within the Preliminary course and of doubtful accuracy for a new HSC course.
○○○○○○○○○○○○○○○○○○○○○
○○○○○○○○○○○○○○○○○○○○○○○○○○○○○○○○○○○○○○○○○○○○○○○○○○○○○○○○○○○○○○○○
Mathematics assessment task: The package
SYLLABUS LINKS
Geometrical applications of differentiation: Problems on maxima and minima.
OUTCOMES ADDRESSED A student:
• applies appropriate techniques from the study of calculus, geometry, probability, trigonometry and series to solve problems (H5)
• communicates using mathematical language, notation, diagrams and graphs (H9)
THE TASK
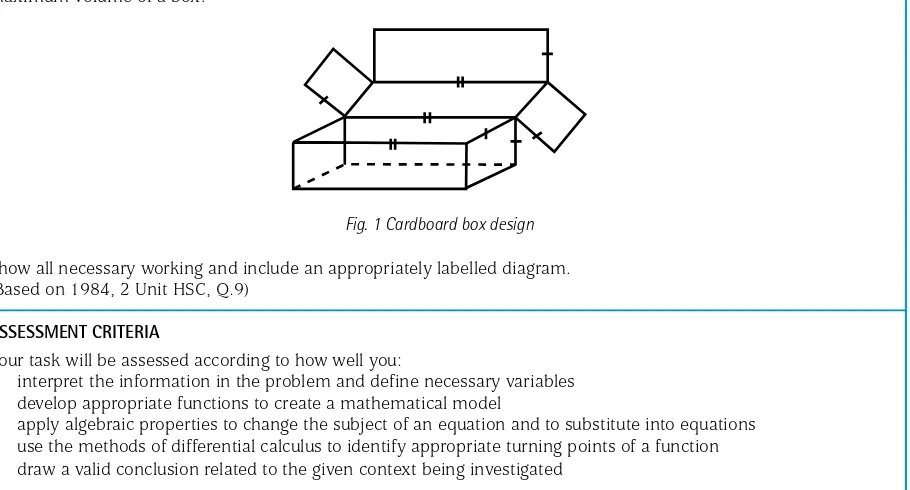
A farmer packs her unsalted butter in rectangular cardboard boxes with square ends and overlapping lids that exactly cover the open top, the square ends and the front face. Each box uses 0.27 square metres of cardboard. What is the maximum volume of a box?
Fig. 1 Cardboard box design
Show all necessary working and include an appropriately labelled diagram. (Based on 1984, 2 Unit HSC, Q.9)
ASSESSMENT CRITERIA
Your task will be assessed according to how well you:
• interpret the information in the problem and define necessary variables • develop appropriate functions to create a mathematical model
• apply algebraic properties to change the subject of an equation and to substitute into equations • use the methods of differential calculus to identify appropriate turning points of a function • draw a valid conclusion related to the given context being investigated
The criteria used in the marking guidelines provide the link between the syllabus content and the outcomes. The use of explicit marking criteria is a significant change. Allocating marks to the criteria helps communicate the expected standard of the syllabus and what is valued within the course. The criteria clearly need to come from the task rather than designing individual question components to match each criterion.
An assessment task such as The package will provide a clear basis for distinguishing between different levels of achievement. However, as it is pitched more at the top bands of performance on the Mathematics (2 Unit) course, I would be inclined to add in a more direct assessment of Geometrical applications of differentiation. This might take the form of a curve sketching question, such as Question 5(b) in the 1995 HSC, and would also link to the outcome: “A student
uses the derivative to determine the features of the graph of a function” (H6).
Q.5 (b) Consider the curve given by y = 7 + 4x3
– 3x4.
(i) Find the coordinates of the two stationary points.
(ii) Find all values of x for which
(iii) Determine the nature of the stationary points. (iv) Sketch the curve for the domain –1 ≤x≤ 2.
The layout of tasks within CURRICULUM SUPPORT
is for demonstration purposes only. On more extensive tasks students could be provided with the marking guidelines without the specific details of the task. For example, if a school were to use a trial HSC as a component of the assessment, the marking guidelines would be quite extensive, whereas the description of the task would be brief.
d2y
○○○○○○○○○○○○○○○○○○○○○
○○○○○○○○○○○○○○○○○○○○○○○○○○○○○○○○○○○○○○○○○○○○○○○○○○○○○○○○○○○○○○○○
Mathematics assessment task: Minimum area
SYLLABUS LINKS
Geometrical applications of differentiation: Problems on maxima and minima.
OUTCOMES ADDRESSED A student:
• constructs arguments to prove and justify results (H2)
• applies appropriate techniques from the study of calculus, geometry, probability, trigonometry and series to solve problems (H5)
• chooses and applies appropriate arithmetic, algebraic, graphical, trigonometric and geometric techniques (P4) • determines the derivative of a function through routine application of the rules of differentiation (P7)
THE TASK
In the diagram below, PQ and SR are parallel railings which are 3 metres apart.
The task on maxima and minima outlined in The package could also be extended to provide evidence related to the Mathematics Extension 1 outcome: “A student evaluates mathematical solutions to problems and communicates them in an appropriate form” (HE7).
Try completing the following task outline by determining the relevant marking criteria that could be provided to students before the task is attempted.
Fig. 2 (not to scale) Parallel railings
The points P and Q are fixed 4 metres apart on the lower railing. Two crossbars PR and QS intersect at T as shown in the diagram. The line through T perpendicular to PQ intersects PQ at U and SR at V. The length of UT is y metres. (i) By using similar triangles, or otherwise, show that
(ii) Show that
(iii) Hence show that the total area A of ∆PTQ and ∆RTS is
(iv) Find the value of y that minimises A. Justify your answer. Show all necessary working.
(Based on 1999, 2 Unit HSC Q.9b)
ASSESSMENT CRITERIA
Your task will be assessed according to how well you: •
• • • •
SR VT PQ=UT . 12
y SR = – 4.