TERRASAR-X BASED ASSESSMENT OF CANOPY STRUCTURE ALONG A LAND
USE INTENSITY GRADIENT IN CENTRAL SULAWESI, INDONESIA
Stefan Erasmi (1), Muhammad Ardiansyah (2)
(1)
University of Goettingen, Institute of Geography, Cartography, GIS & Remote Sensing Sect., Goldschmidtstr. 5, D-37077 Goettingen, Email: [email protected]
(2)
Bogor Agricultural University, Dept. of Soil Sciences and Land resources, Jln. Meranti, Kampus IPB Darmaga, Bogor 16680, Indonesia, Email: [email protected]
ABSTRACT
The present study investigates the relations between statistical measures of TerraSAR-X backscatter coefficients and field inventory measures for tropical agroforestry systems in Central Sulawesi, Indonesia. The background of the study is to evaluate the potential of spaceborne SAR missions for the spatially explicit estimation of horizontal and vertical structure elements of land use systems in tropical regions in order to assess quantitative variables for ecological modeling purposes. Three TerraSAR-X dual-polarized high resolution Spotlight scenes were acquired in the first half of September 2008 and radiometrically processed to normalized backscatter values. The results of the correlation analysis reveal a number of significant statistical relations between first order statistics of the backscatter coefficients (e. g. coefficient of variation) and canopy variables (e. g. leaf area index, R= 0.8) as well as tree geometric variables (e. g. diameter at breast height, R= 0.59) at the plot level. For other variable, strongest relations are found when only the upper canopy layers (shade trees) are selected for analysis (e.g., stem height, R= 0.76; canopy cover, R= 0.62). The findings support the hypothesis that X-band radar signals are able to deliver estimates of the vertical component of tropical vegetation stands especially in land use systems that are characterized by distinct boundaries of vegetation layers (e.g. cash crops under shade trees) like the cacao agroforestry systems in Indonesia.
1. INTRODUCTION
The degree of canopy closure of shade trees or the extinction of sunlight respectively, is an important variable in agroforestry management and a key factor to evaluate ecological services vs. economic benefits of tropical agroforestry stands [1, 2]. It is assumed that the amount of “shade” (canopy closure) is correlated to the intensity of land use and to the diversity of flora and fauna in agroforestry systems. Hence it may provide a surrogate for the abundance of ecosystem services in cultivated managed land. Cacao agroforestry is the predominant perennial cultivation system in Central Sulawesi and provides the basis for income and economic wealth in the agricultural sector of the island. It could be shown in other studies that a balance between agricultural intensification and biological conservation provides the optimum for both, farmers and ecosystems [3]. Hence, knowledge about the spatial distribution of biophysical properties in agroforestry systems of tropical regions enables the monitoring and modeling of the spatial heterogeneity and temporal variation of ecosystem conditions.
Due to its ability to penetrate clouds, satellite based SAR data provide a regular spatial coverage of land surfaces in regions that are highly obscured by clouds, like e.g. in the humid tropics. It has been shown that satellite SAR data in general are suitable for land cover mapping applications in tropical regions [4, 5]. Other authors reported the usefulness of SAR especially in combination with optical satellite data for an enhanced representation of the land surface [6, 7, 8]. The spatially explicit estimation of vegetation structure parameters in tropical forest regions and agroforestry systems has been subject to experimental remote sensing studies dealing with different types of sensor systems. Besides stereoscopic airphoto interpretation, most promising results for the estimation of stand structure parameters have been achieved by the use of airborne laser profiling systems (LIDAR) [9, 10, 11]. Other approaches are based on high resolution optical satellite data [12, 13]. Only few studies investigated the use of radar backscatter analysis [14] and interferometric SAR (InSAR) technology for canopy structure estimations [15]. In the majority of cases the potential of previous satellite SAR missions was limited by the temporal and / or spatial resolution of data acquisitions, especially for InSAR applications. Another limitation of previous satellite SAR images is the operation in one frequency and polarization, only. A major step in satellite radar remote sensing technology was achieved with the launch of the first operational X-band satellite SAR system TerraSAR-X in 2007. TerraSAR-X is the first spaceborne radar system that incorporates dual-polarisation as well as cross-polarisation capabilities at ultra-high spatial resolution.
2. DATA
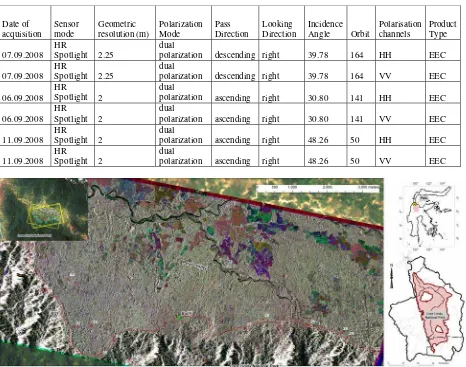
TerraSAR-X data were acquired in high resolution (HR) Spotlight dual-polarization (HH/VV) mode at three times during the first half of September 2008 (see Table 1). The data takes were chosen at three different orbits offering multi-angular geometry with incidence angles between 30 and 48 degrees at two looking directions (asc./desc. right). Data were obtained from EOWEB in EEC (Enhanced Earth Corrected) format using precise orbit geometry information (scientific orbit). Multi-looking of the data was carried out by choosing the radiometrically enhanced (RE) option that accounts for radiometric interferences (speckle) in the intensity images.
Field investigations are based on a sample of 21 experimental cacao agroforestry plots (0.2 ha size) that are part of a multidisciplinary research project at the rainforest margins around the Lore Lindu National Park in Central Sulawesi. The location of the test site and the frames of the TerraSAR-X data acquisitions are visualized in Figure 1. Measurements of the vertical and horizontal distribution of shade (or canopy closure respectively) in the plots were carried out at 6 height levels within each plot. Measurements were based on a Nikon Coolpix S3 Digital Camera system with an EC-F8 Fisheye lens converter imbedded in a self-leveling device with remote control for the camera release that was mounted on a telescope tripod. The processing of the hemispherical images yielded two biophysical variables indicating the vertical and horizontal component and distribution of the green canopy part of the trees within the plots (leaf area index, LAI and canopy closure, CC). All canopy measures were summarized at the plot level for different strata (1,3 m to 5,8 m above ground) and for the full sample (mean). In addition to the canopy measures, a standard field inventory was undertaken for all trees above 10 cm diameter at breast height (DBH). The field inventory delivered a set of variables that characterize the vertical and horizontal geometry of stems and branches. The following parameters were mapped: DBH, stem total height, number of stems, crown diameter, stand basal area and stand volume. All geometric measures were summarized at the plot level for the full sample (mean), the upper 10%-Quantile (_10) and the maximum value (max).
Table 1. TerraSAR-X data acquisitions and sensor parameters
Date of
polarization descending right 39.78 164 HH EEC
07.09.2008 HR
Spotlight 2.25
dual
polarization descending right 39.78 164 VV EEC
06.09.2008
polarization ascending right 30.80 141 VV EEC
11.09.2008
Figure 1. Right side: Overview of the study area and of the dominating agroforestry systems in the Palolo valley, Central Sulawesi, Indonesia; Left side: RGB-composite of TerraSAR-X high resolution spotlight data (VV-polarization;
3. METHODS
The sample of 21 field plots had to be reduced to 18 plots due to problems and restrictions in the viewing geometry of the satellite system. The respective areas that cannot be viewed by TerraSAR-X (shadow and layover) were extracted from the Geocoded Incidence Angle Mask (GIM) that is delivered with the EEC-product of TerraSAR-X.
Backscattering from a target is influenced by the relative orientation of the illuminated ground cell and the sensor, as well as by the distance in range between them. In order to minimize the impact of topography on the radar signal, the image pixel values were calibrated to normalized backscattering coefficients (sigma-naught in dB) using the equation after [16]:
dB = backscattering coefficient in dB
θloc = local incidence angle from GIM
β0
dB = radar brightness in dB
Ks = TerraSAR-X calibration factor
DN = digital number of TerraSAR-X EEC input image pixel.
Against the background of the study, the heterogeneity in the calibrated image values was preserved and no filtering was applied. This is also justified by the fact that the chosen processing format already partly accounts for speckle reduction (see above). The acquired data were spatially reduced to the remaining field sites and subsequently first order statistics (mean, maximum, minimum, range, standard deviation, coefficient of variation) were computed for each dataset within the regions of interest that are given by the extent of the field plots. In a second step textural parameters (second order statistics) were computed based on the grey level co-occurrence matrix (GLCM) of the backscatter data after [17]. Due to the redundancy in texture measures, only contrast and entropy were chosen (GLCM-shift 1x1 pixel). The complete compilation of structure and texture measures provided the dataset of indirect variables for the estimation of geometric and canopy parameters. At total, nine indirect variables were analyzed together with 18 direct variables from the field inventory. Correlation analysis was carried out and results were interpreted based on the correlation coefficient (R) and the level of significance (p).
4. RESULTS
Canopy closure in the cacao agroforestry systems varies from more than 80 % at the bottom of the stands to a range of 20 to 50 % at the shade tree level (above 5.8 m). The stand architecture with large gaps in between shade trees and a rather homogenous ground canopy layer of cacao trees allows for a deep penetration and for multiple volume scattering processes of the X-band radar beam within the multi-layer canopy system. This enables the analysis of both, top of canopy and ground level canopy (cacao) structure.
Accordingly, the results of the correlation analysis reveal strong relations between SAR backscatter variables and measurements of canopy closure and LAI at both levels (ground: 1.3, top: 5.8m) as well as for the full sample (mean). The same applies for most of the forest inventory measures. As an example, Table 2 lists the results of the correlation analysis for all tested indirect variables based on VV-polarized backscatter coefficients for the data acquisition of September 11, 2008 and the leaf area index (LAI) data. The LAI was chosen for this comparison because it is assumed to provide the most comprehensive indicator for the 3-D-canopy geometry. The strongest relations between backscatter variables and LAI were obtained for first order statistical measures that account for the variation in the data distribution (standard deviation, coefficient of variation). The texture measures did not reveal significant relations to the field data. Concerning the LAI stratification, high correlations coefficients were found between the SAR variables and the LAI measurements of the upper canopy layer (shade trees respectively). However, strongest relations came out for LAI mean values, representing the full stand architecture.
the measurements performs better than the whole sample, indicating the general response pattern of radar signals to the upper tree layer in agroforestry stands.
Table 2. Results of the correlation analysis between TerraSAR-X backscatter coefficients and structural variables at the plot level (0.2 ha). The Table shows the overall relations (R) for all tested indirect (SAR) variables against the field variable LAI. Significant correlations (p<0.05) are highlighted (**)
LAI_1.3m LAI_5.8m LAI_mean
Minimum -0.39 -0.44 -0.56**
Maximum 0.25 0.46 0.32
Range 0.37 0.61** 0.49**
Mean -0.45 0.01 -0.32
Stdev 0.21 0.59** 0.35
CoeffVar 0.78** 0.66** 0.80**
Constrast -0.09 0.30 0.08
Entropy -0.04 0.34 0.11
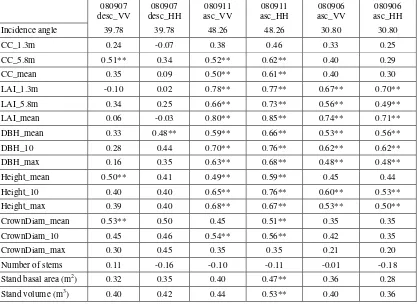
Table 3. Results of the correlation analysis between TerraSAR-X backscatter coefficients and structural variables at the plot level (0.2 ha). The Table shows the overall relations (R) for one indirect variable (coefficient of variation) against all field measurements. Significant correlations (p<0.05) are highlighted (**)
080907 desc_VV
080907 desc_HH
080911 asc_VV
080911 asc_HH
080906 asc_VV
080906 asc_HH
Incidence angle 39.78 39.78 48.26 48.26 30.80 30.80
CC_1.3m 0.24 -0.07 0.38 0.46 0.33 0.25
CC_5.8m 0.51** 0.34 0.52** 0.62** 0.40 0.29
CC_mean 0.35 0.09 0.50** 0.61** 0.40 0.30
LAI_1.3m -0.10 0.02 0.78** 0.77** 0.67** 0.70**
LAI_5.8m 0.34 0.25 0.66** 0.73** 0.56** 0.49**
LAI_mean 0.06 -0.03 0.80** 0.85** 0.74** 0.71**
DBH_mean 0.33 0.48** 0.59** 0.66** 0.53** 0.56**
DBH_10 0.28 0.44 0.70** 0.76** 0.62** 0.62**
DBH_max 0.16 0.35 0.63** 0.68** 0.48** 0.48**
Height_mean 0.50** 0.41 0.49** 0.59** 0.45 0.44
Height_10 0.40 0.40 0.65** 0.76** 0.60** 0.53**
Height_max 0.39 0.40 0.68** 0.67** 0.53** 0.50**
CrownDiam_mean 0.53** 0.50 0.45 0.51** 0.35 0.35
CrownDiam_10 0.45 0.46 0.54** 0.56** 0.42 0.35
CrownDiam_max 0.30 0.45 0.35 0.35 0.21 0.20
Number of stems 0.11 -0.16 -0.10 -0.11 -0.01 -0.18
Stand basal area (m2) 0.32 0.35 0.40 0.47** 0.36 0.28
Stand volume (m3) 0.40 0.42 0.44 0.53** 0.40 0.36
5. CONCLUSIONS
and strong relations could also be pointed out for field variables of the lower canopy layers and the whole stand architecture, indicating the presence of considerable volume scattering of the X-band radar signal within the vertical component of the stand structure. This thesis is also confirmed by the fact that the overall stand architecture in tropical agroforestry systems is mainly characterized by irregular sized and shaped gaps within the upper canopy layer of the shade trees. This general stand structure enables the penetration of short wave radar into the lower parts of the canopy.
Further analysis is needed to evaluate the impact of viewing geometry on the estimation of ecosystem variables. In the present study, viewing direction and incidence angle considerably influenced the statistical distribution of SAR based structure variables and hence, statistical significance of correlations. Another focus of future investigations will more closely examine the potential of SAR based texture measures for the object based extraction of agroforestry stand variables. In our study, no statistical relations could be found between texture and field data but the visualization of texture layers presumes clear patterns of within stand variability that might be used for the detection of single trees within agroforestry stands.
6. ACKNOWLEDGMENTS
This study was funded by the German Research Foundation (DFG) under grant SFB-552 (‘‘Stability of Rainforest Margins’’—STORMA). TerraSAR-X data were provided by the German Aerospace Center (DLR) within the pre-launch AO under proposal ID LAN0103.
7. REFERENCES
[1] Tscharntke T., Sekercioglu C.H., Dietsch T.V., Sodhi N.S., Hoehn P., Tylianakis J.M. (2008): Landscape
constraints on functional diversity of birds and insects in tropical agroecosystems. Ecology, 89, 944-951.
[2] Bos M.M., Steffan-Dewenter I., Tscharntke T. (2007): Shade tree management affects fruit abortion, insect pests
and pathogens of cacao. Agriculture, Ecosystems and Environment 120, 201-205.
[3] Steffan-Dewenter, I., Kessler, M., Barkmann, J., Bos, M., Buchori, D., Erasmi, S., Faust, H., Gerold, G., Glenk, K., Gradstein, S. R., Guhardja, E., Harteveld, M., Hertel, D., Höhn, P., Kappas, M., Köhler, S., Leuschner, C., Maertens, M., Marggraf, R., Migge-Kleian, S., Mogea, J., Pitopang, R., Schaefer, M., Schwarze, S., Sporn, S. G., Steingrebe, A., Tjitrosoedirdjo, S. S., Tjitrosoemito, S., Twele, A., Weber, R., Woltmann, L., Zeller, M. and Tscharntke, T. (2007). Tradeoffs between income, biodiversity, and ecosystem functioning during tropical rainforest conversion and agroforestry intensification. Proceedings of the National Academy of Sciences of the United States of America, 104, 4973-4978.
[4] Kasischke, E. S., Melack, J. M., Dobson, M. C. (1997): The use of imaging radars for ecological applications - A
review. Remote Sensing of Environment, 59, 141-156
[5] Choudhury, I., Chakraborty, M. (2006): SAR signature investigation of rice crop using RADARSAT data.
International Journal of Remote Sensing, 27, 519-534.
[6] Erasmi, S., Twele, A. (2009): Regional land cover mapping in the humid tropics using combined optical and SAR
satellite data – a case study from Central Sulawesi, Indonesia. International Journal of Remote Sensing (in press)
[7] Nezry, E., Mougin, E., Lopes, A., Gastellu-Etchegorry, J.P., Laumonier, Y. (1993): Tropical vegetation mapping
with combined visible and SAR spaceborne data. International journal of remote sensing, 14, 2165-2184.
[8] Shimabukuru, Y.E., Almeida-Filho, R, Kuplich, T.M., De Freitas, R.M. (2007): Quantifying optical and SAR
image relationships for tropical landscape features in the Amazonia. International Journal of Remote Sensing, 28, 3831-3840.
[9] Drake, J. B., Dubayah, R. O., Knox, R. G., Clark, D. B., Blair, J. B. (2002): Sensitivity of large-footprint lidar to canopy structure and biomass in a neotropical rainforest. Rem. Sens. Environ., 81 (2-3), 378-392
[10]Kotchenova, S. Y., Song, X., Shabanov, N. V., Potter, C. S., Knyazikhin, Y., Myneni, R. B. (2004): Lidar remote sensing for modeling gross primary production of deciduous forests. Rem. Sens. Environ., 92, 158-172
[11]Neeff, T., Graca, P. M., Dutra, L. V., Freitas, C. (2005): Carbon budget estimation in Central Amazonia:
Successional forest modeling from remote sensing data. Rem. Sens. Environ., 94, 508-522
[12]Greenberg, J. A., Dobrowski, S. Z., Ustin, S. L. (2005): Shadow allometry: Estimating tree structural parameters
using hyperspatial image analysis. Rem. Sens. Environ., 97, 15-25
[13]Lu, D., Mausel, P., Brondízio, E. & Moran, E. (2004): Relationships between forest stand parameters and Landsat
TM spectral responses in the Brazilian Amazon Basin. Forest Ecology and Management, 198, (1-3), 149-167
[14]Neeff, T., Dutra, L. V., Santos, J. R., Freitas, C. & Araujo, L. S. (2003): Tropical forest stand table modelling from
SAR data. Forest Ecology and Management, 186 (1-3), 159-170
[15]Toan, T., Quegan, S., Woodward, I., Lomas, M., Delbart, N., Picard, G. (2004): Relating radar remote sensing of
biomass to modelling of forest carbon budgets. Climatic Change, 67, 379-402
[16]Infoterra GmbH (2008). Radiometric calibration of TerraSAR-X data. Technical document No.
TSXX-ITD-TN-0049-radiometric_calculations_I1.00