PRIMATES,
40(4): 581-595, October 1999 581Variation in Blood Proteins and Mitochondrial DNA Within and
Between Local Populations of Longtail Macaques, Macaca
fascicularis
on the Island of Java, Indonesia
DYAH PERWITASARI-FARAJALLAH
Bogor Agricultural University
andKyoto University
YOSHI KAWAMOTO
Kyoto University
and BAMBANG SURYOBROTO
Bogor Agricultural University
ABSTRACT. We examined 31 blood protein loci, and restriction fragment length profiles of a PCR product of mitochondrial DNA containing the D-loop region using five kinds of restriction endonucleases
(HaelII, HinfI, MbolI, MspI,
andSau3AI)
in order to quantify the level of genetic variation of longtailmacaques,
Macacafascicularis.
Samples were collected from nine social groups in five localities of West Java, Indonesia. The average heterozygosity per individual (H) was 0.060 and 15.7% of the loci were polymorphic (Ppoly) over all populations in the protein analysis. There was no mtDNA haplotype variation within either social groups or local populations. To the contrary, great diversity was observed among local populations. Both nuclear diversity (measured by NEFS standard genetic distance) and mitochondrial diversity (measured by sequence divergence) showed a significantly positive correlation with geographic distance. There was no significant correlation between these two genetic markers, however. The genetic structure of the population was evaluated in terms of local inbreeding and temporal changes in allele fre- quency. Differences between nuclear and mitochondrial data are discussed in relation to gender specific migration and lineage sorting.Key Words: Longtail macaques; Blood proteins; mtDNA; Genetic variation; Java Island.
I N T R O D U C T I O N
The longtail macaque
(M. fascicularis)
is distributed in the eastern part of Bangladesh, south- ern Burma, the Indochinese peninsula, the Malay peninsula, Sumatra, Borneo, Java, the Lesser Sunda Islands, the Philippine Islands, and the southernmost Nicobar islands (FOODEN, 1995). Studies on morphology (FOODEN, 1995, 1997), ecology and social behavior (SOUTHWlCK &CADIGAN, 1972; WHEATLEY,
1980; KOYAMA et al., 1981; SUSSMAN & TATTERSALL, 1981, 1986; WHITTEN & WHITTEN, 1982; VAN SCHAIK & VAN NOORDWIJK, 1985; SUGARDJITO et al., 1989) reveal that the species possess a high degree of intraspecific differentiation. This tendency is also found in blood protein studies (KAWAMOTO et al., 1981, 1984, 1988; KAWAMOTO, 1982; TANAKA et al., 1989, 1991; KONDO et al., 1993; SCHEFFRAHN et al., 1996), and other molecular studies(HARIHARA et
al., 1986, 1988, 1991; TAKENAKAet
al., 1989, 1991; CROVELLA et al., 1994; LAWLER et al., 1995).Population genetic studies of local populations in the Indonesian longtail macaque using blood proteins revealed relatively low genetic variability within small island populations and extremely great diversity among them
(KAWAMOTO
et al., 1981, 1984; KAWAMOTO ~SURYOBROTO,
582
D. PERWITASARI-FARAJALLAH
et al.
isolation as well as the possibility of intergradation during the glacial period (KAWAMOTO et al.,
1984). Interestingly, a tendency for clinal variation has also been found in the distribution of the
allele frequencies of blood proteins. Nevertheless, the main factors responsible for the extremely
great diversity among island populations and relatively low genetic variability within small
islands remain unclear and should be analyzed in greater detail.
The most abundant genetic information for use in the assessment of genetic variation of non-
human primates comes from blood protein variation detectable by gel electrophoresis. Recently a
number of techniques have been applied to DNA analysis such as sequencing, restriction fragment
length polymorphisms (RFLP) and microsatellite analyses (HAYASAKA et al., 1991; LAWLER et al.,
1995; ROSENBLUM et al., 1997; MOR1N et al., 1997). They are highly suitable approaches for the
study of population genetics.
Despite the fact that both nuclear and mitochondrial genes can be utilized as genetic markers
for the quantification of variation in populations, the degree of concordance between results
obtained from protein and mtDNA data for the same sample has rarely been tested.
The primary aims of this study are to examine polymorphism and to elucidate intra- and inter-
populational genetic variation in longtail macaques using blood protein and mitochondrial DNA
D-loop PCR-RFLP analyses for the same samples. The assessment of genetic variability within
and between social groups and local populations presents basic information for this species and
provides further insight for the discussion of population structure and population history.
MATERIALS AND METHODS
SAMPLING
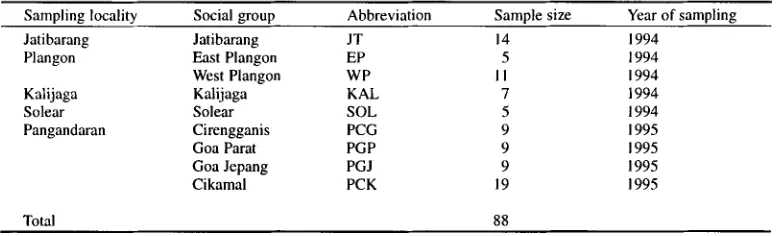
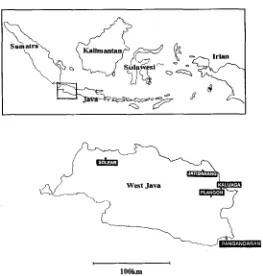
Blood samples were collected from five localities in West Java (Fig. I). The populations sur-
veyed and number of samples examined are given in Table 1. These samples were taken from
members of social groups. The study populations lived in remnant forests or in areas close to
human habitation, such as secondary forests, tourist areas, and sacred places (SuRYOBROTO et
al., unpubl, data).
SAMPLE PREPARATION
Blood samples were separated into erythrocytes, plasma and buffy coat by centrifugation at
3,000 rpm, for 15 min. Erythrocytes were then washed three times with saline (0.86%). Plasma
Table 1. Populations and number of samples examined in this study.
Sampling locality
Social g r o u p
Abbreviation
Sample size
Year of sampling
Jatibarang
Jatibarang
JT
14
1994
Plangon
East Plangon
EP
5
1994
West Plangon
WP
I I
1994
Katijaga
Kalijaga
KAL
7
1994
Solear
Solear
SOL
5
1994
Pangandaran
Cirengganis
PCG
9
1995
Goa Parat
PGP
9
1995
Goa Jepang
PGJ
9
1995
Cikamal
PCK
19
1995
[image:2.504.59.449.538.656.2]Population Genetic Study of Longtail Macaques
(Macaca fascicularis)
583
' / . ( ~ . e - , ~ ~ ,rlan
117:~ l l : l ~ l
I I
lOOkm
Fig.
1. Map of sampling localities in the present study.
and erythrocytes were used for protein analysis and the buffy coat for DNA analysis. They were
stored at - 2 0 ~ until examination. Whole genomic DNA were extracted from the buffy coat by
the method of KAN et al. (1977) with slight modifications.
DETECTION OF PROTEIN VARIATION
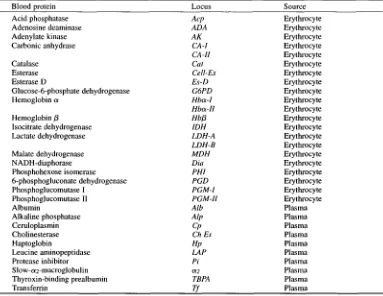
Thirty-one genetic loci were examined by starch gel electrophoresis (SGE), polyacrylamide
gel electrophoresis (PAGE), or iso-electric focusing (IEF). The loci examined are listed in Table 2.
Electrophoresis and staining were carried out as described by NOZAWA et al. (1982) and KAWAMOTO
et al. (1984).
AMPLIFICATION OF MITOCHONDRIAL D N A D-LOOP REGION
[image:3.504.120.383.76.352.2]584
D. PERWlTASARI-FARAJALLAH
et al.
Table 2. Blood protein and protein loci used for electrophoretic examination.
Blood protein Locus Source
Acid phosphatase Acp Erythrocyte
Adenosine deaminase ADA Erythrocyte
Adenylate kinase A K Erythrocyte
Carbonic anhydrase CA-I Erythrocyte
CA-H Erythrocyte
Catalase Cat Erythrocyte
Esterase CelI-Es Erythrocyte
Esterase D Es-D Erythrocyte
Glucose-6-phosphate dehydrogenase G6PD Erythrocyte
Hemoglobin a Hba-I Erythrocyte
Hba-H Erythrocyte
Hemoglobin fl Hbfl Erythrocyte
Isocitrate dehydrogenase IDH Erythrocyte
Lactate dehydrogenase LDH-A Erythrocyte
LDH-B Erythrocyte
Malate dehydrogenase MDH Erythrocyte
NADH-diaphorase Dia Erythrocyte
Phosphohexose isomerase PHI Erythrocyte
6-phosphogluconate dehydrogenase PGD Erythrocyte
Phosphoglucomutase I PGM-I Erythrocyte
Phosphoglucomutase II PGM-H Erythrocyte
Albumin Alb Plasma
Alkaline phosphatase Alp Plasma
Ceruloplasmin Cp Plasma
Cholinesterase Ch Es Plasma
Haptoglobin Hp Plasma
Leucine aminopeptidase LAP Plasma
Protease inhibitor Pi Plasma
Slow-o~2-macroglobulin ~2 Plasma
Thyroxin-binding prealbumin TBPA Plasma
Transferrin Tf Plasma
TYPING OF
PCR
PRODUCTRestriction fragment length polymorphism (RFLP) analysis was performed using five kinds
of restriction endonucleases
(HaeIII, HinfI, MboII, MspI,
and
Sau3AI).
The digested fragments
were resolved in 4 and 8% polyacrylamide gel electrophoresis (PAGE). The size of the frag-
ments were determined by using the DNA size standard of 50-2,000 bp ladder (Amplisize-
BIORAD) and visualized by silver staining (TEGELSTROM, 1986).
PROTEIN DATA ANALYSIS
Allele frequencies were calculated by the simple gene counting method, except for the hemo-
globin ot-II
(Hb-o~H)
locus. The hemoglobin ot subunit was postulated to be encoded by a dupli-
cated o~-globin gene (SMITH & FERRELL, 1980; TAKENAKA et al., 1989, 1991). Assuming dominant
and recessive alleles, the frequencies of two presumed alleles at a duplicated locus
(Hb-o~H
locus), denoted as 0 (null) and 2, were estimated by the square-root method.
The amount of variation was measured by the proportion of polymorphic loci (Ppoly) and aver-
age heterozygosity per individual (H). A locus was considered polymorphic when the frequency
of the most common allele was equal to or less than 0.99.
[image:4.504.62.445.101.397.2]Population Genetic Study of Longtail Macaques
(Macacafascicularis)
585
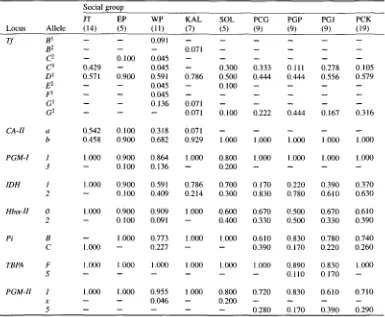
Table 3. Allele frequencies estimated for the polymorphic protein loci in the study populations of West
Java longtail macaques.
Social group
J T E P W P KAL SOL P C G P G P P G J P C K
Locus A l l e l e (14) (5) (11) (7) (5) (9) (9) (9) (19)
T f B I -- -- 0.091 . . . .
B 2 -- -- -- 0.071 . . . . .
C 2 -- 0 . 1 0 0 0 . 0 4 5 . . . .
C 3 0 . 4 2 9 -- 0 . 0 4 5 -- 0 . 3 0 0 0 . 3 3 3 0. I I l 0 . 2 7 8 0 . 1 0 5 D ] 0.571 0 . 9 0 0 0.591 0 . 7 8 6 0 . 5 0 0 0 . 4 4 4 0 . 4 4 4 0 . 5 5 6 0 . 5 7 9
E 2 -- -- 0 . 0 4 5 -- 0 . 1 0 0 . . . .
F j -- - - 0 . 0 4 5 . . . .
G I -- -- 0 . 1 3 6 0.071 . . . . .
G 2 -- - - -- 0.071 0 . 1 0 0 0 . 2 2 2 0 . 4 4 4 0 . 1 6 7 0 . 3 1 6
C A - H a 0 . 5 4 2 0 . 1 0 0 0 . 3 1 8 0.071 . . . . .
b 0 . 4 5 8 0 . 9 0 0 0 . 6 8 2 0 . 9 2 9 1.000 1.000 1.000 1.000 1.000
P G M - I 1 1.000 0 . 9 0 0 0 . 8 6 4 1 . 0 0 0 0 . 8 0 0 1.000 1.000 1.000 1.000
3 -- 0 . 1 0 0 0 . 1 3 6 -- 0 . 2 0 0 . . . .
I D H 1 1.000 0 . 9 0 0 0.591 0 . 7 8 6 0 . 7 0 0 0 . 1 7 0 0 . 2 2 0 0 . 3 9 0 0 . 3 7 0
2 -- 0 . 1 0 0 0 . 4 0 9 0 . 2 1 4 0 . 3 0 0 0 . 8 3 0 0 . 7 8 0 0 . 6 1 0 0 . 6 3 0
HboL-H 0 1.000 0 . 9 0 0 0 . 9 0 9 1.000 0 . 6 0 0 0 . 6 7 0 0 . 5 0 0 0 . 6 7 0 0 . 6 1 0
2 - 0 . 1 0 0 0.091 - 0 . 4 0 0 0 . 3 3 0 0 . 5 0 0 0 . 3 3 0 0 . 3 9 0
P i B -- 1.000 0.773 1 . 0 0 0 1.000 0 . 6 1 0 0 . 8 3 0 0 . 7 8 0 0 . 7 4 0
C 1.000 -- 0 . 2 2 7 -- -- 0 . 3 9 0 0 . 1 7 0 0 . 2 2 0 0 . 2 6 0
T B P A F 1.000 1.000 1.000 1.000 1.000 1.000 0 . 8 9 0 0 . 8 3 0 t . 0 0 0
S . . . 0 . 1 1 0 0 . 1 7 0 - -
P G M - H 1 1.000 1.000 0 . 9 5 5 1 . 0 0 0 0 . 8 0 0 0 . 7 2 0 0 . 8 3 0 0 . 6 1 0 0 . 7 1 0
x -- -- 0 . 0 4 6 - - 0 . 2 0 0 . . . .
5 . . . 0 . 2 8 0 0 . 1 7 0 0 . 3 9 0 0 . 2 9 0
divided into a number of social groups. Therefore, we used Hs, HL, GSL, HT, and GLT instead of
HT, Hs, and GST for intra and interpopulation diversity (NE], 1973). Genetic distances between
populations were calculated by NEI'S standard genetic distance
(NEI,1972). Local inbreeding in
West Java populations was analyzed using Wright's fixation index derived by NEJ and CHESSER
(1983).
PCR-RFLP ANALYSIS
According to the differences in electrophoretic patterns, restriction profiles were classified
with alphabetic letters for each endonuclease. Then, from comparison of combinations of enzy-
matic restriction patterns, mtDNA haplotypes were defined. The gain and loss of restriction
sites were evaluated by measuring DNA fragment size with size markers.
The sequence difference between two haplotypes was estimated in terms of distance p (the
estimated number of substitutions per site) according to NEI (1987). Using the iteration procedure
(NEI, 1987; equations 5.3 and 5.50), the estimate of sequence divergence was obtained.
[image:5.504.61.446.105.422.2]586
D. PERW1TASARI-FARAJALLAH
et al.
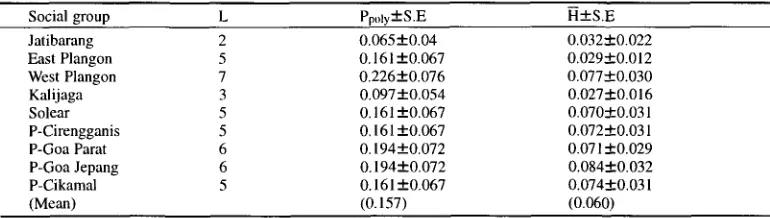
Table 4. Proportion of polymorphic loci
(Ppoly)and average heterozygosity (H) for each social group.
Social group L Ppoly• H•
Jatibarang 2 0,065• 0.032-1-0.022
East Plangon 5 0.161 • 0.029-1-0.012
West Plangon 7 0,226+0.076 0.077•
Kalijaga 3 0,097• 0.027•
Solear 5 0.161 • 0,070•
P-Cirengganis 5 0,161 +0.067 0,072•
P-Goa Parat 6 0,194• 0.071 •
P-Goa Jepang 6 0,194• 0.084•
P-Cikamal 5 0.161 • 0.074•
(Mean) (0.157) (0.060)
L: The number of polymorphic loci.
RESULTS
PROTEIN VARIATION
In comparison with human isozyme patterns
(HARRIS & HOPKINSON,1978) the 28 blood pro-
teins examined (Table 2) were presumed to be encoded by 31 loci. Among the 31 loci, 8 were
found to be polymorphic; these are
Tf, CA-II, PGM-I, 1DH, I-Ibot-II, Pi, TBPA,
and
PGM-II
(Table 3). All except alleles x and 5 of
PGM-II
locus were observed previously in the Java pop-
ulations
(KAWAMOTO etal., 1984). In general, the study populations commonly shared allele types.
VARIABILITY WITHIN LOCAL POPULATIONS
The average heterozygosity (H) fell within the range of 0.027-0.084 with a mean of 0.060
and the range of observed values of polymorphic loci (PpoLy) between 0.065 and 0.226 (Table 4)
with a mean of 0.157. These values were comparable to those obtained in previous studies of
longtail macaques in Java (KAWAMOTO et al., 1981, 1984).
TEST FOR RANDOM MATING
Occurrence of local inbreeding in each social group, neighboring groups in the same locality
and local populations was tested using Wright's fixation index F and Z2. No case deviated sig-
nificantly from F = 0 (data not shown), thus all of the study groups or populations were regarded
as being in Hardy-Weinberg equilibrium.
VARIABILITY BETWEEN LOCAL POPULATIONS
Gene Diversity (GLT)
[image:6.504.59.444.95.204.2]Population Genetic Study of Longtail Macaques
(Macacafascicularis)
Table 5. Gene diversity and population differentiation in West Java longtail macaques.
587
Total Local
population population Social group Hs HE HL-Hs GSL Plangon East 0.055 0 . 0 5 7 0 . 0 0 2 0.035
Plangon West Plangon
Pangandaran Cirengganis 0 . 0 9 1 0 . 0 9 5 0 . 0 0 4 0.042 Goa Parat
Goa Jepang Cikamal
0.039 (mean)
Hr HT-HL GLT West Java Jatibarang
Plangon
Kalijaga 0.060 0.079 0.019 0.241
Solear Pangandaran
Hs: Gene diversity within social group in the local population; HL: gene diversity within local population; GSL: HL-HS/HL: relative gene diversity between social groups in the local population; HT: gene diversity within total population; GLT: HT-HL/HT: relative gene diversity between local populations.
NEI'S
Standard Genetic Distance (D)
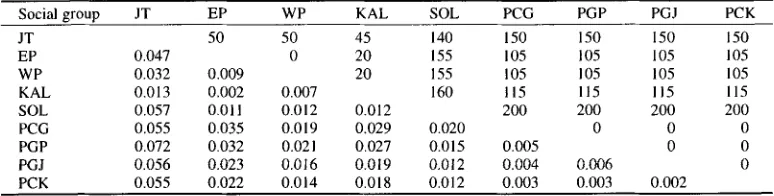
The absolute value of genetic diversity between populations was estimated by NEI'S standard genetic distance (NE1, 1987) as given in Table 6. We treated data with regards to the social group. Genetic differentiation between neighboring social groups was generally less than that between non-neighboring groups. Genetic differentiation between n e i g h b o r i n g groups and between local populations in West Java fell within the range of longtail macaques (KAWAMOTO et al., 1984) (Table 7). However the maximum D value of 0.009 in longtail macaque populations between neighboring groups was less than that of Japanese macaques,
Macacafuscata
(NozAwA et al., 1982) and toque macaques,Macaca sinica
(SHOTAKE & SANT|APILLAI, 1982). Furthermore, the m a x i m u m D value of 0.060 in longtail macaques between local populations was higher than that of macaque species and grivet monkeys,Cercopithecus aethiops aethiops
(SHIMADA & SHOTAKE, 1997).We investigated the relationship between genetic distance and geographic distance. For this we used the straight-line distance (km) between sites for measuring geographic distance (Table 6).
Table 6. NEFs standard genetic distance (below diagonal) between social groups of West Java longtail macaques.
and geographic distance (km; above diagonal)
Social group JT EP WP KAL SOL PCG PGP PGJ PCK
JT 50 50 45 140 150 150 150 150
EP 0.047 0 20 155 105 105 105 105
WP 0.032 0.009 20 155 105 105 105 105
KAL 0.013 0.002 0.007 160 115 115 115 115
SOL 0.057 0011 0.012 0.012 200 200 200 200
PCG 0.055 0.035 0.019 0.029 0.020 0 0 0
PGP 0.072 0.032 0.021 0.027 0.015 0.005 0 0
PGJ 0.056 0.023 0.016 0.019 0.012 0.004 0.006 0
[image:7.504.57.444.93.258.2] [image:7.504.59.446.536.634.2]588 D. PERWlTASARI-FARAJALLAH et al. Table 7. Comparison of genetic differentiation of non-human primates as estimated by NEI's standard genetic distance.
M. fascicularis M. fascicularis West Java (KAwAMOTO et al., 1984)
(present study) Sumatra Java Bali Lombok Sumbawa
Cercopithecus aethiops M. sinica aethiops M. fuSCtllr (SHOTAKE & (SHIMADA & (NozAWA et SANTIAPILLAI, SHOTAKE, al., 1982) 1982) 1997) Between social 0.002-0.009
groups in the same locality
Between local 0.005-0.060 populations in
the same islands
0.003 0.002-0.008 0.001 0.017 0.003-0.006 0.003-0.010 0.001-0.011
0.005-0.037 0.010-0.062 0.001-0.010 0.003-0.007 0.001-0.011 0.002-0.052 0.009-0.045 0.002-0.023
The correlation b e t w e e n genetic distance and g e o g r a p h i c distance was significantly positive ( r = + 0 . 4 3 ; 0.001 < p < 0 . 0 1 ) a m o n g social groups. E l i m i n a t i n g Jatibarang, which was relatively distant from other p o p u l a t i o n s in protein analysis, a stronger positive correlation was observed ( r = + 0 . 5 2 ; 0.001 < p < 0 . 0 1 ) .
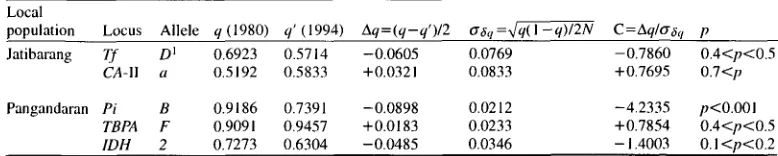
Temporal Change o f Allele Frequency in Jatibarang a n d P a n g a n d a r a n P o p u l a t i o n s
Allele f r e q u e n c y data obtained in different periods of s a m p l i n g were available for the Jatibarang and P a n g a n d a r a n p o p u l a t i o n s (KAWAMOTO et al., 1981; present study). U s i n g those data, it was p o s s i b l e to test whether the temporal c h a n g e s in allele frequencies follow stochastic c h a n g e or not.
The results o f the c o m p a r i s o n for the two s a m p l i n g periods (1980 and 1 9 9 4 - 1 9 9 5 ) revealed that there had been no significant c h a n g e in allele frequencies in the Jatibarang p o p u l a t i o n (Table 8). However, in the case o f P a n g a n d a r a n , the Pi locus showed a significant c h a n g e in allele frequencies.
Table 8. Changes in allele frequencies between two periods of sampling (1980--1994) in Jatibarang and Pangandaran populations.
Local
population Locus Allele q (1980) q' (1994) Aq=(q-q')/2 O'~q=x/q(I -q)/2N C=Aq/tr,~q p Jatibarang Tf D 1 0 . 6 9 2 3 0.5714 -0.0605 0.0769 -0.7860 0.4<p<0.5
CA-I1 a O.5192 0 . 5 8 3 3 +0.0321 0.0833 +0.7695 0.7<p Pangandaran Pi B 0.9186 0 . 7 3 9 1 -0.0898 0.0212 -4.2335 p<O.O01
[image:8.504.56.445.502.580.2]Population Genetic Study of Longtail Macaques
(Macacafascicularis)
589 Table 9. Mitochondrial DNA haplotypes found in the populationsof Macacafascicularis
in West Java.Composite types
Population n Haplotype
Haelll
Hinfl
Mboll
Mspl
Sau3AIJatibarang 14 1 A A A A D
Plangon 16 2 A B A A A
Kalijaga 7 3 A A A A A
Solear 5 4 A A A B C
Pangandaran 46 5 A A A A § B
n: Number of sample individuals.
MITOCHONDRIAL D N A VARIATION
Restriction Site Polymorphisms
The approximate size o f amplified segments o f mitochondrial D N A containing the D - l o o p region was 1.8 kb. Three o f five restriction endonucleases
(HinfI, MspI,
andSau3AI)
showed polymorphisms in their restriction pattern. A total o f five different haplotypes (composite types) were found in the present study (Table 9). Geographic distribution o f the m t D N A haplotype was restricted in each sampling locality and individual variation was not observed within local pop- ulations. The total number of recognition sites and the number of sites shared which were counted from five restriction endonucleases are presented in Table 10. Due to the technical hindrance in D N A fragment's calibration by PAGE (polyacrylamide gel electrophoresis), we determined the m i n i m u m number of restriction site differences (see Appendix).Gene Diversity and Sequence Divergence
The estimate o f total gene diversity of m t D N A variation
(HT)
was 0.198. As there was no individual difference within local populations, intrapopulational gene diversity(Hs)
was zero. This resulted inGST =
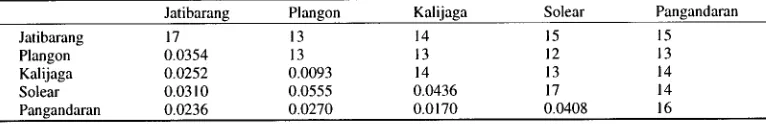
1, indicating that all of the diversity was attributable to the component between local populations.The estimates of sequence divergence between the PCR products o f m t D N A containing D-loop region are summarized in Table 10. The overall mean o f the sequence divergence was 0.0308.
From the quantification o f sequence divergence between m t D N A haplotypes, the relationship between m t D N A diversity and geographic distance was evaluated. The analysis suggested a pos- itive correlation between sequence divergence and geographic distance ( r = +0.61; 0 . 0 5 < p < 0 . 1 ) . When the Jatibarang population was omitted, a stronger positive correlation was observed ( r = +0.81; 0.001 < p < 0 . 0 1 ) .
Table 10. The number of recognition sites shared (above diagonal), the total number of recognition sites (diagonal), and estimates of sequence divergence between PCR products of mtDNA containing D-loop region among populations of West Java longtail macaques (below diagonal).
Jatibarang Plangon Kalijaga Solear Pangandaran
Jatibarang 17 13 14 15 15
Plangon 0.0354 13 13 12 13
Kalijaga 0.0252 0.0093 14 13 14
Solear 0.0310 0.0555 0.0436 17 14
[image:9.504.56.447.95.170.2] [image:9.504.62.445.584.646.2]5 9 0 D. PERWITASARI-FARAJAI.I.AII el al.
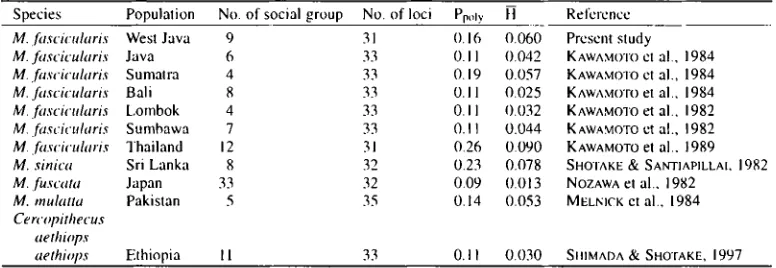
T a b l e 11. C o m p a r i s o n o f two indices o f genetic variation, average proportion o f p o l y m o r p h i c loci (Ppoly) and a v e r a g e h e t c r o z y g o s i t y (H) in n o n - h u m a n p r i m a t e s .
Species Population No. of social group No. of loci Pp,,ly H Reference
M. ~tscicularis West Java 9 31 0.16 0.060 Present study
M. fitscicularis Java 6 33 0.1 I 0.042 KAWAMOTO ct al., 1984
M. fascicuhtris Sumatra 4 33 0.19 0.057 KAWAMO'IO ct al., 1984
M. fitscicularis Bali 8 33 0.11 0.025 KAWAMO'rO et al., 1984
M..fascicularis Lombok 4 33 0.11 I).032 KAWAMOTO et al., 1982
M.fascicularis Sumbawa 7 33 0.11 0.044 KAWAMOTO ctal., 1982
M..&scicuhtris Thailand 12 31 0.26 0.090 KAWAMOTO el al.. 1989
M. sinica Sri Lanka 8 32 0.23 0.078 SHOTAKE & SAnqqAPlLI_AI, 1982
M. fuscata Japan 33 32 0.09 0.013 NOZAWA el al., 1982
M. mulatta Pakistan 5 35 0.14 0.053 MELNJCK et al., 1984
Cercopithecus aethiops
aethir Ethiopia 11 33 0. I I 0.030 SHIMADA & SHOTAKE, 1997
DISCUSSION
CHARACTERISTICS OF GENETIC VARIATION
Levels ~ Variability Within a Population
A comparison of two indices of genetic variation, proportion of polymorphic loci
(Ppoly)and
average heterozygosity (H) for social groups of non-human primates is given in Table 11. Here,
the average heterozygosity (H) was in the range of 1.3-9.0%. In general, West Java populalions
followed the tendency of island populations to have I(~wer heterozygosity compared to continen-
tal populations as discussed by FOODEN and LANYON (1989). Reduced genetic variability in
island populations is primarily due to genetic drift and the founder effect. These two factors may
have a greater intpact on the gene pool of island populations than on continental populations.
Genetic l)ifferentiation Between Local Populations
We defined three hierarchical categories of study population to discuss genetic differentiation
of Iongtail macaques in West Java, namely social groups, local populations, and the total popu-
lation. Mean proportion of gene diversity between social groups in the same locality was 0.039
(Table 5), and the proportion of gone diversity between local populations was 0.241. With rcfcr-
ence to the partition of populations, the proportion of gene diversity for the West Java popula-
lions could be summarized as lk)llows; 24.1% of the total gene diversity existed between local
populations and 75.9% ( = 1-0.241) within local populations. Of the total gene diversity within
local populations (75.9%), 3.0% (=0.759•
is contributcd from the variation betwccn
social groups in the samc local population and the remaining 72.9% ( = 7 5 . 9 % - 3 . 0 % ) from
social groups. The obscrved low differentiation betwcen social groups in thc same local popula-
tion may result from frequent gene flow by adult males transferring among neighboring social
groups. The mean of the effective number of migrants per social group per generation
(N~m)
[image:10.504.59.447.106.240.2]Population Genetic Study of Longtail Macaques
(Macacafascicularis)
591
protein genetic distance and geographic distance (r= +0.43; 0.001 <p<0.01) may be caused by
limitation of gene flow between local populations (mean
Nem=0.8).
POPULATION STRUCTURE
The present study revealed a panmictic condition within local populations and differentiation
between them according to their geographic distribution. These features could be explained by
the hierarchical population structure model presented by NOZAWA et al. (1982) for Japanese
macaques. This model assumes that the species population consists of a number of local popula-
tions each of which is composed of several social groups. The adjacent social groups in the
same locality are considered to be associated genetically by frequent adult male transfer
(KAWANAKA,1973). On the contrary, male dispersion between local populations is considered to
be restricted, causing local genetic differentiation. The genetic features found in this study sup-
port the idea that the population structure of longtail macaques in Java is principally similar to
that of Japanese macaques.
At present, the information about geographic distribution of longtail macaques in West Java
is unavailable. As a result, we could not clarify the enviromental factors which come into play
in fragmentation of monkey populations. Notwithstanding, in general, population subdivision is
considered to be the most conceivable situation which is attributable to a certain habitat frag-
mentation (WILSON & WILSON, 1975; SUPR1ATNA et al., 1996).
Previous discussions have dealt with the genetic structure of a population with respect to the
problem of spatial structure. The problem of time is another important aspect. However, little is
known about this due to a lack of long-term studies. The results of changes in allele frequencies
in two sampling periods (1980-1994) in the Jatibarang and Pangandaran populations revealed
that although one case was exceptional
(Pi
in Pangandaran) the changes in allele frequencies
were generally within the range of random fluctuation or stochastic change. This means that
protein polymorphism in a local population of longtail macaques is stable with respect to time
and space.
As reported previously by KAWAMOTO et al. (1981), the Jatibarang population was charac-
terized by having a low level of genetic variability. This situation may result from isolation
from other populations. The changes in allele frequency in the social group of Jatibarang or
Pangandaran over 15 years (about two generations) were within the range of random fluctuation
and suggest genetic equilibrium in the study group. Although the possibility of some forces of
natural selection could not be ruled out, such conditions may result from panmixia in the local
population during the 15 year period. In Pangandaran populations the result seems to support
admixture in the gene pool of a local population due to frequent gene flow by adult male transfer
between social groups within the local population. On the other hand, in the Jatibarang population,
restricted gene flow by male transfer from other local populations and small population size
may result in genetic equilibrium and low genetic variability.
DIFFERENCES BETWEEN NUCLEAR AND MITOCHONDRIAL DATA
Contrasting Features in Variations Within and Between
Local Populations
592 D. PERWITASARI-FARAJALLAH et al. has also been found in Japanese macaques
(HAYASAKA
et al., 1991), rhesus macaques(ZHANG
& SH, 1993), and toque macaques in Polonnaruwa (HOELZER et al., 1994) and also in a PCR-RFLP analysis of pigtail macaques,Macaca nemestrina
(RosENBLUM et al., 1997).The relative magnitude of interlocal differentiation for nuclear D N A ( G / j = 0 . 2 4 1 ) was much smaller than that for m t D N A
(GST=
1). Extremely great differentiation between local popula- tions in m t D N A was primarily in accordance with expectations from the molecular evolutionary rate of being five to ten times larger than nuclear genes (BRowN et al., 1979). But the scarcity of individual m t D N A variation in local populations could not be explained only by this rate differ- ence. Contrast in m t D N A and nuclear D N A differentiation has been pointed out in a previous study on rhesus macaques (MELNtCK & HOELZER, 1992). Two factors were pointed out to give rise to this condition. One is the difference in effective population size. As m t D N A is transmit- ted maternally without recombination (HuTcHINSON et al., 1974; GILES et al., 1980; OHNO, 1997), its effective population size is one fourth that in nuclear DNA. This finally leads to a higher degree of genetic drift (BmKY et al., 1989), as well as high fixation rate as a selectively neutral marker (BRowN et al., 1979). Consequently, reduction of variability becomes larger in mito- chondrial D N A than in nuclear genes.The other factor is the nature of female philopatry in the social organization of macaque species. With respect to population structure, the features of female philopatry and group division (lineage sorting) have a prominent role in causing this contrast (HAYES & HARRISON, 1992). In macaques, male migrants can contribute to the shuffling of the nuclear gene pool but not of the mitochondrial gene pool. This gender specific migration pattern in macaque species contrasts to that in humans (MELNICK & HOELZER, 1992).
Correlation of Local Genetic Differentiation Between
Nuclear and Mitochondrial Genes
Since we examined either uniparentally (mtDNA) or biparentally (nuclear) inherited markers from the same individuals, the obtained data allows us to see the relation of their geographic differentiation patterns. Despite significantly positive correlations between geographic distance and both protein genetic distance and mitochondrial sequence divergence, the correlation between the two genetic distance measures was not obvious ( r = + 0 . 2 3 ; 0 . 1 < p < 0 . 2 ; number of combi- nation=36). This inconsistency may result from the mechanisms that rule out the geographic nature of genetic differentiation. In nuclear markers such as proteins, restricted gene flow among subpopulations or isolation by distance give rise to the positive correlation. However, gene flow by males has no contribution to correlation of m t D N A differentiation. This seems to be the case for iongtail macaques. Females typically remain at their natal group and historical splitting of maternal lineages by group division seems to be a major cause of spatial differentia- tion of the genetic marker in this species. Whether this explanation is reasonable or not can be tested by adding more population samples in future studies.
Population Genetic Study of Longtail Macaques (Macacafascicularis) 593 Appendix. Restriction morph and fragment size estimates (in base pairs) of all fragment patterns observed in mitochondrial DNA containing the D-loop region.
RE Morph Fragmentsize (bp) Total
Haelll A 675 575 420 120 60 1850
Hinfl A 1080 480 290 1850
B 1080 770 1850
Mboll A 1350 500 1850
Mspl A § 1210 560 45 45 1860"
A 1210 550 45 45 1850
B 1210 470 90 45 45 1860"
A 680 510 375 255 30 1850
B 510 375 350 255 250 80 30 1850
C 510 375 330 320 255 30 30 1850
D 510 330 320 255 220 155 30 30 1850
Sau3 A 1
*We detected electrophoretically 10 bp difference in total fragment size. For calibration, we assumed morph A and A § shared the same restriction sites. Calibration unit: for large fragment: 10 bp (1000 bp<), for small fragment: 5 bp (< 1000 bp).
REFERENCES
BIRKY, C. W.; FUERST, P. JR.; MARUYAMA, T. 1989. Organelle gene diversity under migration, mutation, and drift: equilibrium expectations, approaches to equilibrium, effect of heteroplasmic cells and compari- son to nuclear genes. Genetics, 121: 613-627.
BROWN, W. M.; GEORGE, M.; WILSON, A. C. 1979. Rapid evolution of animal mitochondrial DNA. Proc. Natl. Sci. USA, 76: 1967-1971.
CROVELLA, S.; BIGATTI, M. P.; ARDITO, G.; DELPERO, M.; MONTAGNON, D., LAMBERTI, L. 1994. The high genetic homology of three Macaca fascicularis and two Macaca mulatta subspecies on the basis of their highly repeated DNA restriction patterns. Human Evol., 9:63-71.
FOODEN, J. 1995. Systematics review of Southeast Asian longtail macaques, Macacafascicularis (RAFFLES, 1821). Fieldiana: Zool., n.s., 81: 2 - 3 .
FOODEN, J. 1997." Tail length variation in Macaca fascicularis and Macaca mulatta. Primates, 38:221 -231. FOODEN, J.; LANYON, S. M. 1989. Blood-protein allele frequencies and phylogenetic relationships in
Macaca: a review. Amer. J. Primatol., 17: 209-241.
GILES, R. E.; BLANC, H., CANN, H. M.; WALLACE, D. C. 1980. Maternal inheritance of human mitochondrial DNA. Proc. Natl. Acad. USA, 77: 6715-6719.
HARIHARA, S.; AOTO, N.; HIRAI, M.; TERAO, K.; CHO, F.; HONJO, S.; OMOTO, K. 1986. Polymorphism in the mitochondrial DNA of cynomolgus monkeys. Primates, 27: 357-361.
HARIHARA, S.; INANISHI, Z.; SAITOU, N.; OMOTO, K.; VARAVUDHI, P.; TAKENAKA, O. 1991. Phylogenetic analy- sis of Macaca fascicularis in Thailand, using data of mitochondrial DNA. In: Primatology Today: Proceedings of the XlIlth Congress of the International Primatological Society, Nagoya and Kyoto, 1 8 - 2 4 July 1990, EHARA, A.; K1MURA, T.; TAKENAKA, O.; IWAMOTO, M. (eds.), Elsevier Science, Amsterdam, pp. 611-612.
HARIHARA, S.; SAITOU, N.; HIRAI, M., AOTO, N.; TERAO, K.; CHO, E; HONJO, S.; OMOTO, K. 1988. Differ- entiation of mitochondrial DNA types in Macacafascicularis. Primates, 29: 117-127.
HARRIS, H.; HOPKINSON, D. A. 1978. Handbook of Enzyme Electrophoresis in Human Genetics. Northland, Amsterdam.
HAYASAKA, K.; ISH1DA, T.; HORAI, S. 1991. Heteroplasmy and polymorphism in the major non-coding region of mitochondrial DNA in Japanese monkeys association with tandemly repeated sequences. Mol. Biol. Evol., 8: 399-415.
HAYES, J. P.; HARRISON, R. G. 1992. Variation in mitochondrial DNA sequence and the biogeographic history of woodrats (Neotoma) of the eastern United States. Syst. Biol., 41:331-344.
HOELZER, G. A.; DITTUS, W. P. J.; ASHLEY, M. V.; MELNICKS, D. J. 1994. The local distribution of highly divergent mitochondrial DNA haplotypes in toque macaques Macaca sinica at Polonnaruwa, Sri Lanka. Mol. Ecol., 3:451-458.
594 D. PERW1TASARI-FARAJALLAH et al. NAN, Y. W.; DozY, A. M.; TRECARTIN, R.; TODD, D. 1977. Identification of a nondeletion defect in
oL-Thalassemia. N. Engl. J. Med., 297: 1081-1084.
KAWAMOTO, Y. 1982. A reexamination of electromorphs of plasma transferrin in the Indonesian crab-eating macaque (Macaca fascicularis). Kyoto Univ. Overseas Rep. Stud. Indonesian Macaque, 2: 65-73. KAWAMOTO, Y.; ISCHAK, TB. M.; SUPRIATNA, J. 1982. Gene constitution of crab-eating macaques (Macaca
fascicularis) on Lombok and Sumbawa. Kyoto Univ. Overseas Res. Rep. Stud. Asian Non-human Primates, 2: 5 - 6 4 .
KAWAMOTO, Y.; ISCHAK, TB. M.; SUPRIATNA, J . 1984. Genetic variations within and between troops of the crab-eating macaques (Macacafascicularis) on Sumatra, Java, Bali, Lombok and Sumbawa, Indonesia. Primates, 25:131-139.
KAWAMOTO, Y.; ISH1DA, T.; SUZUKI, J.; TAKENAKA, O.; VARAVUDHI, P. 1989. A preliminary report on the genetic variations of crab-eating macaques in Thailand. Kyoto Univ. Overseas Res. Rep. Stud. Asian Non-human Primates, 7: 94-103.
KAWAMOTO, Y.; NOZAWA, K.; lSCrIAK, TB. M. 1981. Genetic variability and differentiation of local populations in the Indonesian crab-eating macaque (Macaca fascicularis). Kyoto Univ. Overseas Res. Rep. Stud. Indonesian Macaque, 1: 15-39.
KAWAMOTO, Y.; NOZAWA, K.; MATSUBAYASHI, K.; GOTOH, S. 1988. A population genetic study of crab-eating macaques (Macaca fascicularis) on the island of Angaur, Palau, Micronesia. Folia Primatol., 51: 169-181.
KAWAMOTO, Y.; SURYOBROTO, B. 1985. Gene constitution of crab-eating macaques on Timor. Kyoto Univ. Overseas Res. Rep. Stud. Asian Non-human Primates, 4: 35-40.
KAWANAKA, K. 1973. Intertroop relationships among Japanese monkeys. Primates, 14:113-159. KONDO, M.; KAWAMOTO, Y.; NOZAWA, K.; MATSUBAYASHI, K.; WATANABE, T.; GRIFFITHS, O.; STANLEY, M. A.
1993. Population genetics of crab-eating macaques (Macaca fascicularis) on the island of Mauritius. Amer. J. Primatol., 29: 167-182.
KOYAMA, N.; ASUAN, A.; NATSIR, N. 1981. Socioecological study of crab-eating monkeys in Indonesia. Kyoto Univ. Overseas Res. Rep. Stud. Indonesian Macaque, 1: 1-10.
LAWLER, S. H.; SUSSMAN, R. W.; TAYLOR, L. L. 1995. Mitochondrial DNA of Mauritian macaques (Macaca fascicularis): an example of the founder effect. Amer J. Phys. Anthropol., 96:133-141.
MELNICK, D. J.; HOELZER, G. 1992. Differences in male and female macaque dispersal lead to contrasting distributions of nuclear and mitochondrial DNA variation. Int. J. Primatol., 13: 379-393.
MELNICK, D. J.; JOLLY, C.; KIDD, K. K. 1984. The genetics of a wild populations of rhesus monkeys (Macaca mulatta): I. Genetic variability within and between social groups. Amer. J. Primatol., 63: 341-360.
MORIN, P. A.; KANTHASWANY, S.; SMITH, D. G. 1997. Simple sequence repeat (SSR) polymorphisms for colony management and population genetics in rhesus macaques (Macaca mulatta). Amer. J. Primatol., 42: 199-213.
NEk M. 1972. Genetic distance between populations. Amer. Naturalist, 106: 283-292.
NEI, M. 1973. Analysis of gene diversity in sub-divided populations. Proc. Natl. Acad. Sci. USA, 20: 3321-3323.
NE~, M. 1987. Molecular Evolutionary Genetics. Columbia Univ. Press, New York.
NEI, M.; CHESSER, R. K. 1983. Estimation of fixation indices and gene diversities. Ann. Human Genetics, 47: 253-259.
NOZAWA, K. 1972. Population genetics of Japanese monkeys: 1. Estimation of the effective troop size. Primates, 13:381-393.
NOZAWA, K.; SHOTAKE, T.; KAWAMOTO, Y.; TANABE, Y. 1982. Population genetics of Japanese monkeys: II. Blood protein polymorphisms and population structure. Primates, 23: 252-271.
OHNO, S. 1997. The one ancestor per generation rule and three other rules of mitochondrial DNA inheritance. Proc. Natl. Acad. USA, 94: 8033-8035.
ROSENBLUM, L. L.; SUPRIATNA, J.; MELNICK, D. J. 1997. Phylogeographic analysis of pigtail macaque popula- tions (Macaca nemestrina) inferred from mitochondrial DNA. Amer. J. Phys. Anthropol., 104: 35-45. VAN SCHAIK, C. P.; VAN NOORDWIJK, M. A. 1985. Evolutionary effect of the absence of felids on the social organization of macaques on the island of Simeulue (Macacafascicularisfusca, MILLER, 1903). Folia Primatol., 44:138-147.
Population Genetic Study of Longtail Macaques (Macacafascicularis) 595 SHIMADA, M. K.; SHOTAKE, T. 1997. Genetic variation of blood proteins within and between local populations
of Grivet monkeys (Cercopithecus aethiops aethiops) in Central Ethiopia. Primates, 38: 399-414. SHOTAKE, Z.; SANTIAP1LLAI, C. 1982. Blood protein polymorphisms in the troops of the toque macaque,
Macaca sinica, in Sri Lanka. Kyoto Univ. Overseas Res. Rep. Stud. Asian Non-human Primates, 2: 79-95.
SMITH, D. G.; FERRELL, R. E. 1980. A family study of the hemoglobin polymorphism in Macacafascicu- laris. J. Human. Evol., 9: 557-563.
SMITH, J. M. 1989. Evolutionary Genetics. Oxford Univ. Press, Oxford.
SOUTHWICK, C. H., CADIGAN, E C., JR. 1972. Population studies of Malaysian primates. Primates, 13: 1-18. SUGARDJITO, J., VAN SCHAIK, C. E; VAN NOORDWIJK, M. A; M1TRASETIA, T. 1989. Population status of the
Simeulue monkey (Macaca fascicularis fusca). Amer. J. Primatol., 1 7 : 1 9 7 - 207.
SUPRIATNA, J.; YANUAR, A., MARTARINZA; WIBISONO, H. T.; SINAGA, R.; SIDIK, 1.; 1SKANDAR, 5. 1996. A preliminary survey of long-tailed and pigtailed macaques (Macacafascicularis and Macaca nemestrina) in Lampung, Bengkulu, and Jambi Provinces, Southern Sumatera, Indonesia. Trop. Biodiv., 3:131-139. SUSSMAN, R. W.; TATTERSALL, I. 1981. Behavior and ecology of Macacafascicularis in Mauritius: a pre-
liminary study. Primates, 22: 192-205.
SUSSMAN, R. W., TATTERSALL, 1. 1986. Distribution, abundance, and putative ecological strategy of Macacafascicularis on the island of Mauritius, southwestern Indian Ocean. Folia Primatol., 46: 28-43. TAKAHATA, N.; PALUMBI, S. R. 1985. Nuclear differentiation and gene flow in the finite island model.
Genetics, 109: 441-457.
TAKENAKA, O.; TAKENAKA, A.; ARAKAWA, M.; ISHIDA, T.; SUZUKI, J.; KAWAMOTO, Y.; VARAVUDHI, E 1989. The multiple oL-globin in the crab-eating macaques (Macacafascicularis) and geographical distribu- tion in Thailand. Kyoto Univ. Overseas Res. Rep. Stud. Asian Non-human Primates, 7 : 8 1 - 9 3 . TAKENAKA, A.; UEDA, S.; TERAO, K.; TAKENAKA, O. 1991. Multiple o~-globin genes in crab-eating macaques
(Macaca fascicularis). Mol. Biol. Evol., 8: 320-326.
TANAKA, H.; KAWAMOTO, Y.; ISHIDA, T.; SUZUKI, J.; TAKENAKA, O.; VARAVUDH1, P. 1989. Polymorphism of the vitamin D binding protein (DBP) in Thailand crab-eating macaques (Macaca fascicularis). Kyoto Univ. Overseas Res. Rep. Stud. Asian Non-human Primates, 7: 104-109.
TANAKA, H.; KAWAMOTO, Y.; TERAO, K. 1991. Genetic polymorphism of the vitamin D-binding protein (DBP) in crab-eating macaques (Macaca fascicularis). J. Med. Primatol., 20:126-132.
TEGELSTROM, H. 1986. Mitochondrial DNA in natural populations: an improved routine for the screening of genetic variation based on sensitive silver staining. Electrophoresis, 7: 226-229.
WHEATLEY, B. P. 1980. Feeding and ranging of East Borneon Macaca fascicularis. In: The Macaques: Studies in Ecology, Behavior and Evolution, LINDBURG, D. G. (ed.), Van Nostrand Reinhold, New York, pp. 215-246.
WHITTEN, A. J.; WHITTEN, J. E. J. 1982. Preliminary observations of the Mentawai macaque on Siberut Island, Indonesia. Int. J. Primatol., 4: 445-459.
WILSON, C. C.; WILSON, W. L. 1975. The influence of selective logging on primates and some other animals in East Kalimantan. Folia Primatol., 23: 245-274.
ZHANG, Y.; SHI, L. 1993. Phylogeny of rhesus monkeys (Macaca mulatta) as revealed by mitochondrial DNA restriction enzyme analysis. Int. J. Primatol., 14: 587-605.