DOI: 10.12928/TELKOMNIKA.v14i3.2279 1166
Received July 6, 2015; Revised May 5, 2016; Accepted May 27 2016
Hybrid Tree-Like Mesh Topology as New Wireless
Sensor Network Platform
Muhammad Iqbal1, Muhammad Fuad2, Heru Sukoco*3, Husin Alatas4 1
Department of Computer Engineering, AMIK Teknokrat, Bandarlampung, Indonesia,
2,3Department of Computer Science, Faculty of Mathematics and Natural Sciences, 4
Theoretical Physics Division, Department of Physics, Faculty of Mathematics and Natural Sciences, Bogor Agricultural University, Bogor 16680, Indonesia. Telp./Fax.: +62-251-8625584
*Corresponding author, e-mail: [email protected]
Abstract
In this paper, we propose a new platform for air pollution monitoring system based on wireless sensor network (WSN) with Tree-like Mesh topology. We used ZigBee device and General Packet Radio Service (GPRS) for data transfer protocol. The results of a conducted test showed a good performance in delivering data in real time mode. We found that the fewer hop produced higher throughput but lower delay and packet loss ratio. The system performance demonstrated that the reduction of one hop increased 32.06% of throughput, decreased 23.28% of delay and 0.01% of packet loss ratio.
Keywords: wireless sensor network, general packet radio service, hybrid tree-like mesh topology
Copyright © 2016 Universitas Ahmad Dahlan. All rights reserved.
1. Introduction
Indonesia is a country that faces relatively serious air pollution problems, as the impact of significant economic growth based manufacturing [1]. According to the Center of Clean Air Initiative for Asian Cities [2], industrial and transportation are the main source of air pollution in big cities in Indonesia. The low air quality is very danger to human health if accumulated in high concentration. Therefore, the air quality information is very important to inform the air quality level and its impact to the healthy within a certain period. Air quality information is known Air Pollutant Standard Index (APSI, or known as ISPU in Indonesia). Based on the regulation of the Ministry of Environment, Republic of Indonesia No. KEP-45/MENLH/10/1997, the definition of ISPU is the number that does not have a unit describing the ambient air condition in a certain location and time based on the impact on human health and aesthetic. ISPU is consisted by five main parameters, namely CO, SO2 , NO2 , O3 and dust particles (PM-10) [3].
Gas pollutant monitoring is a way to increase the air quality. Monitoring by network based sensor that used cable was very expensive when in a wide area therefore, the using of communication and information technology be an important and useful way. One thing can be done is air pollution monitoring by using wireless sensor network (WSN) technology.
WSN is a technology that was used to acquire and distribute data that controlled centrally [4]. The application of WSN was very effective in a wide geographical area or in dangerous condition, because people can not check the area routinely [5, 6]. The IEEE 802.15.4 is a standard protocol which was proposed to overcome the low-rate wireless personal area networks (LR-WPAN) and focused on WSN enable. ZigBee device with IEEE 802.15.4 standard is a wireless communication protocol which has some advantages, e. g. low power consumption, cheap, having high fault tolerance, flexible, a low rate data, and having high reliability performance like controlling and monitoring [7-9].
In contrast to the aforementioned topology, this study is aimed to develope a new platform of WSN air pollution monitoring system prototype based on hybrid tree-like mesh topology by using ZigBee protocol/ IEEE 802.15.4 and GPRS for data transmission. We have also performs some tests in the real situation for aspecific ISPU gas namely carbon monoxide (CO) gas environment. The testing location is in Bogor Agricultural University campus.
2. Research Method
The Steps of system prototype design are the architecture system design, the station node design, the coordinator node design, and web-based interface design. The system implementation is in the laboratory scale where it is done based on the previous system designs. The data acquisition is conducted in station node by microcontroller Arduino Leonardo consisting of CO sensor (MQ-7) unit, and Light Dependent Resistor (LDR) dummy to replace the SO2, NO2, and O3 sensors. The data form the sensor data is send from the station node to the coordinator node, use XBee 2mW Wire Antenna-Series 2 wirelessly.
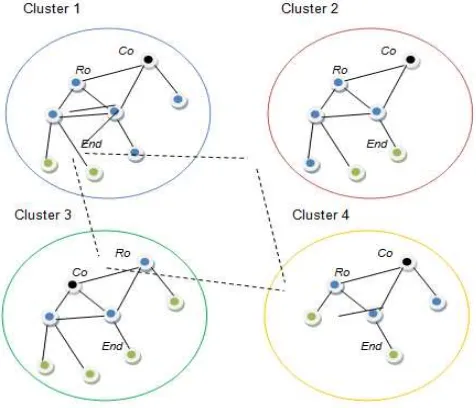
The system architecture design of tree like mesh topology consist of coordinator node, routers, and end device. The router is setted for able to communicates among routers and other end device. The advantages of this system are the ability of routers for self-forming mechanism, self-healing, and supports for multi-hop routing. With these capabilities, if the coordinator node in one cluster was failed or down, one of the routers in the cluster will form a new path with a router in the neighbor clusters, so that the communication between node can be maintained. The system architecture design of tree-like mesh topology is shown in Figure 1.
Figure 1. Topology Hybrid Tree-Like Mesh
2.1. System Analysis
2.1.1. System Performance Analysis
This step is to test the system performance based on the parameter Quality of Service (QoS) that are throughput, delay and packet loss. Throughput is defined in formula (1), while delay is defined in formula (2), and packet loss ratio is defined in formula (3) [7], [12-13]. The WSN analysis aims to determine the performance of system in the real environment. The analysis is based on the condition of object in the field by using the instrument that used in the study. The test scenarios based on the number of hops.
�ℎ����ℎ��� = 8���������������
TELKOMNIKA Vol. 14, No. 3, September 2016 : 1166 – 1174
����� = (����������������� − ���������������) (2)
���������������=��ℎ����������������������−�ℎ����������������������
�ℎ���������������������� �× 100 % (3)
2.1.2. Environmental Analysis
This step is to analyze the system accuracy based on the sensor data that obtained in the field, with ISPU calculation that defined by the Minister of Environment Decree No. KEP-45/MENLH/10/1997. The Calculations of ISPU were defined in formula (4). The calculated ISPU describe the air quality based on the ISPU category. The number and category of ISPU is showed in Table 1. The ISPU calculations are defined as follows:
a. Significant concentration of ambient (Xx) ppm, mg/m3, etc b. Significant number of ISPU (4)
Xx I
�= ��−��
��−��(�� − ��) + �� (4)
I = ISPU calculated Ia = ISPU upper limit Ib = ISPU lower limit
Xa = upper limit ambient Xb = lower limit ambient
Xx = significant concentration of ambient from the measurement.
Table 1. The Index and Categories of ISPU
Index Categories
0-50 Good
51-100 Medium
101-199 Unhealthy 200-299 Very Unhealthy 300-lebih Harmful
3. Results and Discussion
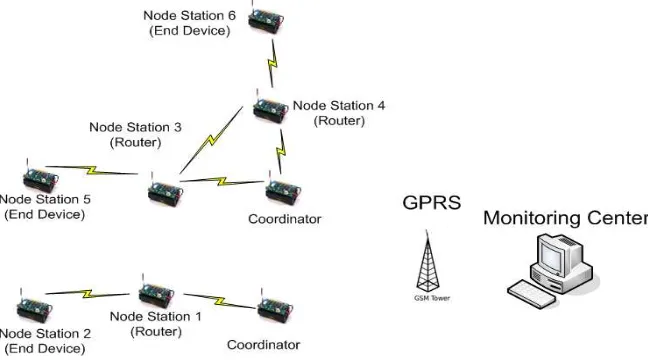
The proposed system architecture with Tree-Like Mesh topology is shown in Figure 2.
Figure 2. WSN Architecture of Air Pollution Monitoring System
sensors. There are two kinds of station node i.e. router station node and end device station node. End device station node is made for several hierarchical router communications. The advantages of this type of network are: the ability to work with self-forming, self-healing, and support with multi-hop routing, so that the data can through the other router station node if the usual router station node was failure or down. (iii) GPRS network that used as the data transmission in a wider area which results from ZigBee network/station node, and connects to the air pollution monitoring system by accesses the internet. (iv) ZigBee network that used for data transmission between station nodes in the network. (iv) Monitoring centre which display the information which results by node station in WSN with web-based interface application.
3.1. Station Node Design
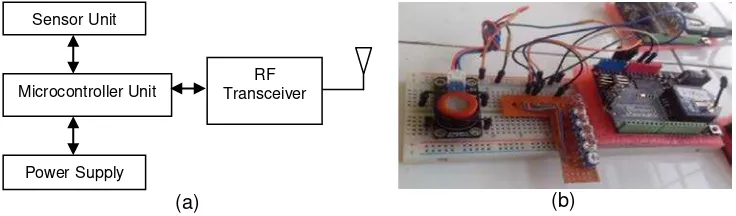
The station is a set of integrated hardware for acquiring the ISPU data and transmits the data wirelessly to the coordinator node. Station node consists of a sensor, Leonardo DFRduino module with XBee socket board, XBee 2mW Wire Antenna-Series 2 and power supply. Figure 3(a) shows the architecture of station node, and 3(b) shows the node station that had been packaged. The station node consists of several sensors which are used for air pollution detection. At station node prototype, there are four sensors that are: one CO sensor (MQ-7), and three dummy sensors (LDR). The dummy sensor is the sensor for simulation before using the real sensor.
Leonardo DFRduino module is used to acquire and process the sensor data. Leonardo DFRduino module is programmed with the integrated development environment (IDE) Arduino software [13]. Leonardo DFRduino programming is used for initialization like serial communication mode, baud rate setting, pin-Mode and analogRead reading, function or formula entering, giving the program delay time, and print to the series, and so on [14]. XBee 2mW Wire Antenna-Series 2 from Digi is used for wirelessly communication between station node and coordinator node. XBee on station node is configured as the end device with AT mode using X-CTU software. The power supply used is battery, this aims for practically and easy to use in the isolated area.
(a) (b)
Figure 3. (a) Station Node Architecture; (b) Station Node
3.2. Implementation of Coordinator Node
Coordinator node is defined as a set of integrated hardware that serves to build and control the data communication with a number of station nodes to air pollution monitoring center. Coordinator node consists of an Leonardo DFRduino module with XBee socket board, XBee 2mW Wire Antenna-Series 2, GPRS module, the Arduino Ethernet Shield, GSM modem and power supply. Figure 4(a) shows the architecture of coordinator node, and Figure 4(b) shows the node coordinator that had been packaged.
Leonardo DFRduino module is programmed by IDE Arduino software. Leonardo DFRduino module programming on the coordinator node consists of three parts, specifically: the declaration, initialization and main program [15]. Declaration section is used to declare the functions for the operation of Ethernet shield, server address setting, IP address coordinator node setting, and so on. Initialization section is used for a serial communication mode; the function is to connect the coordinator node and so on. While the main program is used for command to print the server response, command for send data to the server and so on.
SensorUnit
Microcontroller Unit
PowerSupply
TELKOMNIKA Vol. 14, No. 3, September 2016 : 1166 – 1174
(a) (b)
Figure 4. (a) Node Coordinator Architecture; (b) Coordinator Node
3.3. Web-Based Interface Application
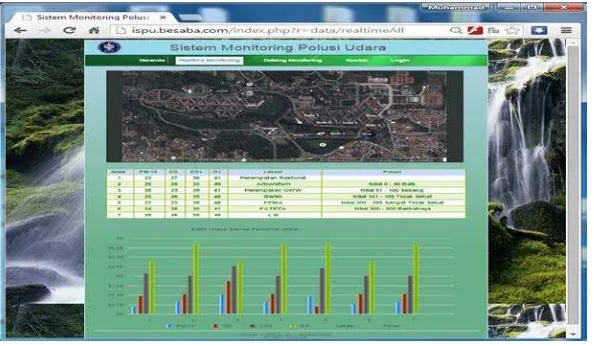
The application of web-based interface allows user to view and monitor ISPU data information form the field, by using the Internet, anytime and anywhere. For the development of web-based application, we used PHP, javascript, and HTML programming. MySQL was used for database in the form of a database management system (DBMS). Figure 5 displays the ISPU web application of the monitoring center based on the location, the type of sensor, and the visualization in a graph. This application consists of the Home menu, Realtime Monitoring, Datalog Monitoring, Contacts, and Login. The function of each menu can be seen in Table 2.
Figure 5.Web Application of Monitoring Center
Table 2. Menu on web-based application
Menu Descriptions
Home This function is for the welcome page, and the brief description about air pollution monitoring system.
Real-time Monitoring
This function is to display the air pollution measurement data in real-time in the form of table and graph based on four ISPU parameters.
Datalog Monitoring
This function is to display all of measurements data based on four ISPU parameters.
Contact This function is to facilitate the visitor when want to express the opinion, criticism, short message, and other idea to the admin of the website.
Login This function is for administrator or user login processes.
3.4. System Implementation and Data Acquisition
The location of implementation the air pollution monitoring system is in the environment of Bogor Agricultural University (IPB) campus. Figure 6 display the location of a node in the environmental of IPB campus. ISPU data information, that resulted by the station node
Ethernet Shield
Microcontroller Unit
PowerSupply
RF Transceiver Module
acquisition, sent to the coordinator node wirelessly, and was showed by real-time at monitoring center web. The process of data acquisition was done for four days, from 08.00 am to 17.00 pm in the environment of Bogor Agricultural University (IPB), Dramaga. Each station node sent the data to coordinator node every second. Then did the recording at each station node with four main parameters, namely CO, SO2, NO2, O3, with the number of data are 400 with payload packet at 52 bytes. The data type is the text file; consist of time, the kind of station node, and sensor value.
Figure 6. The Location of Node in IPB Campus
(a) (b)
(c)
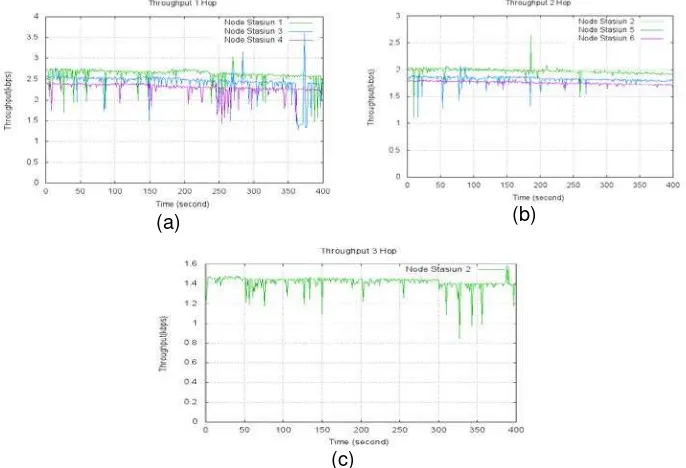
Figure 7. The Comparation of tThroughput (a) 1 Hop; (b) 2 Hops; and (c) 3 Hops
3.4. System Performance Analysis
Testing of the system performance consists of the following two scenarios: (i) 1 hop and 2 hops used in a normal condition, that is no the device that failure or down. (ii) 3 hops used when the coordinator at one of a cluster was down. The second station node formed the new path in the network to reach the coordinator. The following are the analysis of the three performance indicators namely throughput, delay and packet loss.
3.4.1. Throughput Analysis
TELKOMNIKA Vol. 14, No. 3, September 2016 : 1166 – 1174
scenario has a higher throughput than 2 hops and 3 hops, and the 2 hops scenario has a higher throughput than 3 hops. The reduction of 1 hop increases 32.06% of throughput or 0.52 kbps. This is because the reduction of the hop decreases the connection of the station nodes. The comparison of throughput between 1 hop, 2 hops, and 3 hops can be seen in Figure 7.
Table 4. Throughput for 1 Hop, 2 Hops, and 3 Hops
Hop Station nodes Throughput (kbps) Minimum Maximum Average
1
1 1.486 3.036 2.615
3 1.288 3.617 2.399
4 1.430 2.419 2.253
2
2 1.106 2.633 1.972
5 1.112 2.080 1.809
6 1.631 1.825 1.756
3 2 0.844 1.588 1.389
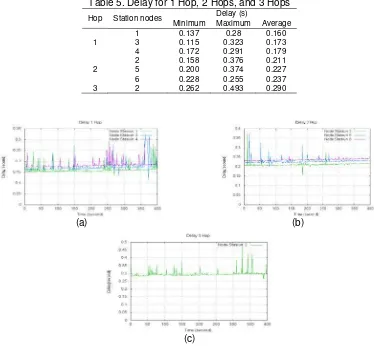
3.4.2. Delay Analysis
The delay measurement is defined as the average of a distance between the packet arrival time and packet start time. The unit of time, that is used, is second. The delay for 1 hop, 2 hops, and 3 hops is shown in Table 5. The results are 1 hop scenario shows a less delay than 2 hops and 3 hops, and the 2 hops scenario demonstrates a less delay than 3 hops. The reduction of 1 hop decreases 23.28% of delay or 0.06 second. This is because the reduction of hop decreases the station nodes which are connected. The comparison of throughput between 1 hop, 2 hops, and 3 hops can be seen in Figure 8.
Table 5. Delay for 1 Hop, 2 Hops, and 3 Hops
Hop Station nodes Delay (s)
Minimum Maximum Average
1 0.137 0.28 0.160
1 3 0.115 0.323 0.173
4 0.172 0.291 0.179
2 0.158 0.376 0.211
2 5 0.200 0.374 0.227
6 0.228 0.255 0.237
3 2 0.262 0.493 0.290
(a) (b)
(c)
3.4.3. Packet Loss Ratio Analysis
Packet loss ratio (PLR) is the ratio between the loss packets with the total number of sent packet to the destination through a certain transmission media. The loss packet during the packet transmission for 1 hop, 2 hops, and 3 hops can be seen in Table 6. Between the scenarios of 1 hop and 2 hops, the loss packet is not too different, this is because the ability of the device and the bandwidth still able to accommodate the amount of data. Between the scenario of 3 hops, with 1 hop and 2 hops, the loss packet increased by 0.01%. The increased of packet loss is caused by the coordinator node that down at one of the clusters, which leads to forming the longer new path.
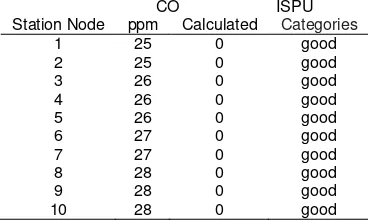
The sensor data and the ISPU data from ten stations node are shown in Table 3. Based on the results of CO measurement, was obtained that the ISPU in the environment of IPB campus is 0 or in a good category. This indicates that the air quality in the environment of IPB is good for CO parameter.
Table 3. The Results of CO Measurement in 10 Station Node
Station Node
The testing of a system which had done by accesses the website of air pollution monitoring system in real time was worked well. The system is able to give the ISPU information in real time in four parameters that are CO, SO2, NO2, dan O3. Figure 4 displaying the website of air pollution monitoring system for each station node and sensor and the visualization by the chart.
4. Conclusion
TELKOMNIKA Vol. 14, No. 3, September 2016 : 1166 – 1174 References
[1] Resosudarmo BP, Mahi BR, Kuncoro A, Handayani SB. Emisi polusi udara dan air sungai dalam struktur industri Indonesia. Development. 1997; 25(3).
[2] [CAI-Asia] Clean Air Initiative for Asian Cities Center. Indonesia: air quality profile-2010 edition. Pasig City, Philippines. 2010.
[3] [BAPEDAL] Badan Pengendalian Dampak Lingkungan. Pedoman teknis perhitungan dan pelaporan serta informasi indeks standar pencemar udara (ISPU). Jakarta (ID): BAPEDAL; 1997.
[4] Lewis FL. Wireless sensor network. Smart Environments: Technologies, Protocols, and Applications. New York: John Wiley. 2004.
[5] Martinez K, Hart JK, Ong R. Environmental sensor networks. Computer. 2004; 37(8): 50-56.
[6] Roy S, Anurag D, Bandyopadhyay S. Testbed implementation of a pollution monitoring system using wireless sensor network for the protection of public spaces. International Journal of Business Data Communications and Networking (IJBDCN). 2009; 5(4): 16-32.
[7] Akyildiz IF, Su W, Sankarasubramaniam Y, Cayirci E. A survey on sensor networks. Communications Magazine, IEEE. 2002; 40(8): 102-114.
[8] Uikey R, Sharma S. ZigBee Cluster Tree Performance Improvement Technique. International Journal of Aplications (0975-8887) volume. 2013; 62.
[9] XU Dengyuan, et al. Power Balance AODV Algorithm of WSN in Agriculture
Monitoring. TELKOMNIKA (Telecommunication Computing Electronics and Control). 2013; 11(4):
811-818.
[10] Almazroi, Abdulaleem Al, Ngadi MA. Robust Path Construction for Reliable Data Transmissions in
Node Disjoint Multipath Routing. TELKOMNIKA (Telecommunication Computing Electronics and
Control). 2015; 13(3): 904-921.
[11] Xu M, Ma L, Xia F, Yuan T, Qian J, Shao M. Design and implementation of a wireless sensor network for smart homes. In Ubiquitous Intelligence & Computing and 7th International Conference on Autonomic & Trusted Computing (UIC/ATC), 2010 7th International Conference on IEEE. 2010: 239-243
[12] Birla J, Sah B, BRCM B. Performance Metrics in Ad-hoc Network. BRCM, Bahal. 2012.
[13] Mraz L, Cervenka V, Komosny D, Simek M. Comprehensive performance analysis of ZigBee technology based on real measurements. Wireless Pers Commun. 2013; 71: 2783–2803.
[14] Aziz M, Rustami E, Maulina W, Rahmat M, Alatas H, Seminar KB. Measuring air pollutants standard index (ISPU) with photonics crystal sensor based on wireless sensor network (WSN). International Conference on Instrumentation, Communication, Information Technology and Biomedical Engineering. Bandung, Indonesia. 2011: 348-351.