accredited by DGHE (DIKTI), Decree No: 51/Dikti/Kep/2010 545
Sparse Representation for Detection of
Microcalcification Clusters
Xinsheng Zhang*1, Minghu Wang2, Ji Ma3
School of Management, Xi’an University of Architecture and Technology No. 13 Yanta Road, Xi’an, Shaan Xi, China 710055, Tel: +86-29-88664514 e-mail: [email protected]*1, [email protected], [email protected]
Abstrak
Makalah ini menyajikan sebuah pendekatan untuk mendeteksi MC di mammogram dengan memberikan masalah deteksi untuk menemukan representasi jarang dari sampel uji terhadap sampel pelatihan. Sampel pelatihan kebenaran MC di mammogram diasumsikan dikenal sebagai a priori. Dari sampel ini dari kelas objek yang diinginkan, kosakata bagian objek yang kaya informasi secara otomatis dibangun. Representasi jarang dihitung dengan pendekatan kuadrat terkecil l1-regularized dengan menggunakan metode titik dalam. Metode berdasarkan representasi jarang mengungkapkan setiap sampel pengujian sebagai kombinasi linear dari semua sampel dari pelatihan kosa kata. Vektor koefisien jarang diperoleh dengan kuadrat terkecil l1-regularized melalui pembelajaran. Deteksi MC dicapai dengan mendefinisikan fungsi diskriminan dari vektor koefisien jarang untuk setiap kategori. Untuk mengetahui kinerjanya, metode yang diusulkan diterapkan untuk set data DDSM dan dibandingkan dengan mesin vektor pendukung (SVM) dan mesin vektor dukungan kembar (TWSVM). Hasil percobaan menunjukkan bahwa kinerja metode yang diusulkan sebanding atau lebih baik dari metode-metode tersebut. Selain itu, metode yang diusulkan lebih efisien daripada metode berdasarkan SVM dan TWSVM karena tidak membutuhkan pemilihan model dan optimasi parameter.
Kata kunci: deteksi, kluster kalsifikasi mikro, norma- l1, representasi jarang
Abstract
We present an approach to detect MCs in mammograms by casting the detection problem as finding sparse representations of test samples with respect to training samples. The ground truth training samples of MCs in mammograms are assumed to be known as a priori. From these samples of the interest object class, a vocabulary of information-rich object parts is automatically constructed. The sparse representation is computed by the l1-regularized least square approach using the interior-point method.
The method based on sparse representation expresses each testing sample as a linear combination of all the training samplesfrom the vocabulary. The sparse coefficient vector is obtained by l1-regularized least
square through learning. MCs detectionis achieved by defining discriminatefunctions from the sparse coefficient vector for each category. To investigate its performance, the proposed method is applied to DDSM datasets and compared with support vector machines (SVMs) and twin support vector machines (TWSVMs). The experimental results have shown that the performance of the proposed method is comparable with or better than those methods. In addition, the proposed method is more efficient than SVMs and TWSVMs based methods as it has no need of model selection and parameter optimization.
Keywords: detection, l1-norm, microcalcificationclusters, sparse representation
1. Introduction
A Breast cancer, the most common tumor disease in women, is one of the major causes of death among middle-aged women in developed and developing countries, with incidences increasingly on the rise during recent years. Currently, mammographic screenings are one of the most reliable methods for early detection and diagnosis, which is crucial to the effectiveness of treatment methods.
density, approximate 0.1-1 mm in diameter. Isolated microcalcifications are not dangerous, but a microcalcification cluster, which is a small region containing three or more microcalcifications per 5mm×5mmarea, might be an early sign of breast cancer.
Because of its importance in breast cancer diagnosis accurate detection of MCs has become a key research and application task, and a number of approaches have recently been developed, which have been greatly assisting doctors and radiologists in diagnosing breast cancer [1, 2]. Among them, focusing on image segmentation and specification of regions of interest (ROI), several methods have been proposed, such as classical image filter and local threshold [3, 4], and techniques based on mathematical morphology [5], fractal models [6], optimal filters [7], wavelet analysis and multi-scale analysis[3]. Various classification approaches have also been presented to characterize MCs, such as rule-based systems [8], fuzzy logic systems[9, 10], statistical methods based on Markov random fields(MRF) [11], and support vector machines [12]. In the past decade, most of the work reported in the literatures has employed neural networks in MCs characterization [5, 13, 14]. With the development of SVMs, various SVMs have been designed to categorize ROIs[15].
However, the successful application of mammography technology in breast cancer detection greatly depends on the careful design of two important modules within a breast cancer detection system: feature selection and sample classification. Feature selection mainly has two purposes: 1) to reduction dramatically the number of pixels used in classification to manage the “curse of dimensionality” and 2) selected features might have relatively more discrimination information, so as to get a good classification performance. The second component, sample classification, is a challenging issue for a problem with a small number of learning samples and yet a large number of pixel features. The number of samples available for analysis can ranges from tens to hundreds. Many established methods have been proposed address the challenge. According to [16], these methods can be classified into the following groups: 1) classical methods such as Fisher’s linear discriminant analysis, logistic regression, K-nearest neighbor, and generalized partial least square; 2) classification trees and aggregation methods such as CART, random forest, bagging, and boosting; 3) machine learning methods such as neural network [17] and support vector machines(SVMs) [18]; and 4) generalized methods such as flexible discriminant analysis, mixture discriminant analysis, and shrunken centroid method.
In this paper, to detect early sign of this disease and to aid doctors to diagnose breast cancer in early stage, we propose a novel approach for classification, called sparse representation based detection technology, inspired by the recent progress in l1-norm minimization-based methods [19, 20] such as basis pursuit denoising, compressive sensing [21] for sparse signal reconstruction, and Lesso algorithm for feature selection.
Sparse representations are representations that account for most or all information of a signal with a linear combination of a small number of elementary signals called atoms. Sparseness is one of the reasons for the extensive use of popular transforms such as the Discrete Fourier Transform, the wavelet transform and the Singular Value Decomposition. The aim of these transforms is often to reveal certain structures of a signal and to represent these structures in a compact and sparse representation. Sparse representations have therefore increasingly become recognized as providing extremely high performance for applications as diverse as: noise reduction, compression, feature extraction, pattern classification and blind source separation. Sparse representation ideas also build the foundations of wavelet denoising and methods in pattern classification, such as in the Support Vector Machine and the Relevance Vector Machine, where sparsity can be directly related to learnability of an estimator.
Ideally, a test sample can be represented just in terms of the training samples of the same category. Hence, when the testing sample is expressed as linear combination of all the training samples, the coefficient vector is sparse, that is, the vector has relatively few nonzero coefficients. Test samples of same category will have similar sparse representation, while different categories will result in different sparse representations. In order to recover the sparse coefficient vector, l1-regularized least square [22] is used.
The rest of this paper is organized as follows: background of sparse representation and the novel algorithm of MCs classification using sparse representation are given in Sections 2. MCs detection procedure in experiments and accordingly the experimental results are reported in Section 3. Finally, conclusions are drawn in Section 4.
2. Research Method
sample with N as the number of categories. For a testing sample yÎ Rd, the problem of sparse
representation is to find a column vector c= [ , ,..., ]c c1 2 cn T such that combinational optimization. Approximation solution can be obtained by replacing the l0-norm in
Eq. (2) by the lp-norm,
which allows for certain degree of noise, is to find a vector
c
such that the following objective function is minimized:Recent development in the emerging theory of sparse representation and compressed sensing reveals that if the solution of Eq. (2) sought is sparse enough, the solution of the l0 -minimization problem is equal to the solution to the following l1-minimization problem[22], which takes p=1 in Eq. (4): quadratic programming methods. Even more efficient methods are available when the solution is known to be very sparse.
2.2. Sparse Representation and Sparse Solution
can settle this problem. For instance, we can simply assign
y
to the subject with the single largest entry ofc
. However, such heuristics do not harness the subspace structure associated with MCs batches. To better harness this structure, we instead classifyy
based on how well the coefficients associated with the training images of each subject reproducey
. For eachsubject i, we defines its characteristic function : n n i
d R ® R which selects the coefficients
associated with the ith class. For n
x Î R , ( ) n
i x
d Î R is a new vector whose only nonzero entries are the entries in
x
that are associated with the class I, and whose entries associated with all other subjects are zero. The classification algorithm is summarized in Algorithm 1 below.Algorithm 1 (MCs classification using sparse representation)
Input: A matrix of training images AÎ Rm n´ for two subjects (MCs or not), a linear transform
d m´
Î
D R , and an error tolerance ε.
1: Compute features y%= Dyand A° = DA, and normalize y%and columns of A°to unit length.
2: Solve the convex optimization problem:
1 '
min '
n
R
Î
= c
c c subject to y= Ac, and
{
}
2 1( , ) min .
J l = - +l
c
c Ac y c
3: Compute the residuals °
2
( ) i
r y = y%- Ac for i= + -1, 1
Output: ( ) arg min ( )
i i
f y = r y
3. Results and Analysis 3.1. Experimental Methods
Up till now, we have shown our new approach to detect MCs in mammogram. In this section we evaluate the performance of our method by using the real mammogram data from DDSM. The data in the training, test, and validation sets were randomly selected from the preprocessed dataset. Each selected sample was covered by a 115x115 window whose center coincided with the center of mass of the suspected MCs. The blocks included 1000 with true MCs and 1000 with normal tissue. 75% of the blocks were assigned to the training set, 25% to the test set.
For a given digital mammography image and a training image set, we consider the MCs detection process as the following steps:
• Step 1. Preprocess the mammography image by removing the artifacts, suppressing the inhomogeneity of the background and enhancing the microcalcifications.
• Step 2. At each pixel location in the image, anx= Am m´ small window to describe its surrounding image feature.
• Step 3. Apply Algorithm 1 to make decision whether x belongs to MCs class or not.
Experiments are designed to quantitatively verify the performance of sparse representation method for MCs detection using mammography images. The performance metric used in this study is accurate, obtained by stratified 5-fold cross-validation. We compare our approach with thestare-of-the-art algorithms, SVMs, and twin support vector machines, which have been successfully applied in MCs detection.
3.2. Experimental Results and Analysis
All experiments are performed on a PC with DUO Intel 2.93G CPU and 2G memory under Windows 7. MATLAB 2010 is used to implement sparse representation method. The optimization is done by l1_ls MATLAB package. l1_ls is a MATLAB implementation of the
interior-point method for l1-regularized least squares.
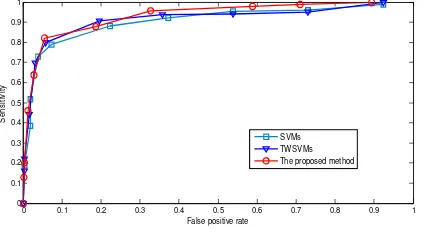
From Figure 1, it can be shown that, the proposed algorithm has a higher detection accuracy rate compared to SVMs and TWSVMs with the same configuration. By using the same test samples, compared with SVMs and TWSVMs, The proposed method has a better detection performance when we train the classifier. In particular, the proposed method achieved the averaged sensitivity of approximately 92.17% with respect to 7.83% false positive rate and Az=0.9507. With the same training data set and test data set, the TWSVMs classifier achieved a sensitivity of 90.01%, 9.63% false positive rate and Az=0.9459, and SVMs achieved a sensitivity of 87.13%, 9.88% false positive rate and Az=0.9298.Comparisons of the proposed methodology with others reported in the literatures are not straightforward because those experiments were conducted on different data. Using fractals models and neural networks, L. Bocchiet al. [6] reported cluster detection results of about TPR=87% and FPR=7% in their test set. J. Jiang et al. [23] used a genetic algorithm design to classify and detect MCs with manually selected 300 MC-present blocks and 300 non-MC blocks from DDSM, and achieved their experimental results with Az = 0.987. Experiments using MIAS dataset are reported in [24]. The performance of the SVM was Az=0.79 and 0.77 for the original and enhanced feature set from Nijmegen database, respectively, while for the MIAS dataset the corresponding characterization scores were Az=0.81 and 0.80. With neural network classifier, the corresponding performance for the Nijmegen dataset was Az = 0.70 and 0.76 while for the MIAS dataset it was Az=0.73 and 0.78.
Table 1. Experimental Results of the proposed method for MCs detection, compared with SVM and TWSVM Classifier
Method Sensitivity Specificity Az
The Proposed Method
92.17% 91.68% 0.9507
TWSVMs 90.01% 90.37% 0.9459 SVMs 87.13% 90.12% 0.9298
Figure. 1 Roc curves of MCS detection using the proposed method, compared with SVMs and
TWSVMs classifier
4. Conclusion
In this paper, we have described a new approach for breast cancer diagnosis using mammography images. The new method based on sparse representation expresses each testing sample as a linear combination of all the training samples. The sparse coefficient vector is obtained by l1-regularized least square through learning or training. MCs classification is
achieved by defining discriminating functions from the sparse coefficient vector for each category. Since l1-normminimization leads to sparse solution, we call the new approach sparse
representation based MCs detection.
Experimental results show that sparse representation approach can match the best performance achieved by the-state-of-arts classifiers. Furthermore, the new approach has no need of model selection and the corresponding parameter optimization. In the future, one direction of our research is to investigate how to classify multiple testing samples by solving only one optimization problem to improve its efficiency.
Acknowledgement
This work presented in our paper is supported by the key discipline of Shaanxi Province, and the Scientific Research Program Funded by Shaanxi Provincial Education Department (Program No. 12JK0741, No. 09JK563 and No. 09JK542). The authors are grateful for the anonymous reviewers who made constructive comments.
0 0.1 0.2 0.3 0.4 0.5 0.6 0.7 0.8 0.9 1 0
0.1 0.2 0.3 0.4 0.5 0.6 0.7 0.8 0.9 1
False positive rate
S
e
n
s
it
iv
it
y
References
[1] Cheng H, Cai X, Chen X, Hu L, Lou X. Computer-aided detection and classification of microcalcifications in mammograms: a survey. Pattern Recognition. 2003; 36(12): 2967-2991. [2] Marrocco C, Molinara M, D'Elia C, Tortorella F. A computer-aided detection system for clustered
microcalcifications. Artificial Intelligence in Medicine. 2010; 50(1): 23-32.
[3] Bagci AM, Cetin AE. Detection of microcalcifications in mammograms using local maxima and adaptive wavelet transform analysis. Electronics Letters. 2002; 38(22): 1311-1313.
[4] Nakayama R, Uchiyama Y, Yamamoto K, Watanabe R, Namba K. Computer-aided diagnosis scheme using a filter bank for detection of microcalcification clusters in mammograms. IEEE Transactions on Biomedical Engineering. 2006; 53(2): 273-283.
[5] Halkiotis S, Botsis T, Rangoussi M. Automatic detection of clustered microcalcifications in digital mammograms using mathematical morphology and neural networks. Signal Processing. 2007; 87(7): 1559-1568.
[6] Bocchi L, Coppini G, Nori J, Valli G. Detection of single and clustered microcalcifications in mammograms using fractals models and neural networks. Medical Engineering & Physics. 2004; 26(4): 303-312.
[7] Gulsrud TO, Husoy JH. Optimal filter-based detection of microcalcifications. IEEE Transactions on Biomedical Engineering. 2001; 48(11): 1272-1281.
[8] Riyahi-Alam N, Ahmadian A, Tehrani JN, Guiti M, Oghabian MA, Deldari A, editors. Segmentation of suspicious clustered microcalcifications on digital mammograms: using fuzzy logic and wavelet coefficients. Proc IEEE Int'l Conf Signal Processing( ICSP '04); 2004.
[9] Cheng H, Wang J, Shi X. Microcalcification detection using fuzzy logic and scale space approaches. Pattern Recognition. 2004; 37(2): 363-375.
[10] Mohanalin, Beenamol, Kalra PK, Kumar N. A novel automatic microcalcification detection technique using Tsallis entropy & a type II fuzzy index. Computers & Mathematics with Applications. 2010; 60(8): 2426-2432.
[11] Lee GG, Chen CH, editors. A multiresolution wavelet analysis and Gaussian Markov random field algorithm for breast cancer screening of digital mammography. Proc IEEE Int'l Conf Nuclear Science Symposium; 1996.
[12] D'Elia C, Marrocco C, Molinara M, Poggi G, Scarpa G, Tortorella F, editors. Detection of microcalcifications clusters in mammograms through TS-MRF segmentation and SVM-based classification. Proc IEEE Int'l Conf Pattern Recognition( ICPR 2004). Cambridge, England. 2004. [13] Yu S, Guan L. A CAD system for the automatic detection of clustered microcalcification in digitized
mammogram films. IEEE Transactions on Medical Imaging. 2000; 19(2): 115-126.
[14] Jiang J, Trundle P, Ren J. Medical image analysis with artificial neural networks. Computerized Medical Imaging and Graphics. 2010; 34(8): 617-631.
[15] El-Naqa I, Yongyi Y, Wernick MN, Galatsanos NP, Nishikawa RM. A support vector machine approach for detection of microcalcifications. IEEE Transactions on Medical Imaging. 2002; 21(12): 1552-1563.
[16] Wei L, Yang Y, Nishikawa RM, Jiang Y. A study on several Machine-learning methods for classification of Malignant and benign clustered microcalcifications. IEEE Transactions on Medical Imaging. 2005; 24(3): 371-380.
[17] Gupta M, Kumar R, Gupta RA. Neural Network Based Indexing and Recognition of Power Quality Disturbances. TELKOMNIKA. 2011; 9(2): 227-236.
[18] Yuniarti A, Nugroho AS, Amaliah B, Arifin AZ. Classification and numbering of dental radiographs for an automated human identification system. TELKOMNIKA. 2012; 10(1): 137-146.
[19] Agarwal S, Awan A, Roth D. Learning to detect objects in images via a sparse, part-based representation. IEEE Transactions on Pattern Analysis and Machine Intelligence. 2004; 26(11): 1475-1490.
[20] Wright J, Yang AY, Ganesh A, Sastry SS, Ma Y. Robust face recognition via sparse representation. IEEE Transactions on Pattern Analysis and Machine Intelligence. 2008: 210-227.
[21] Swastika W, Haneishi H. Compressed sensing for thoracic MRI with partial random circulant matrices. Telkomnika. 2012; 10(1): 147-154.
[22] Kim SJ, Koh K, Lustig M, Boyd S, Gorinevsky D. An interior-point method for large-scale l1-regularized least squares. IEEE Journal of Selected Topics in Signal Processing. 2007; 1(4): 606-617.
[23] Jiang J, Yao B, Wason A. A genetic algorithm design for microcalcification detection and classification in digital mammograms. Computerized Medical Imaging and Graphics. 2007; 31(1): 49-61.