DOI: 10.12928/TELKOMNIKA.v14i1.3096 772
H-WEMA: A New Approach of Double Exponential
Smoothing Method
Seng Hansun*1, Subanar2 1
Universitas Multimedia Nusantara, Jl. Boulevard Gading Serpong, Scientia Garden, Tangerang
2Universitas Gadjah Mada, Jurusan Matematika FMIPA UGM, Sekip Utara, Yogyakarta
*Corresponding author, e-mail: [email protected], [email protected]
Abstract
A popular smoothing technique commonly used in time series analysis is double exponential smoothing. Basically, it’s an improvement of simple exponential smoothing which does the exponential filter process twice. Many researchers had developed the technique, hence Brown’s double exponential smoothing and Holt’s double exponential smoothing. Here, we introduce a new approach of double exponential smoothing, called H-WEMA, which combines the calculation of weighting factor in weighted moving average with Holt’s double exponential smoothing method. The proposed method will then be tested on Jakarta Stock Exchange (JKSE) composite index data. The accuracy and robustness level of the proposed method will then be examined by using mean square error and mean absolute percentage error criteria, and be compared to other conventional methods.
Keywords: Holt’s double exponential smoothing, H-WEMA, time series analysis, weighted moving average
Copyright © 2016 Universitas Ahmad Dahlan. All rights reserved.
1. Introduction
Based on the definition given by Organisation for Economic Co-operation and Development (OECD) Glossary of Statistical Terms, a time series is a set of regular time-ordered observations of a quantitative characteristic of an individual or collective phenomenon taken at successive, in most cases equidistant, periods/ points of time [1]. To comprehend the characteristics of a time series data, many researchers have developed time series analysis methods with the final aim to find a pattern that can be used to forecast future event or data [2-4]. Some researchers even used the soft computing methods, such as fuzzy, neural networks, or hybrid methods to achieve the same goal [5-9].
Moving average is a popular conventional time series analysis method that has been used widely by people due to its easiness, objectiveness, robustness, and usefulness [10, 11]. It is widely employed within the realm of financial analysis, such as stock market. Clif Droke [12] defines a moving average as an indicator that shows the average value of a security’s price over a period of time. There are various kinds of moving average methods, but their underlying purpose remain the same, that is to track the trend determination of the given time series data [10, 13]. The simplest one is simple moving average where each point in time series data is weighted the same regardless of where or when it occurs in the sequence. Weighted moving average is another type of moving average which gives a different weighting factor for each point in time series data. Another type of moving average is exponential moving average which is a variation of weighted moving average that used exponential number as the basis in forming weighting factors in time series analysis. Some other researchers even tried to combine the moving average method with other methods, such as autoregressive and neural networks to represent several types of time series data [14-16].
In this paper, we will further develop the hybrid method, by modifying and combining the weighted moving average method with Holt’s double exponential smoothing method. Holt’s double exponential smoothing method is a varian of exponential smoothing method which been widely used to predict the pattern of a time series data with a trend in it. The proposed method will then be tested on Jakarta Stock Exchange (JKSE) composite index data and be compared with other moving average methods, such as weighted moving average method and Holt’s double exponential smoothing method. The results then will be compared by using mean square error and mean absolute percentage error criteria to get the accuracy and robustness level of the proposed method compared to the other moving average methods.
2. The Proposed Method
Basically the proposed method will combine the weighted moving average method with Holt’s double exponential smoothing method. Therefore we will begin this chapter with the discussion of weighted moving average method.
2.1. Weighted Moving Average
Weighted moving average (WMA) is an improvement form of simple moving average, which gives a greater weight to more recent data than the older ones [20]. The weighting factors are calculated from the sum of days used in time series data, also known as the ‘sum of digits’ [11]. The formula of WMA can be described as:
⋯
⋯ (1)
Where refers to the period or span number of forecasting formula and refers to the value of time series data at point [20].
2.2. Holt’s Double Exponential Smoothing
Holt’s double exponential smoothing, also known as Holt’s linear exponential smoothing, is a type of double exponential smoothing widely used by people. This technique not only smooth the trend and the slope directly by using different smoothing constant, but also provides more flexibility in selecting the rates at which trend and slopes are tracked [21].
There are three equations incorporated in this technique [22, 23]:
(2)
(3)
(4)
Where:
refers to the actual value in time refers to the process smoothing constant, refers to the trend smoothing constant,
refers to the smoothed constant process value for period refers to the smoothed trend value for period
refers to the forecast value for period , where is the current time period
As suggested by NIST [19], to set the initial values for and we will use the following equations:
(5)
2.3. H-WEMA: Holt’s Weighted Exponential Moving Average
In this research, we use weighted moving average’s weighting factor calculation and combine it with the Holt’s double exponential smoothing method. The proposed method will be called Holt’s weighted exponential moving average (H-WEMA). The procedures of the proposed method can be described as following steps.
(1) Calculate the base value, , using equation (1) for a given time series data and periods.
(2) Using the base value obtained, calculate the forecasting value using formula (2) – (4), whereas:
(7)
(8)
Will be used to substitute the initial values for and as stated in the Equation (5) and (6). (3) Return to step (1) until each data point in the time series data given have ended. In order to know the accuracy and robustness level of the proposed method against other moving average methods, we use two most common criteria, i.e. mean square error (MSE) and mean absolute percentage error (MAPE).
2.4. Mean Square Error
Mean square error (MSE) is the average of the square of error sum between the forecasted data and the real (actual) data. As described by Lawrence et al [24], the formula can be written as follows:
∑
(9)
Where denotes the number of data and denotes the forecasting error from . Here, is the actual data and is the forecasted data.
2.5. Mean Absolute Percentage Error
Mean Absolute Percentage Error (MAPE) value gives us an indication about how much the average of absolute error of the forecasted data compare to the actual data, and denotes by the formula [24],
∑
(10)
Where denotes the number of data and denotes the forecasting error from . The actual data is denoted by , while denote the forecasted data.
3. Results and Discussion
The experiment to test the accuracy and robustness level of the proposed method will be done by implementing the proposed method to forecast Jakarta Stock Exchange (JKSE) composite index data. The number of data been used were 100 JKSE data taken monthly from April 2007 to July 2015 from Yahoo! Finance [25]. The length or span data as well as the initial data can be chosen freely by the user. Mean square error and mean absolute percentage error will be used to calculate and compare the accuracy and robustness level of the proposed method against the other two moving average method, i.e. weighted moving average (WMA) and Holt’s double exponential smoothing (H-DES).
Figure 1. Interface of the system
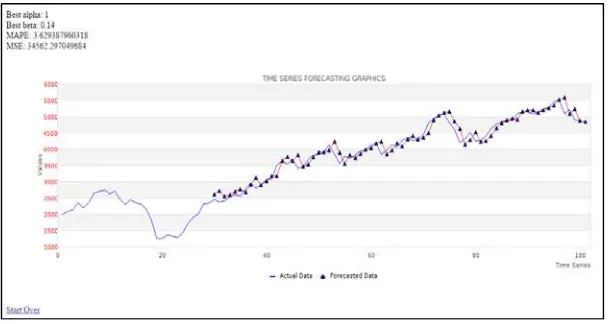
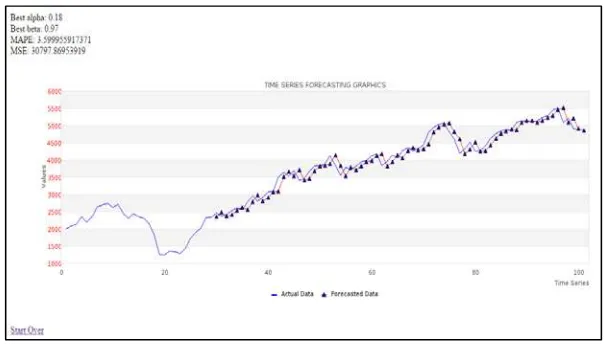
The graph of forecasted data which had been calculated using weighted moving average (WMA), Holt’s double exponential smoothing (H-DES), and Holt’s weighted exponential moving average (H-WEMA) are shown on Figure 2, Figure 3, and Figure 4 consecutively. The actual data is denoted by the blue line and the forecasted data is denoted by the red line with a triangle mark on each forecasted point.
Figure 2. Weighted Moving Average forecasting results
Figure 4. Holt’s Weighted Exponential Moving Average forecasting results
The experiments then be continued by using different number of initial data for each moving average method. We will use 10 different numbers of initial data and calculate the accuracy and robustness level using mean square error (MSE) and mean absolute percentage error (MAPE) criteria as can be seen in Table 1.
Table 1. MSE and MAPE comparison of each method
∑ of initial data MSE MAPE
WMA H-DES H-WEMA WMA H-DES H-WEMA
9 92683.89 33536.94 32754.80 8.7223 4.5829 4.7246
14 95814.61 35005.28 32699.05 8.8300 4.8062 4.6059
19 87023.81 38260.21 29973.83 7.8731 4.9383 4.0256
24 83357.75 32254.71 31092.93 6.8425 3.7853 3.8525
29 72435.79 34562.30 30797.87 5.6890 3.6294 3.6000
34 74278.44 33061.38 32411.76 5.5308 3.2849 3.5962
39 75874.49 37851.70 32802.82 5.4092 3.5967 3.4391
44 69022.13 33952.80 31735.53 4.9599 3.0839 3.3439
49 71607.38 36439.93 31230.47 4.9678 3.2198 3.1808
54 71058.42 39563.08 29629.27 4.8121 3.4138 3.0225
Average 79315.67 35448.83 31512.83 6.36367 3.83412 3.73911
Table 1 shows us the different MSE and MAPE values for each method and each experiment. As can be seen on the table, the average MSE and MAPE values of the proposed method are the smallest among the other methods, which means that H-WEMA gives a better forecasting results (better accuracy and robustness) rather than WMA and H-DES method. Therefore, the proposed method can be used as a better forecasting tool in time series analysis rather than the other two moving average methods.
4. Conclusion
In this paper, we develop a new approach of moving average method, which combines the basic formula of weighted moving average (WMA) to get a base value, and use the base value to get the forecasted value using Holt’s double exponential smoothing (H-DES) formula.
The experimental results on 100 Jakarta Stock Exchange (JKSE) composite index data show a promising result. The accuracy and robustness level of the proposed method excels both the weighted moving average and the Holt’s double exponential smoothing methods, as can be concluded from the small mean square error and mean absolute percentage error values.
autoregressive integrated moving average (ARIMA) method. Another study to combine other moving average methods, such as Holt-Winters triple exponential smoothing can also be taken in the future.
References
[1] OECD Glossary of Statistical Terms. Time Series. 2013.
[2] Subanar, Suhartono. Wavelet Neural Networks untuk Peramalan Data Time Series Finansial.
Program Penelitian Ilmu Dasar Perguruan Tinggi. FMIPA, Universitas Gadjah Mada, Yogyakarta.
2009.
[3] Boediono, Koster. Teori dan Aplikasi Statistika dan Probabilitas. Bandung: PT. Remaja Rosdakarya. 2001.
[4] Render B, Stair Jr RM, Hanna ME. Quantitative Analysis for Management. Eighth Edition. New Jersey: Pearson Education, Inc. 2003.
[5] Popoola AO. Fuzzy-Wavelet Method for Time Series Analysis. Dissertation. Surrey: Department of Computing, School of Electronics and Physical Sciences, University of Surrey; 2007.
[6] Stevenson M, Porter JE. Fuzzy Time Series Forecasting using Percentage Change as the Universe of Discourse. World Academy of Science, Engineering and Technology. 2009; 27(55): 154-157. [7] Chen SM, Hsu CC. A New Method to Forecast Enrollments using Fuzzy Time Series. International
Journal of Applied Science and Engineering. 2004; 2(3): 234-244.
[8] Hassan S, Jaafar J, Samir BB, Jilani A. A Hybrid Fuzzy Time Series Model for Forecasting.
Engineering Letters. 2012; 20(1).
[9] Yu Y. Evaluation of Wavelet Neural Network for Predicting Financial Market Crisis. Proceedings of the 1st International Conference on Information Science and Engineering (ICISE). Nanjing. 2009: 4861-4864.
[10] Murph C. Moving Averages. 2015. http://www.investopedia.com/university/movingaverage/
[11] Dash S. A Comparative Study of Moving Averages: Simple, Weighted, and Exponential. 2012. http://www.tradestation.com/~/media/Files/TradeStation/Education/Labs/Analysis%20Concepts/A%2 0Comparative%20Study%20of%20Moving%20Averages/Moving%20Averages.ashx.
[12] Droke C. Moving Averages Simplified. United States of America: Marketplace Books. 2001.
[13] Hwa NE. Different Uses of Moving Average (MA). 2007. http://www.chartnexus.com/learning/static/pulses_apr2007.pdf
[14] Abdullah L. ARIMA Model for Gold Bullion Coin Selling Prices Forecasting. International Journal of Advances in Applied Sciences (IJAAS). 2012; 1(4): 153-158.
[15] Suparman, Doisy M. Hierarchical Bayesian of ARMA Models Using Simulated Annealing Algorithm.
TELKOMNIKA Telecommunication Computing Electronics and Control. 2014; 12(1): 87-96.
[16] Thakur A, Kumar S, Tiwari A. Hybrid Model of Gas Price Prediction Using Moving Average and
Neural Network. Proceedings of 1st International Conference on Next Generation Computing
Technologies (NGCT). Dehradun. 2015: 735-737.
[17] Hansun S. A New Approach of Moving Average Method in Time Series Analysis. Proceedings of the 2013 IEEE International Conference on New Media (CoNMedia). Tangerang. 2013: 1-4.
[18] Hansun S. A Novel Research of New Moving Average Method in Time Series Analysis. International Journal of New Media Technology. 2014; 1(1): 22-26.
[19] NIST/SEMATECH e-Handbook of Statistical Methods. Double Exponential Smoothing. 2013. http://www.itl.nist.gov/div898/handbook/pmc/section4/pmc433.htm
[20] Incrediblecharts. Weighted Moving Average. 2015. https://www.incrediblecharts.com/indicators/weighted_moving_average.php.
[21] Nazim A, Afthanorhan A. A Comparison Between Single Exponential Smoothing (SES), Double Exponential Smoothing (DES), Holt’s (Brown) and Adaptive Response Rate Exponential Smoothing (ARRES) Techniques in Forecasting Malaysia Population. Global Journal of Mathematics Analysis.
2014; 2(4): 276-280.
[22] Insight Central. Forecast Friday Topic: Double Exponential Smoothing. 2015. https://analysights.wordpress.com/2010/05/20/forecast-friday-topic-double-exponential-smoothing/. [23] Nau R. Moving Average and Exponential Smoothing Models. 2015.
http://people.duke.edu/~rnau/411avg.htm#HoltLES
[24] Lawrence KD, Klimberg RK, Lawrence SM. Fundamentals of Forecasting using Excel. New York: Industrial Press, Inc. 2009.
[25] Yahoo! Finance. 2015 .