Negative impact of imlammation and insulin resistance on the biogenesis
of HDL-c in Indonesian men with metabolic syndrome
Ida P. Sormin,1,2 Widjaja Lukito,3 Andi Wijaya,1,2 Suryani As’ad1
1 Doctoral Programme, Faculty of Medicine, University of Hassanuddin, Makassar, Indonesia 2 Prodia Clinical Laboratory, Jakarta, Indonesia
3 SEAMEO-TROPMED Regional Center for Community Nutrition, Faculty of Medicine, University of Indonesia, Jakarta, Indonesia
Abstrak
Tujuan Mempelajari keterkaitan antara inlamasi dan resistensi insulin dengan gangguan biogenesis HDL yang menyebabkan rendahnya konsentrasi HDL.
Metode Penelitian ini menggunakan desain potong lintang dengan jumlah subyek 163 pria dewasa berusia 25-60 tahun dengan sindroma metabolik (kriteria IDF, 2005), tanpa gangguan fungsi hati dan ginjal. Penelitian ini dilakukan di Jakarta pada tahun 2007-2009. Indikator-indikator yang diukur adalah apolipoprotein A-1 (apoA-1), prebeta-1 HDL, cholesteryl ester transfer protein (CETP), kolesterol HD L, berat badan, tinggi badan, lingkar perut (LP), tekanan darah sistolik (TDS), tekanan darah diastolik (TDD), glukosa darah puasa (GDP), dan trigliserida serum. Rasio apoA-1/HDL-c diambil sebagai indikator maturasi HDL, sedangkan rasio CETP/HDL-c dan CETP/TG menunjukkan katabolisme HDL. high
sensitivity-CRP (hsCRP), HOMA-IR digunakan sebagai indikator inlamasi dan resistensi insulin. Data dianalisis dengan
menggunakan analisis univariat, bivariat, dan multivariat.
Hasil Hasil penelitian menunjukkan bahwa hsCRP berkorelasi positif dengan CETP (rs= 0,200, p= 0,042), dan rasio CETP/ HDL-c (rs=0,188, p=0,013); HOMA-IR berkorelasi positif dengan rasio apoA-1/HDL-c (rs=0,190, p=0,016) dan berkorelasi negatif dengan rasio CETP/TG (rs= -0,162, p=0,04). Hasil analisis general linear model (GLM) menunjukkan hsCRP memiliki kontribusi terbesar terhadap rasio CETP/HDL-c, apoA-1, dan CETP (berturut-turut p= 0,009; 0,016; 0,054).
Kesimpulan Penelitian ini menyimpulkan adanya hubungan antara inlamasi dan resistensi insulin dengan gangguan
biogenesis HDL pada pria dengan SM. Inlamasi berkaitan dengan peningkatan katabolisme kolesterol HDL, sedangkan
resistensi insulin berkaitan dengan penurunan maturasi dan peningkatan katabolisme kolesterol HDL, yang akhirnya
berkontribusi terhadap rendahnya konsentrasi kolesterol HDL. Inlamasi memiliki kontribusi yang lebih bermakna terhadap
faktor biogenesis HDL daripada resistensi insulin. (Med J Indones 2010; 19:36-45)
Abstract
Aim To ind out the relationship between inlammation and insulin resistance with impaired HDL biogenesis that cause
low HDL-c concentration
Methods Using a cross-sectional design, this study involved 163 adult men, aged 25-60 years old with metabolic
syndrome (IDF criteria, 2005), without liver and kidney dysfunction. This study was undertaken in Jakarta in the year 2007-2009. Measured indicators were serum apolipoprotein A-1 (apoA-1), prebeta-1 HDL, cholesteryl ester transfer protein (CETP), HDL cholesterol (HDL-c), body weight, height, waist circumference (WC), systolic blood pressure (SBP), diastolic blood pressure (DBP), fasting blood glucose (FBG), and triglyceride. The apoA-1/HDL-c ratios were taken as indicator of HDL maturation, whereas CETP/HDL-c and CETP/TG ratios were indicated HDL catabolism. high-sensitivity CRP (hsCRP) and HOMA-IR were taken as indicator of inlammation and insulin resistance, respectively. Data were analyzed by using univariate, bivariate, and multivariate analysis.
Results Positive correlations were found between hsCRP and CETP (rs= 0.200, p= 0.042), and CETP/HDL-c ratios
(rs= 0.188, p= 0.013). HOMA-IR positively correlated with apoA-1/HDL-c ratios (rs= 0.190, p= 0.016) and negatively correlated with the CETP/TG ratios (rs= -0.162, p= 0.04). Results of general linear model analysis showed that serum hsCRP concentration had the highest contribution to CETP/HDL-c ratios, apoA-1, dan CETP (p= 0.009; 0.016; 0.054, respectively).
Conclusions Inlammation and insulin resistance related to dysfunction of HDL biogenesis in men with metabolic
syndrome. The inlammation correlated with increased HDL catabolism, whereas the insulin resistance correlated with decreased HDL maturation and increased HDL catabolism. These may lead to low HDL-c concentration. Inlammation had higher contribution to HDL biogenesis factors than insulin resistance. (Med J Indones 2010; 19:36-45)
Key words:hsCRP, HOMA-IR, apoA-1, prebeta-1 HDL, CETP, HDL-c and metabolic syndrome
Metabolic syndrome (MetS) is known to be a tandem trigger of a global pandemic of type-2 diabetes mellitus (DM) and cardiovascular disease. MetS incidence is globally increasing rapidly. Based on the epidemiological data, the prevalence of MetS worldwide was 20-25%. Subjects with MetS have 2-3 times more likely to have a heart attack or stroke than their normal counterparts. At the same time, the prevalence of MetS in Indonesia continues to escalate along with changes of lifestyle, food habits and practices. Data from the Indonesian National Household Survey in 2004 showed that the prevalence of adult people with body mass index (BMI) > 25 kg/m2 was about 19%.1
In MetS patients, low concentrations high-density lipoprotein cholesterol (HDL-c) are often detected, and this condition often leads to coronary heart disease (CHD). Many studies have demonstrated that an increase of HDL-c concentration by 1 mg/dL could prevent the CHD events about 2% in men and 3% in women.2 In their review, Fredenrich and Bayer noted
that the relative risk of CHD was 6 times higher in patients with HDL-c below 35 mg/dL.3
In MetS, several pathological conditions occur like inlammation and insulin resistance, which in turn, contribute to the risk of atherosclerosis. Inlammation and insulin resistance were suggested linking MetS and vascular diseases.4-6
The low concentration of HDL-c and increased concentrations of CRP were often found in patients with MetS, which is often coincides with hypertriglyceridemia, hyperglycemia, and hypertension, and contribute to the risk of atherosclerosis.6 Insulin resistance
often occurs with low HDL-c and high triglycerides concentrations.7
HDL-c has important roles in the process of reverse cholesterol transport (RCT), which could increase eflux of excessive cholesterol from peripheral tissues, to be returned to the liver for excretion through the bile. The processes of HDL biogenesis include HDL maturation and catabolism, which involve many factors, namely apo A-I, prebeta-1 HDL, and cholesteryl ester transfer protein (CETP). Disturbance of HDL biogenesis factors leading to low HDL-c concentration.8
Previous studies elaborated the relationships between inlammation and insulin resistance with low HDL-c concentrations. However, the mechanistic linkage of this phenomenon with factors involved in HDL biogenesis was not yet clearly well described, thus
this study aims to ind out the relationship between inlammation and insulin resistance with impaired HDL biogenesis that cause low HDL-c concentration. Understanding the relationship between inlammation and insulin resistance with factors involved in HDL biogenesis in individuals with MetS was of interest to be further explored, and this has constituted our main drive to undertake this study, aiming at increasing the understanding in developing strategies to increase HDL-c concentrations. protocol were approved by the Health Research Ethics Committee of the Faculty of Medicine, University of Hasanuddin, Makassar, Indonesia.
Subjects
One hundred and sixty three (163) apparently adult men with MetS, aged 25-60, were recruited in this study. Subjects were recruited from the medical checkup individuals visiting the Prodia Clinical Laboratory in Jakarta, employees of Prodia Clinical Laboratory in Jakarta and their relatives, who were interested to participate in this research and met the entry criteria. Sample size was calculated by estimating the correlation coeficient between independent variable with HDL-c concentration.9 Previous studies undertaken by Tang et
al found that the correlation between serum hsCRP and
Subjects excluded from the study were patients who had liver and/or kidney dysfunction (as justiied by serum aspartate amino transferase (AST) > 66 mg/dL, serum alanine amino transferase (ALT) > 100 mg/dL, and/or serum creatinine > 1.6 mg/dL),12,13 patients who
had been treated with medications for diabetes mellitus and hypertension, patients who had been treated with anti-inlammation and lipid-lowering drugs in the last 3 weeks. Data collected were height, weight, waist circumference, blood pressure, smoking habit, exercise, alcohol consumption, and medications. All subjects received both written and oral information regarding the study and gave signed the informed consent prior to the commencement of the investigation. The selection of adult men in this study was considered to minimize the gender-related confounders.
Anthropometric measurement
Anthropometric indicators were measured twice and mean values were used in the analyses. Body weight (BW) was measured in kilograms to the nearest 0.1 kg, with light clothes on, using a beam scale Tanita (Tanita, Japan). Height (Ht) was measured in centimeters to the nearest 0.1 cm, in standing position with socks and shoes removed, using a microtoise (stature meter). Waist circumference was measured in centimeters to the nearest 0.1 cm, using a lexible non-elastic tape made by Roche (Roche, Switzerland). Waist circumference was measured at the midway region between the lowest rib margin and the iliac crest, in standing position with abdomen relaxed, feet together and weight equally divided over both legs. Body mass index was calculated by dividing body weight in kg by height in squared meter.
Blood pressure measurement
Sitting blood pressure was measured using a sphygmomanometer during the course of the study. Subjects were seated for at least 5 min before the actual measurement was taken. The irst Korotkoff phase represented systolic blood pressure value and the ifth Korotkoff phase (when sound just disappears) was taken as the diastolic blood pressure. Two measurements were taken with a 5 min interval, and the average value was used.
Biochemical parameters
Blood samples were collected in the morning from an ante-cubital vein into vacutainers after a 12-hour overnight fast for the measurement of serum HDL-c,
triglycerides, glucose, AST, ALT, total bilirubin, direct bilirubin, creatinine, apoA-1, prebeta-1 HDL, CETP,
hsCRP, and insulin concentrations. Insulin resistance
(HOMA-IR) was calculated with the formula: (fasting blood glucose concentration in mmol/L x concentration of insulin in mU/L) / 22.5. Fasting blood glucose concentration in mmol/L. Serum were separated from the whole blood after centrifugation, and immediately kept at a temperature in accordance with the requirements of each parameter until assays.
Blood specimens for prebeta-1 HDL analysis were collected in EDTA vacutainers. Blood specimens were immediately centrifuged to obtain plasma specimens. The plasma specimens were then diluted with the stabilization buffer within 6 hours after collection. During the course of this process, the specimens were kept in ice. The diluted specimens were stored at – 70oC
until assays.
Serum AST activity was determined using the International Federation of Clinical Chemistry (IFCC) method and reagent AST (AST/GOT) (Roche Diagnostics, GmbH, Mannheim, Germany). ALT activity was determined using the IFCC method and reagent ALT (ALAT/GPT) (Roche Diagnostics, GmbH, Mannheim, Germany. Creatinine concentrations were determined using the Jaffe method and reagent CREA (Roche Diagnostics, GmbH, Mannheim, Germany). Glucose concentrations were determined using the heksokinase method and reagent GLU (Roche Diagnostics, GmbH, Mannheim, Germany). Triglycerides concentrations were determined using the glycerol phosphate oxidase-peroxidase anti-peroxidase (GPO-PAP) method and reagent produced by Roche Diagnostics (GmbH, Mannheim, Germany). HDL-c concentrations were determined using the homogeneous enzymatic method and reagent Cholestest N HDL (SEKISUI Medical Co Ltd, Tokyo, Japan) Serum apoA-1 concentrations were determined using the commercially available immuno-turbidimetry method (ApoA-1 Auto-N “DAIICHI”®, SEKISUI Medical Co
Insulin concentrations were determined using a chemiluminescence immunoassay method (IMMULITE 2000 L2KIN 252, Diagnostic Products Corporation (DPC®), Siemens Medical Solutions Diagnostics, Los
Angeles, USA).
The apoA-1/HDL-c ratios was calculated to indicated the HDL maturation, whereas the CETP/HDL and CETP/TG ratios were calculated to indicated the HDL catabolism. All assays were performed according to manufacturers’ instructions. For each run of biochemical laboratory test, controls or standards were included in the assays. Results were within acceptable ranges.
Data analysis
Statistical analyses were performed using the SPSS for Windows version 13.0 software (SPSS Inc., Chicago, IL, USA). Distributions of continuous variables were assessed for normality using the Kolmogorov-Smirnov. Univariate analysis was performed to calculate mean and standard deviations. T-test was applied to compare means of variables between subjects with HDL-c concentration > 40 mg/dL dan HDL-c concentration < 40 mg/dL. We performed bivariate and partial correlation analyses to determine correlations between
independent variables (hsCRP, insulin, apoA-1/HDL-c,
CETP/HDL-c and CETP/TG ratios ) with dependent variables (apoA-1, prebeta-1 HDL, and CETP). Results were narrated and explained by tables and graphics. For statistical test, we used 5% to deine the level of signiicance. A general linear model analysis was performed to examine contributions of independent variables (hsCRP and HOMA-IR) to variations of
dependent variables (biogenesis factors of HDL-c)
RESULTS
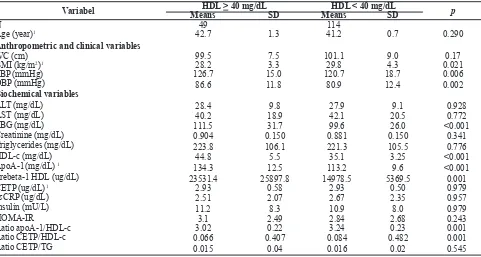
Table 1 describes basic clinical and biochemical characteristics of the subjects, by HDL-c category (between subjects with HDL-c concentration > 40 mg/ dL and HDL-c concentration < 40 mg/dL). No subjects were identiied with liver and kidney diseases. Our data revealed signiicant differences in body mass index (BMI), SBP, DBP, FBG, apoA-1, prebeta-1 HDL, apoA-1/HDL-c ratios, CETP/HDL-c ratios. Subjects with HDL-c concentrations < 40 mg/dL had higher BMI, apoA-1/HDL-c ratios, and CETP/HDL-c ratios than subjects with HDL-c > 40 mg/dL concentrations, whereas subjects with HDL-c concentrations < 40 mg/ dL had lower SBP, DBP, FBG, apoA-1, and prebeta-1 HDL than subjects with HDL-c > 40 mg/dL.
Variabel HDL > 40 mg/dL HDL < 40 mg/dL
p
Means SD Means SD
N 49 114
Age (year)1 42.7 1.3 41.2 0.7 0.290
Anthropometric and clinical variables
WC (cm) 99.5 7.5 101.1 9.0 0.17
BMI (kg/m2)1 28.2 3.3 29.8 4.3 0.021
SBP (mmHg) 126.7 15.0 120.7 18.7 0.006
DBP (mmHg) 86.6 11.8 80.9 12.4 0.002
Biochemical variables
ALT (mg/dL) 28.4 9.8 27.9 9.1 0.928
AST (mg/dL) 40.2 18.9 42.1 20.5 0.772
FBG (mg/dL) 111.5 31.7 99.6 26.0 <0.001
Creatinine (mg/dL) 0.904 0.150 0.881 0.150 0.341
Triglycerides (mg/dL) 223.8 106.1 221.3 105.5 0.776
HDL-c (mg/dL) 44.8 5.5 35.1 3.25 <0.001
ApoA-1(mg/dL) 1
134.3 12.5 113.2 9.6 <0.001
Prebeta-1 HDL (ug/dL) 23531.4 25897.8 14978.5 5369.5 0.001
CETP(ug/dL) 1 2.93 0.58 2.93 0.50 0.979
hsCRP (ug/dL) 2.51 2.07 2.67 2.35 0.957
Insulin (mU/L) 11.2 8.3 10.9 8.0 0.979
HOMA-IR 3.1 2.49 2.84 2.68 0.243
Ratio apoA-1/HDL-c 3.02 0.22 3.24 0.23 0.001
Ratio CETP/HDL-c 0.066 0.407 0.084 0.482 0.001
Ratio CETP/TG 0.015 0.04 0.016 0.02 0.545
Table 1. Basic clinical, anthropometric and biochemical charateristics of subjects based on HDL-c concentration groups
Independent variable Dependent variabel rs p
hsCRP ApoA-1 0.048 0.540
Prebeta-1 HDL 0.062 0.452
CETP 0.200 0.042
ApoA-1/HDL-c 0.057 0.473
CETP/HDL-c 0.188 0.016
CETP/TG - 0.024 0.757
Notes: hsCRP=high sensitivity C-reactive protein, apoA-1=apolipoprotein A-1, CETP= cholesterol ester transfer protein, HDL=high density lipoprotein, TG= triglyceride, rs= Spearman correlation.
Tabel 2. Correlation between independent variable (hsCRP) with dependent variables (apoA-1, prebeta-1 HDL, CETP, ratio of apoA-1/HDL-c, CETP/HDL-c and CETP/TG)
Dependent Variable Independent Variable HDL > 40 mg/dL HDL < 40 mg/dL
rs p rs p
hsCRP ApoA-1 0.431 0.002 -0.066 0.484
Prebeta-1 HDL 0.482 0.001 -0.088 0.362
CETP 0.306 0.033 0.172 0,067
Notes: hsCRP=high sensitivity C-reactive protein, apoA-1=apolipoprotein A-1, CETP= cholesterol ester transfer protein, HDL=high density lipoprotein, TG= triglyceride, rs= Spearman correlation.
Tabel 3. Correlation between hsCRP with apoA-1, prebeta-1 HDL, and CETP of subject based on HDL-c concentration groups
Table 2 shows signiicant correlations between serum
hsCRP with CETP concentrations (rs= 0.200; p= 0.042)
and CETP/HDL-c ratios (rs= 0.188; p= 0.016), whereas
there are no signiicant correlation between serum
hsCRP with apoA-1, prebeta-1 HDL concentrations,
apoA-1/HDL-c, and CETP/TG ratios.
Tabel 3 shows signiicant correlations between serum
hsCRP with biogenesis HDL-c factors, namely apoA-1
(rs= 0.431, p= 0.002), prebeta-1 HDL (rs= 482, p= 0.001),
and CETP concentrations (rs= 0.306; p= 0.033) in subjects
with HDL-c concentration > 40 mg/dL. In this study showed positive correlation between hsCRP and CETP (rs
= 0.569, p = 0.003) in MetS subjects with WC > 110 cm
Independent variable Dependent variabel rs p
HOMA-IR ApoA-1 0.122 0.121
Prebeta-1 HDL 0.122 0.136
CETP 0.033 0.675
ApoA-1/HDL-c 0.190 0.016
CETP/HDL-c 0.082 0.385
CETP/TG - 0.162 0.04
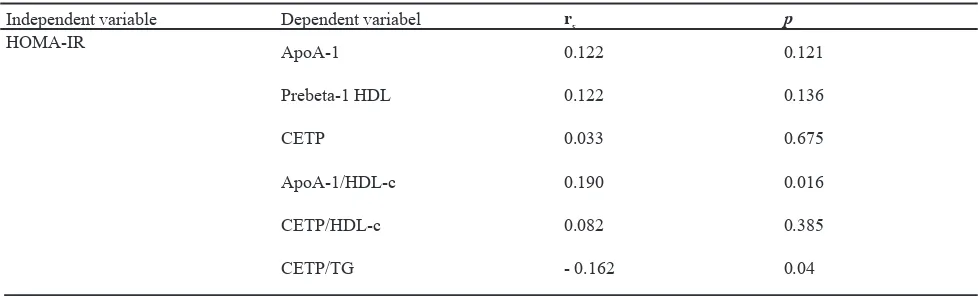
Table 4. Correlation between independent variable (HOMA-IR) with dependent variables (apoA-1, prebeta-1 HDL, CETP, apoA-1/HDL-c, CETP/HDL-c and CETP/TG ratios)
Table 4 shows signiicant correlations between serum HOMA-IR with apoA-1/HDL-c ratios (rs= 0.190; p=
0.016) and CETP/TG ratios (rs= - 0.162; p= 0.04),
whereas there are no signiicant correlation between serum HOMA-IR with apoA-1, prebeta-1 HDL, CETP concentrations, and CETP/HDL-c ratios.
Tabel 5 shows there are no signiicant correlations between HOMA-IR with biogenesis HDL-c factors on the HDL-c concentration > 40 mg / dL as well as HDL-c concentration < 40 mg/dL.
Dependent Variable Independent Variable HDL > 40 mg/dL HDL < 40 mg/dL
rs p rs p
Homa-IR ApoA-1 0.034 0.815 0.076 0.426
Prebeta1 0.043 0.786 0.158 0.101
CETP 0.123 0.399 0.013 0.888
Table 5. Correlation between HOMA-IR with apoA-1, prebeta-1 HDL, and CETP of subject based on HDL-c concentration groups
Notes: hsCRP=high sensitivity C-reactive protein, apoA-1=apolipoprotein A-1, CETP= cholesterol ester transfer protein, HDL=high density lipoprotein, rs= Spearman correlation
MetS factors Biogenesis HDL Factors Mean Square F p
hsCRP ApoA-1 27.739 5.964 0.016
Prebeta-1 HDL 5.779 1.243 0.267
CETP 17.617 3.788 0.054
ApoA-1/HDL-c 17.031 3.662 0.580
CETP/HDL-c 32.535 6.995 0.009
CETP/TG 6.096 1.311 0.254
HOMA-IR ApoA-1 7.340 1.135 0.288
Prebeta-1 HDL 5.605 0.867 0.353
CETP 0.438 0.068 0.795
ApoA-1/HDL-c 0.868 0.134 0.715
CETP/HDL-c 2.744 0.425 0.516
CETP/TG 18.257 2.824 0.095
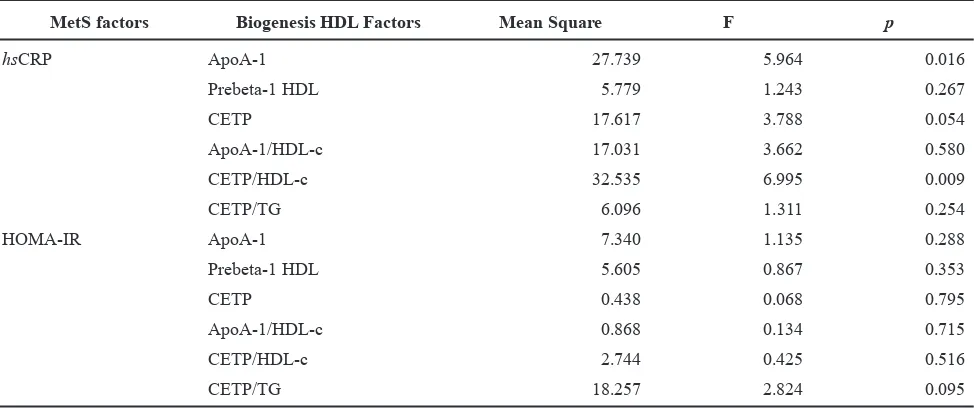
Table 6. General linear model analysis with HDL biogenesis factors as dependent variables, and hsCRP and HOMA IR as independent variables.
Notes: hsCRP=high sensitivity C-reactive protein, apoA-1= apolipoprotein A1, HDL= high density lipoprotein, CETP= cholesteryl ester transfer protein, TG= triglyceride
Results of general linear model (GLM) analysis are shown in table 6. It was showed that serum hsCRP
concentration demonstrated highest contribution to the
Figures 1 illustrates differences of mean values of apoA-1/HDL-c ratios between subjects with serum concentrations of HDL-c > 40 mg/dL and HDL-c < 40 mg/dL in total subjects. Subjects with serum concentration of HDL-c < 40 mg/dL had higher serum apoA-1/HDL-c ratios than those with serum concentration of HDL-c > 40 mg/dL.
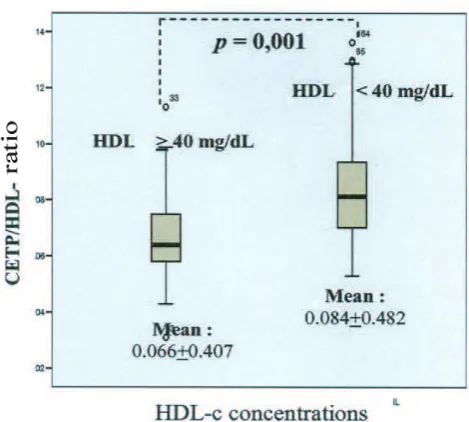
Figures 2 illustrates differences of mean values of CETP/HDL-c ratios between subjects with serum concentrations of HDL-c > 40 mg/dL and HDL-c < 40 mg/dL in total subjects. Subjects with serum concentration of HDL-c < 40 mg/dL had higher serum CETP/HDL-c ratios than those with serum concentration of HDL-c > 40 mg/dL.
Figure 1 Differences in apoA-1/HDL-c rasio between sub-jetcs with concentrations of HDL-c > 40 mg/dL and HDL < 40 mg/dL
DISCUSSION
In 163 MetS subjects in this study, 114 were subjects (70%) with concentrations of HDL-c <40 mg/dL and 49 subjects (30%) with concentrations of HDL > 40 mg/dL. This strongly supports the statement of the previous study which states that the concentration of low HDL-c is a hallmark of the MetS.14,15
This study aims to know the relationship between hsCRP
and HOMA-IR which are markers of inlammation and insulin resistance to HDL biogenesis factors that caused low HDL-c concentration in MetS.
In this study, in addition to HDL biogenesis factors, such as apoA-1, prebeta-1 HDL, and CETP, other parameters i e apoA-1/HDL-c, CETP/HDL-c, and CETP/TG ratios were also used. ApoA-1/HDL-c ratios represents HDL maturation. The lower apoA-1/HDL-c ratios describe maturation process is more effective and apoA-1/HDL-c ratios also indicated the quality of HDL-c eflux. In this study we found the average apoA-1/HDL-c ratios is higher in group with the concentrations of HDL-c < 40 mg/dL compared to the group of concentrations HDL-c > 40 mg/dL, this may explains that HDL maturation were less effective in the concentration of lower HDL.
CETP/HDL and CETP/TG ratios represent HDL catabolism. The higher the CETP/HDL ratio indicated the increased HDL catabolism, and conversely the higher the CETP/TG ratio indicated the decreased HDL catabolism. Factors that play an important role in the catabolism of HDL include CETP, which plays a role in the process of exchange of cholesterol esters from HDL with triglycerides from VLDL, IDL, and LDL. CETP activity was also inluenced by the levels of triglyceride, in high triglyceride concentrations, the exchange rate of triglycerides from TG-rich lipoproteins and cholesterol ester from HDL increased, and HDL which contains large amounts of triglycerides would stimulates the activity of hepatic lipase.16 In this
study, we found that the average CETP/HDL ratio were higher in the group of HDL-c concentrations < 40 mg/ dL compared to the group of HDL-c concentrations > 40 mg/dL. Thus HDL catabolism is increased at the lower HDL-c concentrations. The average CETP/TG ratios did not showed signiicant differences between the group of HDL-c concentration < 40 mg/dL with the groups of HDL concentrations > 40 mg/dL.
This study showed that hsCRP correlated positively
with CETP. This results supported previous study
which reported that inlammation will induced the release of cytokines pro-inlammation, which can lead to changes in metabolism and composition of HDL (apoA-1, LCAT, CETP and PLTP).6 In this study we
also found a positive correlation between hsCRP with
CETP/HDL-c ratio. This was showed that inlammation in MetS subjects will lead to increased HDL catabolism and formed small dense HDL. In their review, Chan, et al. noted that the high CETP activity observed in the MetS subject will result in unstable TG-rich HDL particles, which then will be removed from the plasma more rapidly. Concentration of CETP was correlated negatively with HDL-c concentration. Transfer of Cholesterol ester from HDL to apo B-containing lipoproteins in exchange with triglycerides mediated by CETP will increased in MetS subject.17,18
In this study hsCRP were found to have a signiicant
positive correlation in the MetS subject who have a waist circumference > 110 cm. This result supported the previous study which reported that there were a signiicant correlation between waist circumference with hsCRP and triglycerides.1918 The increased of
triglycerides levels in the MetS subject would trigger increase of transfer of cholesterol ester and triglycerides between HDL and TG-rich lipoproteins In another study also reported that the increased catabolism of apoA-1 in MetS subjects were related to the increased in waist circumference, hypertriglyceridemia, low HDL-c concentration, small particle size of HDL, and hiperinsulinemia.20
In this study, it is revealed that hsCRP were positively
correlated with apo-1, prebeta-1 HDL, and CETP, but only in the group of HDL-c concentrations > 40 mg/dL. The results of this study was different from previous studies that found a negative relationship between concentrations of apoA-1 and CRP.21 This
may explained these results was suggested at the early stages of inlammation, the concentration of apoA-1 and HDL prebeta-1 were increased as a compensation mechanism to inhibited hsCRP, thus the concentration
of HDL-c in the blood were still high, however in the further inlammation the concentrations of HDL-c were decreased in MetS, because apoA-1 in HDL was replaced by the SAA, and HDL was changed the nature of the anti-inlammatory becomes pro-inlammatory.22
In this study we also found a negative correlation tendency between hsCRP with apoA-1 and prebeta-1 HDL on the
may explained that inlammation will induce the release of pro-inlammatory cytokines, which caused changes in metabolism and composition of HDL and altered the expression of several key enzymes involved in the reverse cholesterol transport. Changes in the expression of several key enzymes involved in the RCT will caused interference in the eflux cholesterol from cells and cholesterol uptake into the liver.6 Besides, CRP may inhibits eflux cholesterol
from foam cells in human macrophages through the down regulation of intracellular cholesterol transport molecules, namely ABCA1 and ABCG1.
In the present study, no signiicant correlation were observed between insulin resistance (HOMA-IR) with apoA-1, prebeta-1 HDL, and CETP levels. These results were consistent with previous studies which reported that the concentration of apoA-1 did not differ between subjects with insulin resistance compared to control. However in this study we found that in the early stages of insulin resistance occurred signiicant changes in the metabolism of apoA-1, thus increased catabolism of apoA-1 by 50%. Fraction catabolic rate (FCR) apoA-1 were signiicantly positively correlated with waist circumference and HOMA-IR, and catabolism of apoA-1 increased compared with controls in subjects with insulin resistance. Increased catabolism of apoA-1 will lead to signiicant reduction in residence time of apoA-1 in plasma, although statistically not showed differences in apoA-1 production rate in subjects with insulin resistance compared to control. This may explained why the concentration of apoA-1 in the plasma did not differ signiicantly between obese subjects with controls. HDL-c was signiicantly negatively correlated with FCR apoA-1, but not with apoA-1 production rate. This may indicated that the catabolism of apoA-1 was a very important factor in the decline in HDL-c concentrations in subjects with insulin resistance. Insulin resistance correlated with decreased activity of lipoprotein lipase. Triglyceride-rich HDL is good for subtrat hepatic lipase, thus increased catabolism of HDL. Increased CETP activity was reported in subjects with insulin resistance and were thought an important factor that plays a role in HDL catabolism.7,23,24 In this study we also found that
average of the high concentrations of triglycerides (202.08 +105.34 mg / dL).
In this study obtained HOMA-IR correlated positively with the apoA-1/HDL-c ratios and negatively correlated with the CETP/TG ratios. This showed that the state of insulin resistance correlated with decreased HDL maturation and increased HDL catabolism that will caused the formation of small dense HDL.
In this study we also conducted a general linear model analysis to determine which path was most responsible for dysfunction of HDL biogenesis factors, lead to low concentrations of HDL-c. We found that inlammation path represented by hsCRP had higher contribution to
HDL biogenesis factors than insulin resistance.
Understanding of the mechanism linkages hsCRP and
HOMA-IR with the factors involved in the biogenesis of HDL are expected to enrich the information in developing strategies to increase HDL-c concentrations, in an attempt to reduce morbidity and mortality of vascular disease.
In conclusion, results of this study lead to the conclusion that inlammation and insulin resistance related to dysfunction of HDL biogenesis in men with metabolic syndrome. The inlammation correlated with increased HDL catabolism, whereas the insulin resistance correlated with decreased HDL maturation and increased HDL catabolism. These may lead to low HDL-c concentration. Inlammation had higher contribution to HDL biogenesis factors than insulin resistance.
Survey Kesehatan Nasional dan Survey Kesehatan Rumah 1.
Tangga (SKRT) 2004. Badan Penelitian dan Pengembangan Depkes RI, Jakarta, 2004
Kostner K. Beyond LDL-cholesterol : New treatments 2.
raising HDL-cholesterol or enhancing reverse cholesterol transport. Circulation 2002; 100 : 576-8.
Fredenrich A, Bayer P. Reverse cholesterol transport, high-3.
density lipoprotein and HDL-cholesterol: Recent data. Diabetes Metab 2003; 29: 201-5.
Barter PJ, Brewer Jr HB, Chapman MJ. Cholesteryl 4.
ester transfer protein. A novel target for raising HDL and inhibiting atherosclerosis. Atheroscler Thromb Vasc Biol 2003; 23 : 160-7.
Deen D. Metabolic Syndrome: Time for action. Am Fam 5.
Physician 2004;69: 2875-82..
Rohrer L, Hersberger M, Von EA. High density lipoprotein 6.
in the intersection of diabetes mellitus, Inlammation and Cardiovascular Disease. Curr Opin Lipidol 2004;15:269-78. Pont F, Duvillard L, Florentin E, Gambert P, Verges B. High 7.
Ashen MD, Blumenthal MD. Low HDL-cholesterol 8.
concentrations. N Engl J Med 2005; 353: 1252-60. Madiyono B, Moeslichan Mz, Sastroasmoro S, Budiman 9.
I, Purwanto H. 2002. Perkiraan besar sampel. Dalam: Dasar-dasar metodologi penelitian klinis. Sastroasmoro S. dan Ismael S (editor). Jakarta. Sagung Seto. Edisi ke-2. Hal:259-286
Tang W, Hong Y, Province MA, Rich SS, Hopkins PN, 10.
Arneti DK, et al. Familial clustering for features of the metabolic syndrome. Diabetes Care 2006;29:631-6 Alberti KG, Zimmet P, Shaw J. IDF epidemiology task 11.
force consensus group: The metabolic syndrome: a new worldwide deinition. Lancet 2005; 366: 1059–62. Friel JP. Dorland’s illustrated medical dictionary 26.th Ed. 12.
W.B. Saunders Company Philadelphia.
Lawrence GS. Interaksi asam lemak bebas, status 13.
anti oksidan total, plasminogen activator inhibitor-1, adiponektin, dan high sensitivity C-reactive protein terhadap kajian toleransi glukosa terganggu. Disertasi S3 Program Pascasarjana UNHAS. Makassar. 2004.
Lewis GF, Rader DJ. New insights into the regulation of 14.
HDL metabolism and reverse cholesterol transport. Circ Res 2005;96:1221-32.
Kontush A, Chapman J. Functionally defective high-density 15.
lipoprotein: A new therapeutic target at the crossroads of dyslipidemia, inlammation, and atherosclerosis. Pharmacol Rev 2006;58:342-74.
Parini P, Rudel LL. Is there a need for cholersteryl ester 16.
transfer protein inhibition? Atheroscler Thromb Vasc Biol 2003;23:374-5.
Chan DC, Barrett PH, Watts GF. Recent studies of 17.
lipoprotein kinetics in the metabolic syndrome and related
disorders. Curr Opin Lipidol 2006;17:28-36.
Brousseau ME, Schaefer EJ, Wolfe ML, Bloedon LT, 18.
Digenio, AG, Clark RW, et al., Effects of an inhibitor of cholesteryl ester transfer protein on HDL cholesterol. N Engl J Med 2004;350: 1505-15.
Sartika RS, Wijaya A, Lukito W. Hubungan antara 19.
hipoadiponektinemia, penurunan status antioksidan total, dan peningkatan high sensitivity C-reaktive protein dengan kejadian sindroma metabolik. Tesis. Universitas Hasanuddin. Makassar. 2006.
Ji J, Watts GF, Johnson AG, Chan DC, Ooi EM, Rye KA, 20.
Serone AP, Barrett PH. High-density lipoprotein (HDL) transport in the metabolic syndrome: Application of a new model for HDL particle kinetics. J Clin Endocrinol Metab 2007; 91: 973-9.
Santos AC, Lopes C, Guimaraes JT, Barros H. Central 21.
obesity as a major determinant of increased high-sensitivity C-reactive protein in metabolic syndrome. Int J Obes 2005; 29:1452-6.
Koulouris SN. HDL-cholesterol: Pro-inlammatory and anti-22.
infammatory effects. Hellenic J Cardiol 2004;45: 324-30. Chan DC, Barrett PH, Watts GF. Lipoprotein transport in the 23.
metabolic syndrome : Pathophysiological and interventional studies employing stable isotopy and modelling methods. Clin Sci 2004;107: 233-49.
Rashid S, Patterson BW, Lewis GF. What have we learned 24.