1
e-Proceeding of Software Engineering
Postgraduates Workshop (SEPoW)
2013
Theme: Innovative Software Engineering for Creative and
Competitive
Software Solution
19 November 2013
City Campus
Universiti Teknikal Malaysia Melaka
Organizer
Co-Organizer
Software Engineering Department,
Faculty of Information and Communication Technology (FTMK)
Sponsor
Table of Contents
Sponsor ...1
Foreword from SEPoW 2013 Patron ...4
Welcome from the SEPoW 2013 Chair ...5
Tutorial Talks ...6
SEPoW 2013 Conference Committees ...8
Requirements Engineering ...9
Aspect Refactoring Workflow to Improve Crosscutting Concern Extraction Effectiveness
at Requirement Level ... 10
Characterisation of Healthcare Domain Library to Capture Accurate Requirements of
Healthcare Software ... 17
The Use of Essential Use Cases (EUCs) to enhance the Process of Capturing Security
Requirements for Accurate Secure Software ... 21
Metaheuristic Retaining New Case in ASEAN Tele-Diagnose Framework ... 27
A Framework for Accessing Patient Health Records Through Multi Channel of Devices ... 31
A Framework for Gathering Electronic Medical Record through Telehomecare ... 35
Software Architecture ... 39
Conceptual Model for Managing Variability in Product Line Engineering ... 40
Hybrid Mobile Application Framework for Pervasive Health Record (HMAF4PHR) ... 44
Designing Hybrid Software Architecture Framework for Capturing Clinical Findings
during Doctor-Patient Consultation ... 47
Health Informatics Framework for Postnatal Care: An integration between Modern
Medicine and Traditional Malay Medicine ... 51
Enhancing Generic Pipeline Model in Preventing Code Clone during Software
Development ... 56
Developing a Maturity Model to Measure Service-oriented Enterprise Architecture
(SoEA) Adoption in an Organisation ... 61
Ontology for Evaluation of Semantic Web Services Ontology ... 66
Software Design ... 71
Mobile Commerce Customer Relationships Management Model (MCCRMM) ... 72
Software Re-engineering Risks Management Model (SRE-RMM) ... 7
ϲ
A Review on Web Design Processes: How They Incorporated in a Complex System ... 8
ϭ
Predicting Hearing Loss Symptoms from Audiometry Data Using Machine Learning
Algorithms ... 8
ϲ
The Impact of EMR User Interface Design on Doctor Satisfaction ... 9
ϰ
Migration Traditional Projects Framework to Enterprise Resource Planning System: An
Empirical Study ...
ϵϴ
Software Quality ... 10
ϯ
Software Quality Assessment Model for Global Software Development (SQAM-GSD) ... 10
ϰ
Web Usability Management Model (WEB-
UMM) From Customers’ Perspective
... 1
Ϭϵ
Classification Techniques in Blood Donors Sector
–
A Survey ... 11
ϰ
Improving Data Accessibility Using QR Code in Healthcare Domain ... 1
ϭϵ
Improving Large Database Performance Using SQL Query Rewriting in MES ... 12
ϰ
Test Case Generator for Embedded Real Time Software ... 13
ϭ
A Study on Code Peer Review Process Monitoring using Statistical Process Control ... 1
ϯϲ
Co-organizer ... 142
Sponsors ... 143
Software Quality
Software Quality Assessment Model for Global Software Development (SQAM-GSD)
Sadia Rehman and Siffat Ullah Khan
Web Usability Management Model (WEB-UMM
) From Customers’ Perspective
Muhammad Salam and Siffat Ullah Khan
Classification Techniques in Blood Donors Sector - A Survey
Nor Syuhada Che Khalid, Burhanuddin M.A., Asmala Ahmad and Ghani M.K.A
Improving Data Accessibility Using QR Code in Healthcare Domain
Fatin N. M. Leza, Nurul A. Emran and Mohd. Khanapi A. Ghani
Improving Large Database Performance Using SQL Query Rewriting in MES
Nor'azah Md. Khusairi, Nurul A. Emran and Mohd Mokhtar Mohd Yusof
Test Case Generator for Embedded Real Time Software
Nabilah Kamarul Baharin and Radziah Mohamad
A Study on Code Peer Review Process Monitoring using Statistical Process Control
Alhassan Muhammad Abubakar and Dayang N. A. Jawawi
Classification Techniques in Blood Donors Sector
–
A Survey
Nor Syuhada Che Khalid1, Burhanuddin M.A.2, Asmala Ahmad3, Ghani M.K.A4 Faculty of Information Technology and Communications
Universiti Teknikal Malaysia Melaka, Malaysia
[email protected], {burhanuddin2, asmala3, khanapi4}@utem.edu.my
Abstract—This paper focuses on the classification and the recent trends associated with it. It presents a survey of the classification system and clarifies how classification and data mining are related both to each other. Classification is arranging the blood donor dataset into the predefined group and helpful to predict group membership for data instances. This enables users to search target donors become easier because the blood stocks always required replacing expired stocks after a certain period and useful in emergency demands such as surgery and blood transfusion. This paper has also sought to identify the research area in classification to fulfill gaps where further work can be carried on.
Keywords: Classification, Data Mining, Blood Donors Prediction
I. INTRODUCTION
Safe blood donor recruitment is a challenging task. It is necessary for the community to realize that blood donation is their responsibility. Blood bank, hospital or government cannot sustain health care without sufficient blood from such donor and blood donor organizations play a more crucial role in this endeavor[8]. The problem concerns the identification of blood donors patterns on the basis of blood donor attribute measurements[7]. The blood donors data collection always in large and unexpected amount. Classification is important to predict a certain outcome based on a given input, that is blood donors dataset. The classification algorithm will discover the relationships between the blood donors attributes that would make it possible to predict the outcome[13]. Data mining is a step in knowledge discovery in databases (KDD) which is used to extract interesting patterns from the blood donor data that are easy to perceive, interpret, and manipulate. Several major kinds of classification methods such as decision tree and artificial neural network (ANN) are surveyed in this paper.
II. CLASSIFICATIONANDDATAMINING
A. Classification
Classification is important to predict a certain outcome based on a given input, which is the blood donors dataset. Classification is the process of finding a model or function that identifies and distinguishes blood donor data classes or concepts, for the purpose of being able to use the model to predict the class of objects whose class label is unknown. The derived model is based on the analysis of a set of
training data when data object whose class label is known[7].
The derived model which is suitable for blood donors dataset could be demonstrated in several forms, such as classification (IF-THEN) rules, decision trees, mathematical formulas, or neural networks. A decision tree is a flow-chart-like tree structure, where each node denotes a test on an attribute value, each branch represents an outcome of the test, and tree leaves represent classes or class distributions. Decision trees could only be converted to classification rules. A neural network, when used for classification, is typically a collection of neuron-like processing units with weighted connections between the units. There are many other methods for building classification models for the blood donors dataset, such as naïve Bayesian classification, support vector machines, and k-nearest neighbor classification. Prediction models are continuous-valued functions, while classification predicts categorical (discrete, unordered) labels. It is specifically used to predict missing or unavailable numerical data values rather than class labels. Regression analysis is a statistical methodology that is most often used for numeric prediction, although other methods exist as well. Prediction also comprises the identification of distribution trends based on the available data.
Classification and prediction may need to be preceded by relevance analysis of blood donor data, which attempts to identify attributes that do not contribute to the classification or prediction process. These attributes can then be omitted[4].
B. Data Mining
Data mining is defined as the process of discovering patterns in the blood donor data. The process must be automatic or semiautomatic. The patterns discovered must be significant in that they lead to some advantage, usually an economic or strategic advantage for blood donor analysis. The data includes blood donor data regularly present in significant quantities. Useful patterns allow nontrivial predictions on new data. There are two extremes for the expression of a pattern: as a black box whose innards are effectively incomprehensible and as a transparent box whose construction reveals the structure of the pattern. Both should make good predictions. The difference is whether or not the patterns that are mined are represented in terms of a structure that can be examined, reasoned about, and used to inform future decisions. Such patterns are called structural because they capture the decision structure in an explicit
manner. In other words, they assist to explain something about the data analyzed[4].
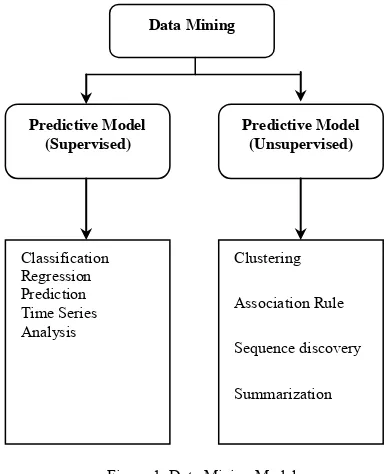
[image:7.612.73.267.128.365.2]The data mining models and tasks are shown in Fig. 1 given below:
Figure 1: Data Mining Models
The predictive model makes prediction about the unknown data value using the known values. The descriptive model identifies the patterns or relationships in data and investigates the properties of the data analyzes.
There are different types of data mining tasks depending on the use of data mining results. These data mining tasks are categorized as follows:
1) Exploratory Data Analysis: It is merely exploring the data without any clear ideas of any searched target. These techniques are interactive and visual.
2) Descriptive Modeling: It describes all the data, it includes models for overall probability distribution of the data, partitioning of the p-dimensional space into groups and models describing the relationships between the variables.
3) Predictive Modeling: This model permits the value of one variable to be predicted from the known values of other variables.
4) Discovering Patterns and Rules: It is concerns with pattern detection, the aim is spotting fraudulent behavior by detecting regions of the space defining the different types of transactions where the data point significantly different from the rest.
5) Retrieval by Content: It is finding pattern similar to the pattern of interest in the dataset. This task is most commonly used for text and image datasets[1].
III. CLASSIFICATIONTECHNIQUES IMPLEMENTATIONSURVEY
In this section, a lot of research work has been recorded from past few years. They are presented here in chronological order.
First, the surveyed blood donor data are utilized for machine learning techniques of Artificial Intelligence to classify the blood donor group into donors and non-donors. Moreover, the accuracy testing of the surveyed information is performed using the artificial neural network (ANN) and decision tree techniques in order to predict from a series of individual blood behavior data whether or not each individual is a donor. The results indicate that the accuracy, precision, and recall values of ANN technique are higher than those of the decision tree technique. The problems noted in this research are inefficient to collect blood based
on patients’ usage and difficulty to stabilize blood demand
and supply consequently[2][9]. This research has done comparative of neural network and decision tree evaluation based on model accuracies. However, these comparisons are not indicating how model structures will affect the model accuracies results such as how input nodes and the number of hidden layers in an MLP neural network is better than Tree-Building and Tree-Pruning in CART and C4.5 decision tree process making. As a conclusion, this research did not show how advantageous of a neural network classification model than a decision tree by mentioned their model structures and their own advantage and disadvantage factors.
Then, an attempt has been made to classify and predict the number of blood donors according to their age and blood group. J48 algorithm and WEKA tool have been used for the complete research work. The problems found in this attempt are to evaluate J48 decision tree classification through the blood donors training dataset and verify the result using a test set of data[3]. However, this effort has not analyzed through process of WEKA’s usage and visual result by how J48 structure is produces the dataset training and evaluations.
characteristics (ROC curve), specificity and area under the ROC curve.
A specific case of real world Blood Transfusion dataset to demonstrate how each KDD step can be completed interactively to produce useful and required knowledge in less time/efforts with the synergy of human and computer system. The classification technique used is the decision tree[10]. However, this case has not explained how decision tree classification in TANAGRA software is making the prediction result.
Subsequently, the scoring algorithm implemented which is developed using CART classification for the dashboard also helps with the optimized deployment of budget resources and budget allocation determination for blood donation campaigns. The goal of this classification model is to provide the capability to determine voluntary blood donor based on blood donation patterns[11]. However, this implementation has not explained how RVD structure is implemented together with the CART classification structure.
A comparison of donation models using the classification algorithms for data mining that are the extended RVD model and DB2K7 which enable representation as decision trees. The analysis provides insight into the development of donor classification which enables blood banks to determine the kinds of donor profiles and manage blood donation related activities like recruitment and campaigns for blood donations. The goal of this classification model is to provide the capability to determine voluntary blood donor based on blood donation patterns[12]. However, the comparison of classification accuracies has not shown the difference in model structure of RVD, DB2K7 and extended RVD which have different capability to each classification.
An analysis had been carried out using a standard blood
group donor’s dataset and using the J48 decision tree
algorithm implemented in WEKA. The research work is used to classify the blood donors based on the sex, blood group, weight and age[7]. However, the tree diagram that has produced J48 decision tree model through WEKA should be explained clearly to define the result produced.
A fuzzy sequential pattern mining algorithm is used to mine fuzzy sequential patterns from the Blood Transfusion Service Center dataset. It helps to predict future patterns of blood donating behavior. The problem of this mining algorithm before is the sequential pattern mining algorithms do not allow the processing of numerical data and require converting this data into binary representation[15]. In the end, the proposed model is shown the better improvement by algorithm structure explanation.
An identification of the blood donation behavior is done by applying the classification algorithms for data mining. The analysis had been implemented using a standard blood transfusion dataset and using the CART decision tree algorithm implemented in WEKA[8]. However, the comparison of CART and RVD is incomplete because no detailed analysis of how the classification accuracy that has improved by a leaf node number of tree complexity CART algorithm rather than RVD algorithm.
A particle swarm based hybrid system for remedying the class imbalance problem in medical and biological data mining. This hybrid system combines the particle swarm optimization (PSO) algorithm with multiple classifiers and evaluation metrics for evaluation fusion. Samples from the majority class are ranked using multiple objectives according to their merit in compensating the class imbalance, and then merged with the minority class to form a balanced dataset[14]. However, this system analysis has not specified about the conditions or criteria of imbalanced dataset happened such as random undersampling, random oversampling and clustering based sampling and their examples.
Finally, two artificial neural network models (multi-layer perceptron neural network [MLP] and probabilistic neural network [PNN]) are compared to a standard statistical method (linear discriminant analysis [LDA]). The variable sets considered are sex, age, educational level, altruistic values, the perceived risks of blood donation, blood donation knowledge, attitudes toward blood donation, and intention to donate blood. This comparison demonstrates how it is possible to identify various dimensions of blood donation behavior by uncovering patterns in the dataset, and also indicates the classification abilities of two neural network techniques[6]. However, the comparison of MLP and PNN with LDA only give results on classification accuracy without classification abilities, such as how their strength or weakness makes differences in accuracies that have produced.
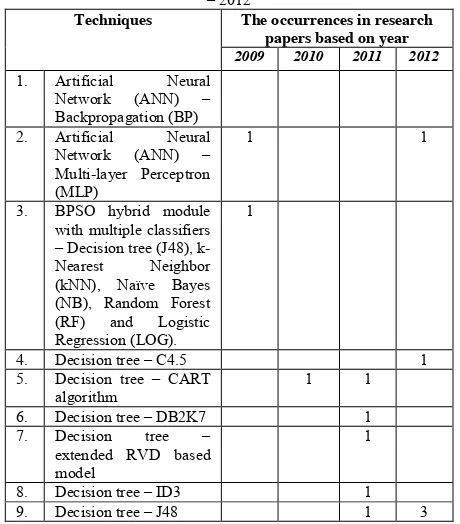
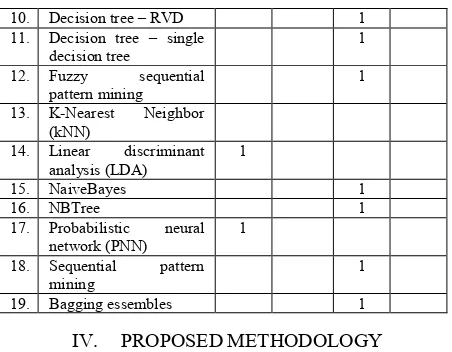
[image:8.612.322.552.452.714.2]As a conclusion, the occurrences of classification techniques in blood donor data research papers from 2009 to 2012 are in Table I as follow.
TABLE I. THE OCCURRENCES OF CLASSIFICATION
TECHNIQUES IN BLOOD DONORS DATA RESEARCH PAPERS 2009 – 2012
Techniques The occurrences in research papers based on year
2009 2010 2011 2012
1. Artificial Neural
Network (ANN) –
Backpropagation (BP)
2. Artificial Neural
Network (ANN) –
Multi-layer Perceptron (MLP)
1 1
3. BPSO hybrid module
with multiple classifiers –Decision tree (J48), k-Nearest Neighbor (kNN), Naïve Bayes (NB), Random Forest (RF) and Logistic Regression (LOG).
1
4. Decision tree – C4.5 1
5. Decision tree – CART algorithm
1 1
6. Decision tree – DB2K7 1
7. Decision tree –
extended RVD based model
1
8. Decision tree – ID3 1
9. Decision tree – J48 1 3
10. Decision tree – RVD 1 11. Decision tree – single
decision tree
1
12. Fuzzy sequential
pattern mining
1
13. K-Nearest Neighbor
(kNN)
14. Linear discriminant analysis (LDA)
1
15. NaiveBayes 1
16. NBTree 1
17. Probabilistic neural network (PNN)
1
18. Sequential pattern
mining
1
19. Bagging essembles 1
IV. PROPOSEDMETHODOLOGY
In the proposed methodology, based on surveys and some analysis, a blood donors classification implementation supposedly has the following objectives:
To propose better blood donor classification module for data mining purpose.
To show clear analysis of strength and weakness classification technique in blood donors that will produce the classification accuracy.
To increase and attract blood donor’s rate and their attitude.
To assist blood bank professionals in making policy on the acquisition of blood donors and new blood banks.
There are several major classification had been acquired and used in data mining research projects that recently including neural network, decision tree, statistics, distance and rule based. These methods in classification need brief mention to have a better understanding and potentially used for future research. Some of these methods have already occurred in research work with a few of classification model limitations that could suggest as further research gaps.
[image:9.612.64.290.68.244.2]The estimation and prediction may be viewed as types of classification. The problems usually are evaluating the training dataset and then to apply them into the future model. The following Table II shows different classification algorithms [1].
TABLE II. CLASSIFICATION ALGORITHMS
Type Name of Algorithm
Statistical Regression Bayesian Distance Simple distance
K-nearest neighbors Decision Tree ID3 C4.5 CART SPRINT Neural Network Propagation
NN Supervised learning Radial base function network Rule
based
Genetic rules from DT Genetic rules from NN Genetic rules without DT and NN
Details of classification algorithm are given as follow:
A. Statistical
Statistical approaches are usually characterized by having an explicit underlying probability model, which provides a probability of being in each class rather than just a classification. Additionally, it is commonly taken for granted that the techniques will use by statisticians, and hence some human intervention is assumed with respect to variable selection and transformation, and overall structuring of the problem[16].
B. Distance
Traditionally, distance-based classifiers are instance based: they classify a test instance by the computation of a similarity measure between that instance and the instances in the training-set and assigning it the same class of the most similar k instances. This method is simple but has some disadvantages, among which there is the greater sensitivity to the local presence of noise in the training-set, the need to compute many similarity measures and the difficulty to decide the value of k[17].
C. Decision Tree
A decision tree is a flowchart-like tree structure, where each internal node (non leaf node) denotes a test on an attribute, each branch represents an outcome of the test, and each leaf node (or terminal node) possesses a class label or class distribution. The highest node in a tree is the root node. Decision trees could easily change to classification rules. The structure of decision tree classifiers does not require any domain knowledge or parameter setting, and therefore is appropriate for exploratory knowledge discovery. Decision trees can handle high dimensional data. Their representation of acquired knowledge in tree form is intuitive and generally comfortable. The learning and classification steps of decision tree induction are simple and quick. Generally, decision tree classifiers have good accuracy. However, successful use may depend on the data at hand. Decision tree induction algorithms have been used for classification in many application domains. Decision trees are the basis of some commercial rule induction systems. However, there are concepts that are hard to learn because decision trees do not express them clearly such as XOR, parity or multiplexer problems. Then, the decision tree becomes too large. Another issue is data that include categorical variables with different number of levels make an information gain in decision trees is biased in favor of those attributes with more levels [9].
D. Neural Network
The neural network is applied in data mining for prediction or classification information in the domain of ideas or feelings and behaviors of consumers effectively. An artificial neural network, often simply called a neural
network, is a mathematical model inspired by biological neural networks. A neural network consists of an interconnected group of artificial neurons, and it processes information using a connectionist approach to computation. The neural network is the model learning patterns of the data to solve the problem of classification and clustering, which are effective to analyze the marketing databases. However, issues occurred in a neural network are overtraining and local optimum in backpropagation[9].
E. Rule based
Rules are a good way of representing information or bits of knowledge. A rule-based classifier uses a set of IF-THEN rules for classification. The rule ordering scheme prioritizes the rules beforehand. The ordering may be class based or rule-based. The classes are sorted in order of decreasing
“importance,” such as by decreasing order of prevalence, with class-based ordering. All of the rules for the most prevalent or most frequent class come first; the rules for the next prevalent class come next, and so on. Alternatively, they may be sorted based on the misclassification cost per class. The rules are not ordered because they all predict the same class within each class. Therefore no class conflict occurs. The rules are organized into one long priority list, according to some measure of rule quality such as accuracy, coverage, or size (number of attribute tests in the rule antecedent), or based on advice from domain experts with rule-based ordering. When rule ordering is used, the rule set is known as a decision list. With rule ordering, the triggering rule that appears earliest in the list has highest priority, and then it gets to fire its class prediction. Any other rule that satisfies the similar class is ignored. Most rule-based classification systems use a class-based rule-ordering strategy. Remember that in the first strategy, overall the rules are unordered. They can be used in any order when classifying a tuple. A disjunction (logical OR) is implied between each of the rules. Each rule represents a stand-alone nugget or piece of knowledge[9].
V. CONCLUSION
This paper presents a survey of classification and its techniques which have been used to extract interesting patterns and to develop significant relationships among variables stored in a huge dataset, such as blood donors data. Classification is needed in many fields to extract the useful information from the large quantity of data. Large quantity of data is maintained in every field to keep different records. Consequently, different ways have been discovered to analyze the data automatically, to summarize it, to discover and characterize trends in it and to flag anomalies automatically. The various classification techniques are introduced by the different researchers. These techniques are used to do (IF-THEN) rules, decision trees, mathematical formulas, or neural networks, to find interesting patterns. In future work, the classification techniques will be implemented on the blood donors dataset
for predicting the blood donor’s behavior and attitude,
which have been collected from the blood bank center and the limitations of classification methods implemented could be improved as research gaps.
ACKNOWLEDGMENT
The authors are grateful to Faculty of Information and Communications Technology and Universiti Teknikal Malaysia Melaka for providing facilities and financial support for this research project.
REFERENCES
[1] A. Bhardwaj, A. Sharma, and V. K. Shrivastava, “Data Mining Techniques and Their Implementation in Blood Bank Sector – A Review,” International Journal of Engineering Research and Applications (IJERA), vol. 2, no. August, pp. 1303–1309, 2012. [2] W. Boonyanusith and P. Jittamai, “Blood Donor Classification Using
Neural Network and Decision Tree Techniques,” in Proceedings of the World Congress on Engineering and Computer Science, 2012. [3] T. Franks, “Predicting the Number of Blood Donors through their
Age and Blood Group by using Data Mining Tool,” American Journal of Medicine and Health, vol. 2, no. 2, pp. 8–14, 2012. [4] J. Han and M. Kamber, “Data Mining: Concepts and Techniques”,
pp. 1–743, 2006.
[5] W. Lee, “An Intelligent System for Improving Performance of Blood Donation,” Journal of Quality, vol. 18, no. 2, pp. 173–185, 2011. [6] M. M. Mostafa, “Profiling blood donors in Egypt: A neural network
analysis,” Expert Systems with Applications, vol. 36, no. 3, pp. 5031– 5038, Apr. 2009.
[7] P. Ramachandran, N. Girija, and T. Bhuvaneswari, “Classifying Blood Donors Using Data Mining Techniques,” IJCSET, vol. 1, no. 1, pp. 10–13, 2011.
[8] T. Santhanam and S. Sundaram, “Application of CART Algorithm in Blood Donors Classification,” Journal of Computer Science 6, vol. 6, no. 5, pp. 548–552, 2010.
[9] A. Sharma and P. C. Gupta, “Predicting the Number of Blood Donors through their Age and Blood Group by using Data Mining Tool,”
International Journal of Communication and Computer Technologies, vol. 01, no. 6, pp. 6–10, 2012.
[10] V. Singh and S. Nagpal, “Interactive Knowledge Discovery in Blood Transfusion Data Set,” VSRD International Journal of Computer Science & Information Technology, vol. 1, no. 8, pp. 541–547, 2011. [11] S. Sundaram and T. Santhanam, “Real-Time Blood Donor
Management Using Dashboards Based on Data Mining Models,”
International Journal of Computer Science Issues, vol. 8, no. 5, pp. 159–163, 2011.
[12] S. Sundaram and T. Santhanam, “A Comparison of Blood Donor Classification,” Journal of Theoretical and Applied Information Technology, vol. 30, no. 2, pp. 2–5, 2011.
[13] F. Voznika and L. Viana, “Data Mining Classification.” pp. 1–6. [14] P. Yang, L. Xu, B. B. Zhou, Z. Zhang, and A. Y. Zomaya, “A particle
swarm based hybrid system for imbalanced medical data sampling.,” in BMC genomics, pp. 1–14, 2009.
[15] F. Zabihi, M. Ramezan, M. M. Pedram, and A. Memariani, “Rule Extraction for Blood Donators with Fuzzy Sequential Pattern Mining,” The Journal of Mathematics and Computer Science Ava, vol. 1, no. 1, pp. 37–43, 2011.
[16] E. D. Michie, D. J. Spiegelhalter, and C. C. Taylor, “Machine Learning , Neural and Statistical Classification,” 1994.
[17] D. Bachar and R. Meo, “A distance-based classifier built on class model.