Cell Tissue Kinet. (1974) 7,201-21 1
zyxwvutsrqponmlkjihgfedcbaZYXWVUTSRQPONMLKJIHGFEDCBA
zyxwvutsrqponmlkjihgfedcbaZYXWVUTSRQPONMLKJIHGFEDCBA
ESTIMATION OF THE MEAN A N D VARIANCE
OF
CYCLE TIMES
IN
CINEMICROGRAPHICALLY
RECORDED CELL POPULATIONS D U R I N G
BALANCED EXPONENTIAL GROWTH
P E T E R J A G E R S A N D K L A S N O R R B Y Department of Mathematics, University of Goteborg, and II Department of Pathology, University of Linkoping, Sweden
(Received 26 April 1973; revision received 20 October 1973) A B S T R A C T
The mathematical and statistical problem of estimating the mean and variance of cell cycle times from cinemicrographically observed durations until mitosis (cytokinesis at late anaphase), disintegration, collision (cells superimposing each other) or emigration (moving out of the field of vision) of randomly chosen indi- vidual cells in a population in balanced exponential growth is treated. The re- sulting formulae are simple and considerably reduce the average cell observation time. They are applied to two normal human foetal cell lines and their SV40-trans- formed counterparts. One result is that the latter seem to have longer cycle times in spite of their shorter doubling times. Another result is that the cell mobility seems somewhat increased in the transformed populations. This corroborates earlier findings, indicating that the extent of cell loss, rather than the length of cycle times, may play a decisive role for the (net) doubling time of cultivated cell populations.
I N T R O D U C T I O N
The cycle time, or rather the distribution of cycle times, is one of the most important and most elusive of the factors determining the kinetics of a cell population. Direct observation in vitro is made difficult by the length of the cycle, resulting in censored samples (Norrby,
Johannisson
zyxwvutsrqponmlkjihgfedcbaZYXWVUTSRQPONMLKJIHGFEDCBA
& Mellgren, 1967). Indirect methods like analysis of FLM (PLM)-curves arealso very involved and largely heurisitic or dependent upon narrow assumtpions. For recent surveys (among an abundant literature) see Mendelsohn & Takahashi (1971) or Steel (1972) and for a statistical approach MacDonald (1970).
The aim of this study is to describe a method of estimating the mean cell cycle time and the dispersion of cell cycle times in cultivated monolayer cell populations in balanced exponential growth. Experimentally the method is based on cinemicrographic recordings.
Correspondence: Dr Peter Jagers,Department of Mathematics,University of Goteborg, S-402 20 Goteborg,
Sweden.
zyxwvutsrqponmlkjihgfedcbaZYXWVUTSRQPONMLKJIHGFEDCBA
202
zyxwvutsrqponmlkjihgfedcbaZYXWVUTSRQPONMLKJIHGFEDCBA
Peter Jagers
zyxwvutsrqponmlkjihgfedcbaZYXWVUTSRQPONMLKJIHGFEDCBA
and Klas
Norrby
Mathematically the analysis proceeds from a simple idea and the results should have awide range of application
zyxwvutsrqponmlkjihgfedcbaZYXWVUTSRQPONMLKJIHGFEDCBA
: as has been observed in variouscontexts,any populationin balancedexponential growth has a stable age-distribution, related to the cycle time distribution, the incidence of cell loss, and the distribution of the times to disintegration of disintegrating cells. Thus, if cells are sampled at random from such a population and the time to disintegration or
mitotic division is recorded, this should provide information about the cycle time. Since sampled cells in this procedure are usually not newly born, one would expect a considerably shorter time of observation than by the method of following cells from their birth to mitosis or death.
Since the cells are moving around (only seldomly cells stay essentially in one place) the procedure is complicated by migration and collision; it is often impossible to follow cells
till mitotic division or disintegration, since they emigrate outside the field of vision or collide.
zyxwvutsrqponmlkjihgfedcbaZYXWVUTSRQPONMLKJIHGFEDCBA
It is assumed in this paper that the migration-cum-collision rate (the mobility rate) is constant in time and independent of the ages of cells. Nothing in our material contradicts this assump- tion, though apriori it can not be excluded that cells are more mobile during some stages than during others. It is this limitation that makes it possible to disregard the loss of information caused by migration, or rather it compensates for it. Besides that our model is the most general one suggested for cell proliferation (Nooney, 1968; Jagers, 1970), requiring no parti- cular form of phase time or cycle time distributions, no independence between phase durations, and allowing cell disintegration to take place during the life of the cell according to an arbi- trary law.
What we can observe is the duration of time to disintegration, division, collision or emi- gration of a randomly chosen cell, whichever occurs first. The statistical problem of using such observations to estimate the mobility will be discussed. The use of the mobility rate to find the distribution of durations to death and the main problem, of relating this to the cycle time distribution, will also be dealt with. For the benefit of the non-mathematical reader the outcome of these analyses are presented separately.
M A T E R I A L A N D M E T H O D S Biological
The cell lines used were two normal human foetal lines (GP 115-2 and GP 117-1) and their SV40-transformed counterparts (GP 125-2 and GP 127-1) (for terminology seeNorrby, 1970). The normal lines emanated from skin and lung tissue respectively. The cultivation technique used is the one commonly employed for such normal diploid cells (Hayflick & Moorhead, 1961 ; Norrby, 1970). The transformed lines were studied in the second stage of transformation (Girardi, Jensen & Koprowski, 1965). All cells were fed Minimum Essential Medium (Eagle, 1959) supplemented with 10 a,,: not heat inactivated newborn calf serum, penicillin (100 IU/ml)
and streptomycin (100 ,ug/ml).
For cinemicrography 175,000
k
zyxwvutsrqponmlkjihgfedcbaZYXWVUTSRQPONMLKJIHGFEDCBA
25,000 cells were seeded in Cooper plastic Petri dishes(Falcon Plastics, Los Angeles. U.S.A.) and subsequently maintained in humidified C0,-air atmosphere at 37°C and pH 7-3 0.1. An inverted phase contrast microscope built into a Zeiss Micro Cine Camera equipped with a Zeiss Microflash Unit (30 W sec) was used. Interference and other filters transmitted less than 1
%
of the G1O-j sec flash to the cells. One frame was exposed every other minute at a magnification of about x22.Cell
cycle
times
zyxwvutsrqponmlkjihgfedcbaZYXWVUTSRQPONMLKJIHGFEDCBA
203
1967;
zyxwvutsrqponmlkjihgfedcbaZYXWVUTSRQPONMLKJIHGFEDCBA
Jagers, 1970; Norrby, 1970; NorrbyzyxwvutsrqponmlkjihgfedcbaZYXWVUTSRQPONMLKJIHGFEDCBA
& Mellgren, 1971). Such parameters include the effective cycle rate, the effective net growth rate, the effective death or disintegration rate, andthe probability of a cell dying without dividing. It was further concluded, among other things, that: (i) the migration across the borders of the field of view is random, (ii) the growth fraction is essentially unity, (iii) all cell divisions in the populations now studied yielded two daughter cells, and (iv) distinct cellular events are determined from the cinemicrographs with an error of a single determination less than 2 min (0.03 hr).
It is important to realize that in terms of duration of DNA synthesis and generation time
from FLM curves, as of population doubling time and ‘terminal cell density’, our normal cells compare well with what is known about other normal human foetal fibroblast-like cells (see Norrby & Mellgren, 1971). Transformation with SV40implies aneoplasticchange(Koprowski
et al., 1966). In the present study, in order to record durations to mitosis (to beginning
of cytokinesis at late anaphase-early telophase), to emigration (outside the field of view), to collision (two or more cells being superimposed), and to disintegration, randomly chosen cells at 12 hr intervals during the period of exponential growth were tracked down on the cinemicrographs. The observation of a single cell was thus initiated a random time after the birth of the cell. This was done from one or two experiments per cell line (Table 1, Fig. 1). The collection of durations to mitosis was extended by similar examination of cinemicro- graphs from another two or three experiments per cell line (Table 2). Any duration longer than
12 hr was, of course, considered only once.
zyxwvutsrqponmlkjihgfedcbaZYXWVUTSRQPONMLKJIHGFEDCBA
A large number of cells were successfully tracedthrough collisions but often the tracks of two or more cells ran into each other during the colliding event preventing further tracing of the cells involved. The number of disintegrations recorded is possibly a minimum number since disintegrations occurring during a collision might be camouflaged by the neighbouring and often superimposed cell(s).
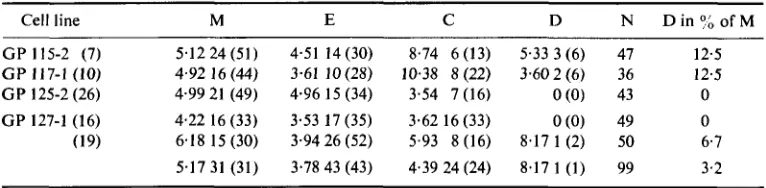
TABLE I . Cells followed to any one of mitotic division, M, emigration out or the field of view, E, collision,
C, or disintegration, D. Columns M, E, C, D give first the mean duration (in hours) to mitosis V, etc., second the number of cells in the cell line followed to M, E, C or D respectively. The parenthesis states that number
as a percentage of the total number of cells observed in the line,
zyxwvutsrqponmlkjihgfedcbaZYXWVUTSRQPONMLKJIHGFEDCBA
N . The digits in parentheses after cell linesymbols indicate the number of times the lines have been subcultivated. GP 115-2 and GP 117-1 are normal foetal human fibrcblast-like cells and GP 125-2 and GP 127-1 their SV40-transformed counterparts.
Cell line
~
M E C D N D i n o f M
~
GP 115-2 (7) 5.1224(51) 4.51 14(30) 8.74 6(13) 5.33 3(6) 47 12.5 G P 117-1 (10) 4.92 16 (44) 3.61 10 (28) 10.38 8 (22) 3.60 2 (6) 36 12.5 GP 125-2 (26) 4.99 21 (49) 4.96 15 (34) 3.54 7 (16) O(0) 43 0
GP 127-1 (16) 4.22 16 (33) 3.53 17 (35) 3.62 16 (33) O(0) 49 0
(19) 6.18 15 (30) 3.9426 (52) 5.93 8 (16) 8.17 1 (2) 50 6.7 5.17 31 (31) 3.78 43 (43) 4.39 24 (24) 8.17 1 ( 1 ) 99 3.2
[image:3.505.61.444.442.536.2]204
zyxwvutsrqponmlkjihgfedcbaZYXWVUTSRQPONMLKJIHGFEDCBA
Peter Jagers
zyxwvutsrqponmlkjihgfedcbaZYXWVUTSRQPONMLKJIHGFEDCBA
and
zyxwvutsrqponmlkjihgfedcbaZYXWVUTSRQPONMLKJIHGFEDCBA
Klas
Norrby
O u r a t i o n t o e n i i o r J t i o n
5 "
zyxwvutsrqponmlkjihgfedcbaZYXWVUTSRQPONMLKJIHGFEDCBA
4314t
3L
15
HOil.,
zyxwvutsrqponmlkjihgfedcbaZYXWVUTSRQPONMLKJIHGFEDCBA
FIG. 1.
zyxwvutsrqponmlkjihgfedcbaZYXWVUTSRQPONMLKJIHGFEDCBA
Distributions of individual durations (in hours) to mitosis, collision or emigrationamong ninety-eight GP 127-1 cells.
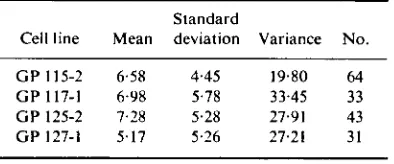
TABLE 2 . Durations to mitosis (hr) in the larger material where only life spans ending by mitotic
division were recorded.
Standard
Cell line Mean deviation Variance No.
G P 115-2 6.58 4.45 19.80 6 4 G P 117-1 6.98 5.78 33.45 33
G P 1 2 5 - 2 7.28
zyxwvutsrqponmlkjihgfedcbaZYXWVUTSRQPONMLKJIHGFEDCBA
5.28 27.91 43 [image:4.502.143.365.68.443.2] [image:4.502.155.352.545.627.2]Cell cycle times
205
zyxwvutsrqponmlkjihgfedcbaZYXWVUTSRQPONMLKJIHGFEDCBA
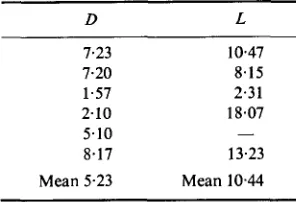
TABLE 3. Durations to disintegration,
zyxwvutsrqponmlkjihgfedcbaZYXWVUTSRQPONMLKJIHGFEDCBA
D,and complete life spans, L
zyxwvutsrqponmlkjihgfedcbaZYXWVUTSRQPONMLKJIHGFEDCBA
(hr) among thezyxwvutsrqponmlkjihgfedcbaZYXWVUTSRQPONMLKJIHGFEDCBA
six cells observed to disintegrate. In one
case L could not be determined.
zyxwvutsrqponmlkjihgfedcbaZYXWVUTSRQPONMLKJIHGFEDCBA
~
D L
1.23 10.47 7.20 8.15 1.57 2.31 2.10 18.07 5.10 -
8.17 13.23 Mean 5.23 Mean 10.44
(M
+
E+
C+
D)zyxwvutsrqponmlkjihgfedcbaZYXWVUTSRQPONMLKJIHGFEDCBA
in the transformed populations. Further, the number of disintegrations inrelation to the number of mitoses is decreased in the transformed cells. This is in full accord- ance with a decrease in cell disintegration as described by other parameters (‘death index’, death rate, and probability of a cell dying without dividing) of transformed cells in earlier studies (Jagers, 1970; Norrby, 1970).
Mathematical
The model is based on generalized branching processes (Crump & Mode, 1968, 1969; Jagers, 1969) but can also be framed in the terminology of Sevast’yanov (1971). (See also Weiner, 1966.) It is assumed that cells are independent of one another, that the cycle time has some arbitrary unknown distribution function G, that cells which complete their cycle divide into two new cells but that the cell cycle may have been interrupted by a disintegration. The (known or unknown) probability of the latter event is denoted by p and the time from birth to disintegration (in cases where it occurs) is supposed to have another completely unknown distribution, denoted by F.
Such models are the most general ones proposed for cell proliferation. They have certain limitations, though. First, some findings (Kubitschek, 1967; Norrby et al., 1967) indicate a positive correlation between life-lengths of sister cells. Second, the model only concerns cells participating in the kinetic process, leaving out of consideration, e.g. the possibility of entering a prolonged GI or G, cell cycle phase. This should be without significance in cases like ours with a growth fraction close to unity. The probability of disintegration is taken as less than
+,
meaning that we do not consider populations bound to extinction.In biological systems it is often difficult to judge whether an exponential population growth actually is balanced. From the literature, however, it seems acceptable to interpret an expo- nential population growth as balanced, at least, as in our case, when the period of exponential growth substantially exceeds one population doubling time (cf. Steel, 1968; Norrby &
Mellgren, 1971).
The results of mathematical analysis of such a model are as follows: Denote by T, the mean cycle time, i.e. the expectation of the cycle time distribution G, and by V, the variance of the cycle time. The biological reader should note that T, and V, are indeed the mean and variance
in the basic elementary meaning and not any ‘flux statistics’ (Quastler, 1963). Let t, and
zyxwvutsrqponmlkjihgfedcbaZYXWVUTSRQPONMLKJIHGFEDCBA
u, [image:5.505.180.328.110.211.2]206
Peter Jagers arid
zyxwvutsrqponmlkjihgfedcbaZYXWVUTSRQPONMLKJIHGFEDCBA
Klas
Norrby
zyxwvutsrqponmlkjihgfedcbaZYXWVUTSRQPONMLKJIHGFEDCBA
disintegrating cells chosen at random from a population in balanced exponential growth. Let Td stand for the doubling time of the population. Then,
If there is no cell loss, then p
zyxwvutsrqponmlkjihgfedcbaZYXWVUTSRQPONMLKJIHGFEDCBA
= 0 and the formulae reduce toTc = f ( t c Td/ln2)
zyxwvutsrqponmlkjihgfedcbaZYXWVUTSRQPONMLKJIHGFEDCBA
(1')zyxwvutsrqponmlkjihgfedcbaZYXWVUTSRQPONMLKJIHGFEDCBA
v,
= $(rc - t C 2zyxwvutsrqponmlkjihgfedcbaZYXWVUTSRQPONMLKJIHGFEDCBA
+
21, Td/ln2) - TC2 (2')Note that the formulae are independent of the distribution F of durations to disintegration,
which is virtually not apprehensible (see Table 3, though).
zyxwvutsrqponmlkjihgfedcbaZYXWVUTSRQPONMLKJIHGFEDCBA
Also observe that even if the extentof cell loss is not exactly known ( I ) and (2) can be used to give bounds for T, and V,, (cf. Fig.
Though the relations are simple, they follow only from a relatively (in this context) ad- vanced mathematical analysis (available from the authors on request). However, in the ex- tremely simplified-but still popular-model where the cycle time is assumed to be constant
(=T,) and there is no cell loss (i.e. p = 0, implying that T, = Td), the relation (1 ')can be deduced elementarily: I t is known, and graphical formulations are given in almost any survey paper (cf. Lipkin, 1970), that in this case ages in balanced exponential growth are distributed accord- ing to a decreasing exponential density over the interval from zero to T,. Indeed, the density
is 2xe-'* for 0 Q t
<
T, andzyxwvutsrqponmlkjihgfedcbaZYXWVUTSRQPONMLKJIHGFEDCBA
a = (ln2)/TC. Hence the average age of cells sampled at randomfrom such a population in balanced exponential growth is 2 ) .
T c
0
2r
I
te-*'dt = 2{-Tc e-ITc+
I/cc - P r c / a } = (TJIn2) - Tcafter a replacement of 2 again by (In2)/Tc. The expected time from sampling to division there-
fore is
t , = T, - {(T,/ln2) - Tcj = 2T, - T 4 n 2
And the right-hand side of ( 1 ' ) collapses into
( t ,
+
Tc/ln2)/2 = T,as should be the case.
Statistical
Since we consider exponential growth, the doubling time Td is easily determined; if No is the population number at time zero and N , the size t time units later, then an estimator of Td is
f d = ( t 1n2)/ In
",IN,)
(Recall the division by In2 in the formulae). As t o p some information was given by Jagers
( 1 970, 1973) and Norrby ( 1970).
The parameters t, and t', are estimated thus: Denote thedurations observed, according to the procedure described above, until any one of mitosis, disintegration, collision, or emigration
Cell cycle times
zyxwvutsrqponmlkjihgfedcbaZYXWVUTSRQPONMLKJIHGFEDCBA
100-
zyxwvutsrqponmlkjihgfedcbaZYXWVUTSRQPONMLKJIHGFEDCBA
80
zyxwvutsrqponmlkjihgfedcbaZYXWVUTSRQPONMLKJIHGFEDCBA
60-
207
-
I8
i
GP 117-112
GP 125-2
GP 127-1
16
zyxwvutsrqponmlkjihgfedcbaZYXWVUTSRQPONMLKJIHGFEDCBA
111,
0,
,
I , I ,,
,
0
h
‘80 O ° K
40
6ol
2ot
IIII)JIJIII0 0 0 5 010 015 0.20 0 2 5
zyxwvutsrqponmlkjihgfedcbaZYXWVUTSRQPONMLKJIHGFEDCBA
P
zyxwvutsrqponmlkjihgfedcbaZYXWVUTSRQPONMLKJIHGFEDCBA
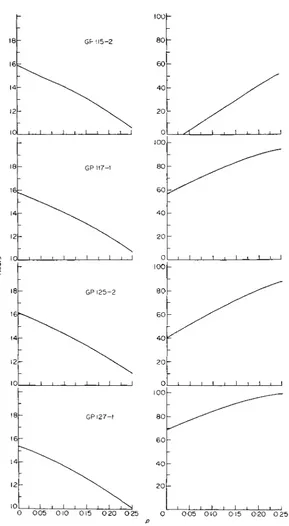
FIG. 2. Estimates of means,
fc
(left), and variances,zyxwvutsrqponmlkjihgfedcbaZYXWVUTSRQPONMLKJIHGFEDCBA
pc
(right) (in hours) based on our data [image:7.503.97.386.67.593.2]208
Peter Jagers and Klas
zyxwvutsrqponmlkjihgfedcbaZYXWVUTSRQPONMLKJIHGFEDCBA
Norrby
zyxwvutsrqponmlkjihgfedcbaZYXWVUTSRQPONMLKJIHGFEDCBA
x,,
zyxwvutsrqponmlkjihgfedcbaZYXWVUTSRQPONMLKJIHGFEDCBA
.v2,.. .
s,.zyxwvutsrqponmlkjihgfedcbaZYXWVUTSRQPONMLKJIHGFEDCBA
LetzyxwvutsrqponmlkjihgfedcbaZYXWVUTSRQPONMLKJIHGFEDCBA
zyxwvutsrqponmlkjihgfedcbaZYXWVUTSRQPONMLKJIHGFEDCBA
i be the mobility rate, i.e. we assume that during a short interval the risk of acell emigrating or colliding is approximately i times the length of the interval. The rate is estimated by
= (no. of collisions
+
emigrations observed)/2
zyxwvutsrqponmlkjihgfedcbaZYXWVUTSRQPONMLKJIHGFEDCBA
x jm
zyxwvutsrqponmlkjihgfedcbaZYXWVUTSRQPONMLKJIHGFEDCBA
j = l
A basis for this is given in the appendix. Let
Then, through replacing in the relations distribution functions by cumulative empiric distri- butions, estimators i, and f ' t ) are obtained off, and I ( : ) = z l c
+
rez, respectively:
We write
for the estimator of r,. From an intuitive point of view the blowing up of estimators by the factor eXrj balances the fact that due to migration and collision only the shorter ones among durations to mitosis are observed. If i. and hence
1
were null, the sums would reduce to con- ventional expressions, like the arithmetic mean for ic.We arrive at the following final formulae for empiric use:
As an illustration for cell line GP 127-1 the number of collisions
+
emigrations was 24+
43 = 67 (Fig. I ). The sum of all times observed to any one of mitosis, disintegration, collision
or emigration is
zyxwvutsrqponmlkjihgfedcbaZYXWVUTSRQPONMLKJIHGFEDCBA
s, = 435.65 (Fig. 1 ). Hence2
= 67/435.65 = 0.154. The estimated doubl-ing time
fd
is 13.5 (Table4). Further the numbers s,,. . .
x, are as exhibited in Fig. 1, durations to mitosis. Calculation of4
and insertion into (3) and (4) yieldfc
andp,
for various p . For no cell death, p = 0,Tc
= 15.3 and9,
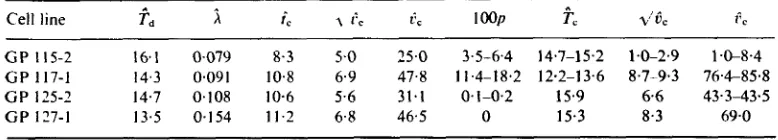
= 69 (Table 4).TABLE 4. The last three columns give the main empiric:esults of this paper, estimates ofthe mean, standard deviation, and variance of the cycle time distribution. Td is the estimated doubling time, h the estimated rate
of mobility, and l o o p is the percentage of cell death. For i,, etc., see the text.
[image:8.511.58.447.557.627.2]Cell
cycle times
zyxwvutsrqponmlkjihgfedcbaZYXWVUTSRQPONMLKJIHGFEDCBA
209
zyxwvutsrqponmlkjihgfedcbaZYXWVUTSRQPONMLKJIHGFEDCBA
A P P L I C A T I O N , R E S U L T S A N D C O M M E N T S
Application of (I), (2) and the estimators derived above to the four cell lines yield the results
in Table 4.
zyxwvutsrqponmlkjihgfedcbaZYXWVUTSRQPONMLKJIHGFEDCBA
The estimates Tdand@ of the doubling timezyxwvutsrqponmlkjihgfedcbaZYXWVUTSRQPONMLKJIHGFEDCBA
Td and cell disintegration probabilityzyxwvutsrqponmlkjihgfedcbaZYXWVUTSRQPONMLKJIHGFEDCBA
p are from Jagers (1970) and Norrby (1970), the latter estimate being calculated under the assumption that mitosis has a duration independent of the cycle time. Close results have been
obtained recently without this restriction (Jagers, 1973). The rate of mobility,
zyxwvutsrqponmlkjihgfedcbaZYXWVUTSRQPONMLKJIHGFEDCBA
I,
seems higherfor the transformed cells than for the normal ones. Direct cinemicrographical observations
also hint at this (Table I).
zyxwvutsrqponmlkjihgfedcbaZYXWVUTSRQPONMLKJIHGFEDCBA
A remarkable feature about Table 4 is the low cycle time variancezyxwvutsrqponmlkjihgfedcbaZYXWVUTSRQPONMLKJIHGFEDCBA
p,
of GP 115-2 cells. We have not been able to explain this but one should note that this culture also has the smallest ri, and by far the smallest variance of the observed durations to mitosis (Table 2). In view of the results in Table 4, let us point out here that T, for transformed cells may very well exceed T, for these, since variance in cycle times implies the occurrence ofindividual cycles much shorter than the mean T,. Obviously they influence the doubling time. It is noteworthy that in the transformed cells the mean cycle time, T,, appears longer despite the fact that the effective doubling time, Tdr is shorter than for the corresponding normal cells (Table 4). This indicates that cell disintegration is significantly reduced in the transformed lines and fits well with the actual decrease in number of disintegrations among the transformed cells as recorded from the cinemicrographs (Table 1). We thus have further evidence that the concept of ‘kinetic transformation’ (Norrby, 1970) is appropriate. Thus, it is not due to increased rate of cell production that the populations of transformed cells-similarly to other neoplastic and malignant cell populations studied by us (Norrby, 1970; Norrby & Mellgren, 1971)-expand faster than their normal counterparts but because of a reduced rate of dis- integration.
More information is furnished by Fig. 2, which gives
f’,
andp,,
once the correctp is known. Observe that it does not exhibitp,
andp,
as functions of p . Indeed, the cycle time, being a property of not disintegrating cells, is independent of the frequency of cell disintegration. Therefore negative values are conceivable in thepc
column. They show that the correspondingp values are impossible. We have included Fig. 2 to emphasize what has been stated before, namely that some conclusions from formulae ( I ) and (2) are possible even in cases wherep is unknown.
The average duration of observation of cells, as accounted for in Tables 1 and 2, was around 6 hr. This should be compared to two or three times longer average time of observation re- quired in a method where a daughter of a dividing cell is followed till mitotic division (pro- vided nothing interrupts the cell cycle). This shorter observation of individual cells will probably be welcomed by those who are familiar with the tedious examination of cinemicro- graphic films.
210
zyxwvutsrqponmlkjihgfedcbaZYXWVUTSRQPONMLKJIHGFEDCBA
Peter Jagers and
Klas
Norrby
zyxwvutsrqponmlkjihgfedcbaZYXWVUTSRQPONMLKJIHGFEDCBA
the present method sampling of observed durations is made without the censoring whichoperates when cycle times are recorded by following single cells from their birth to their
mitotic division (Norrby et
zyxwvutsrqponmlkjihgfedcbaZYXWVUTSRQPONMLKJIHGFEDCBA
a/., 1967). I n the last end, though, only repeated application t odifferent populations of the procedure and estimators derived can show their reliability and give further credit to the method and a firmer base for the biological results gained.
A P P E N D I X
As mentioned, the underlying mathematical analysis is available from the authors on request.
At this place we only comment briefly upon one statistical aspect, the estimation of
zyxwvutsrqponmlkjihgfedcbaZYXWVUTSRQPONMLKJIHGFEDCBA
A.
As toother entities, the doubling time
zyxwvutsrqponmlkjihgfedcbaZYXWVUTSRQPONMLKJIHGFEDCBA
T, is easily measured, from exponential growth, and theincidencep of cell loss has been discussed elsewhere by the authors.
The rate of mobility,
zyxwvutsrqponmlkjihgfedcbaZYXWVUTSRQPONMLKJIHGFEDCBA
;.,
must be estimated from a randomly censored sample. Indeed achosen cell either dies (divides or disintegrates) or emigrates-collides and no information can be available as to when a cell that died before emigration would have emigrated or collided. Thus what we can observe is the minimum of two random variables, one of which is expo- nential with parameter ;.. It has long been known (Deemer & Votaw, 1955) that if there is
available a sample (sI.
zyxwvutsrqponmlkjihgfedcbaZYXWVUTSRQPONMLKJIHGFEDCBA
. . ., s,)zyxwvutsrqponmlkjihgfedcbaZYXWVUTSRQPONMLKJIHGFEDCBA
of exponential random variables with parameter I, censored atsome fixed pointy, then with
zyxwvutsrqponmlkjihgfedcbaZYXWVUTSRQPONMLKJIHGFEDCBA
13, the number of x, 6 y,2
min(xj, y)/v,is a consistent maximum likelihood estimator of I/).. I t is not difficult to show that the con- sistency and even an asymptotic normality persist in our setup wherey is replaced bya sequence of independent and identically distributed random variables yl,
.
. ., yn also independent ofs,. . . ., s,: If the y j have distribution K and
zyxwvutsrqponmlkjihgfedcbaZYXWVUTSRQPONMLKJIHGFEDCBA
\in is the number of x j 6 y j , thenn
j = 1
n
j = 1
u, =
2
min(x,, y j ) / v n is a consistent and asymptotically normal estimator of I/;..A C K N O W L E D G M E N T S
We are grateful to A. Odin for a helpful discussion and to B. Pettersson for computational help. Part of this study was supported by grants from the Swedish Cancer Society.
R E F E R E N C E S
CRUMP, K.S. & MODE, C.J. (1968, 1969) A general age-dependent branching proccss I and 11. J. Murh. Anal.
DEEMER, W.L. & VOTAW, D.F. (1955) Estimation of parameters of truncated or censored exponential distri- EAGLE, H . (1959) Amino acid metabolism in mammalian cell cultures. Science, 130,432.
GiRARm, A.J., JENSEN, F.C. & KOPROWSKI, H . (1965) SV40-induced transforfration of human diploid cells; HAYFLICK. L. & MOORHEAD, P.S. (1961) The serial cultivation of human diploid cell strains. Exp. CeN Res. 25, J A G F R S , P. (1969) A general stochastic model for population development. Skund. Aktuur. Tidskr. 52,84.
Appl. 24,494; 25,8.
butions. Ann. Morh. Staris/. 26,498.
crisis and recovery. J. cell. romp. Physiol. 65, 69.
Cell cycle times
zyxwvutsrqponmlkjihgfedcbaZYXWVUTSRQPONMLKJIHGFEDCBA
21
1
zyxwvutsrqponmlkjihgfedcbaZYXWVUTSRQPONMLKJIHGFEDCBA
JAGERS, P. (1970) The composition of branching populations: A mathematical result and its application to determine the incidence of death in cell proliferation. Math. Eiosci. 8,227.
JAGERS, P. (1973) Maximumlikelihoodestimation of thereproduction distribution in branching processes and the extent of disintegration in cell proliferation. (In press).
KOPROWSKI, H., JENSEN, F., GIRARDI, A. & KOPROWSKA, I. (1966) Neoplastic transformation. Cancer
zyxwvutsrqponmlkjihgfedcbaZYXWVUTSRQPONMLKJIHGFEDCBA
Res.26, 1980.
KUBITSCHEK, H. (1967) Cell generation times; ancestral and internal controls. Proc. 5th Berkeley Syrnp. Math.
zyxwvutsrqponmlkjihgfedcbaZYXWVUTSRQPONMLKJIHGFEDCBA
Starist. Prob.
zyxwvutsrqponmlkjihgfedcbaZYXWVUTSRQPONMLKJIHGFEDCBA
4, 549.LIPKIN, M. (1970)The proliferativecycleof mammaliancells. I n : The CeNCycleandCancer(ed. by R. Baserga). Marcel Dekker, New York.
MACDONALD, P.D.M. (1970) Statistical inference from the fraction labelled mitoses curve. Biometrika, 57,
489.
MENDELSOHN, M.L. &TAKAHASHI, M. (1971)Acriticalevaluation ofthefraction oflabelledmitosesmethod
zyxwvutsrqponmlkjihgfedcbaZYXWVUTSRQPONMLKJIHGFEDCBA
as applied to tumour and other cell cycles. In: The Cell Cycle and Cancer (Ed. by R. Baserga). MarcelDekker, New York.
NOONEY, G.C. (1968) Age distributions in stochastically dividing populations. J. theoret.
zyxwvutsrqponmlkjihgfedcbaZYXWVUTSRQPONMLKJIHGFEDCBA
Biol. 20, 314. NORRBY, K. (1970) Population kinetics of normal, transforming and neoplastic cell lines. Acfapath. microbid.NORRBY, K., JOHANNISSON, G. & MELLGREN, J. (1967) Proliferation in an established cell line. An analysis of NORRBY, K. & MELLGREN, J. (1971) Birth, death and net growth of normal, transforming, neoplastic and QUASTLFR, H. (1963) The analysis of cell population kinetics. Cell Prolferation (Ed. by L. F. Lamerton and SEVAST’YANOV, B.A. (1971) Vetuyas’Ciesya Protsessy. Mir, Moscow.
STEEL, G.G. (1968) Cell loss from experimental turnours. Cell Tissue Kinet. 1, 193.
STFEL, G.G. (1972) The cell cycle in tuniours: an examination of data gained by the technique of labelled scand. 78, Suppl. 214.
birth, death and growth rates. Exp. Cell Res. 48, 582.
malignant cell lines. Decrease of death rate in neoplastic alteration. Path. europ. 6, 56. R. J. M. Fry), pp. 18-34. Blackwell Scientific Publications, Oxford.
mitoses. Cell Tissue Kinet. 5,87.
WEINER, H.J. (1966) Applications of the age distribution in age-dependent branching processes. J. appl. Prob.