Institute Integrity of Malaysia, Persiaran Duta, Off Jalan Duta, Kuala Lumpur, Malaysia
MEDIUM ENTERPRISES AS NEW SOURCE
OF ECONOMIC GROWTH OF ASEAN COUNTRIES:
CROSS-COUNTRY COMPARISON
1Mangara Tambunan
Professor
Bogor Agriculture University
and
Faculty of Economics,
University of Indonesia.
Managing Director and Senior Researcher,
CESS, Jakarta
Lasmono Tri Sunaryanto
Lecturer and Researcher
Satya Wacana Christian University (SWCU),
Salatiga
2
ABSTRACT
After Asia economic crisis 1997 hit hard ASEAN country economy, there is a growing interest to reexamined the past industrialization strategy as vehicle for achieving a high economic growth. While small size industries are received more attention in South East economic at both national and international organizations, the medium size industries, is widely recognized but research and debates are practically not go anywhere and definition of MEs itself are remain diverse. The problem is that very few experts and economists pay attention to the strategic role of MEs in the industrial productivity, growth and export. The objective of this paper is two fold: (1) to analyze the overall/role of MEs in ASEAN countries, and (2) to compare condition of MEs and its implication for future business development in ASEAN countries. There are three major findings for the role of Mes: (1) there is a significant contribution of MEs in the economic growth for each counties being analyzed, (2) tend to labor intensive firms and (3) mostly MEs have capability to use "market niche" product development.
Some constraints of MEs development in ASEAN countries are: (1) most MEs are local resource based industries and this is the reason why may have play an important role in the "industrial safety-net" during economic crisis, (2) ASEAN don't have a MEs strong business network such as business association, cooperative, and also market information network, and (3) definitions of MEs among member are so diverse and therefore it is quiet difficult to "reconcile" program for the promoting scheme among ASEAN members.
BACKGROUND
Economic development can be claimed as the effort to pursue the combination of economic growth with the industrial structural change objectives. Under pursuing a high economic growth and industrial structural changes, there is a strong desire among ASEAN countries to combine multiple objectives: the high economy growth and equality which often very difficult to attain simultaneously. To achieve these objective many economists argued that in the process of unfolding industrialization, it is important to balance industrial growth with certain formation of industrial players. In other words it “firm scale” is matter for achieving such targeting objective. For long time, most ASEAN countries has consistently searching for the possibility to solve this inequality problem through balancing the formation of industrial scale involving in the industrialization process.
As many developing countries experiences, (as in this case Indonesia), shows during implementing import substitution, industrialization strategies (ISI) since 1970, most government policies implementation which initially looking for source of (economic industrial) growth resulted to the fact that it was bias toward (pro-) large size corporations (conglomerates) and somewhat against small and medium enterprises. This ISI, has effectively create imbalance industrial structure where member and role of medium and small enterprises in the process of contributing to the value added (economic growth) relatively low (30%) compared to 70 % contributed by large size industries. Small and medium enterprises (SMEs) tend to adopt labor-intensive technology, which absorbed about 70% of industrial employment. This “productivity industrial dualism” is likely will continue to the future unless there is a strong effort to close the gap (in term of productivity) through industrialization process. In this industrial circumstance, the medium enterprise as a potential new source of economic growth plays a critical role.
After hit by economic crisis in 1997 and the dust of seven years crisis have settled down, it become clear that large companies are collapsed earlier while small and medium enterprises relatively less affected and even playing a major role as "safety valve" of economy by creating social safety nets through million unemployment skilled workers. The most important performance noted from economic crisis is that SMEs have effectively provided a continuation of economic activities as both working in the supply (investment) and demand power (consumption). Up to present time, the contribution of consumption to make Indonesia economic recovery with achieving average 3.2 for period of 2001-2002, and this growth largely derived from small and medium economic activities.
The objective of this paper is two fold: (1) to analyze the overall/role of MEs in ASEAN countries, and (2) to compare the productivity of MEs and its implication for future business development in ASEAN countries. There are three major findings for the role of Mes: (1) there is a significant contribution of MEs in the economic growth for each counties being analyzed, (2) tend to labor intensive firms and (3) mostly MEs have capability to use "market niche" product development.
Systematically this paper contains of five sections: First section, constitutes the background, and the Second section, specify the definition problem of size of industries, but especially medium enterprises. Third section, a cross-country of the SMEs position in ASEAN countries. Fourth section, the potential of MEs as a new sources of growth. Fith section, the great vertical immobility of SMEs as an Indonesia cases, and Six, as final section, a general conclusion.
MEDIUM ENTERPRISES AS NEW SOURCE OF
ECONOMIC GROWTH: A COMPARISON
A. Problem Definition
4
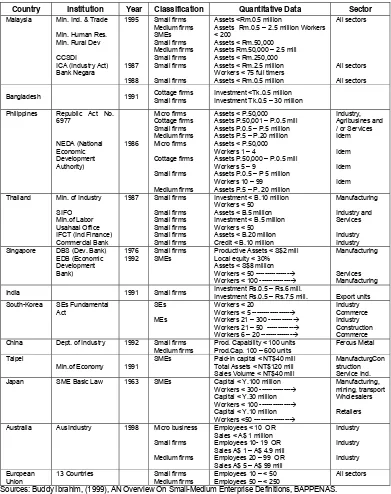
statistics, administering tax system, information system, economic planning, credit ration, support and promotion (ADB, SMEs Development TA for Indonesia, 2001). As far as definition concern, there is no theoretical reference can be used and in fact the definitions used was varies according to various context of intended usage (as shown in Table 1 below). The table shows how Asian countries’ definitions on SMEs are different. There is a need to emphasize here, in the promoting MEs it required that clear definition to any government agencies involved so that it could be part of national, as well as, local government management system.Table 1. Definition of Small and Medium Size Firms
Country Institution Year Classification Quantitative Data Sector
Malaysia Min. Ind. & Trade
Min. Human Res.
Assets Rm.0.5 – 2.5 million Workers < 200
Assets < Rm.50,000 Assets Rm.50,000 – 2.5 mill Assets < Rm.250,000 Assets < Rm.2.5 million Workers < 75 full timers Assets < Rm.0.5 million
All sectors
All sectors
All sectors
Bangladesh 1991 Cottage firms Small firms
Investment <Tk.0.5 million Investment Tk.0.5 – 30 million
Philippines Republic Act No. 6977 Assets P.50,001 – P.0.5 mill Assets P.0.5 – P.5 million Assets P.5 – P.20 million Assets < P.50,000 Workers 1 – 4
Assets P.50,000 – P.0.5 mill Workers 5 – 9
Thailand Min. of Industry
SIFO
Investment < B.10 million Workers < 50
Assets < B.5 million Investment < B.5 million Workers < 50 Assets < B.20 million Credit < B.10 million
Manufacturing
Industry and Services
Industry Industry Singapore DBS (Dev. Bank)
EDB (Economic
Productive Assets < S$2 mill Local equity < 30% Assets < S$8 million Workers < 50 ---Æ
Investment Rs.0.5 – Rs.7.5 mill. Export units South-Korea SEs Fundamental
Act
Prod. Capability < 100 units Prod.Cap. 100 – 600 units
Ferous Metal
Taipei
Min.of Economy 1991
SMEs Paid-in capital < NT$40 mill Total Assets < NT$120 mill Sales Volume < NT$40 mill
ManufacturgCon struction Service Ind. Japan SME Basic Law 1963 SMEs Capital < Y.100 million
Workers < 300 ---Æ
Capital < Y.30 million Workers < 100 ---Æ
Capital < Y.10 million Workers <50 ---Æ
Manufacturing, mining, transport Wholesalers
Retailers
Australia AusIndustry 1998 Micro business
Small firms
13 Countries Small firms Medium firms
Employees 10 – < 50 Employees 50 – < 250
All sectors
SMEs definition is too vary, maybe the only really common characteristic of SMEs is that they are “not-large” (APEC, 2002); that is whether a firm is really an SME or not is relative. SMEs may range from a part time business with no employees, to a semiconductor manufacturer employing hundreds of people. They may range from fast growing firms, to private family firms that have not changed much for decades. They range from SMEs which are independent or stand-alone businesses, to SMEs which a group, such as those which are part of an international subcontracting network (APEC, 2002).
Table 1 also shows that every country has their own definition. However there are two of the most interesting matter out of this definition list, i.e.: (1) some countries use capital, labor or total sales as basic criteria for the firm size classification and (2) for some other Asia countries, the definition is break down according the existing sectors of economy. This firm sectors base definition is just recently evolved out of urgent need for developing a realistic definition with respect to the nature of capital-output ratio, capital-labor ratio, total sales per unit firm etc. that all MEs may have sharply different between economic sectors.
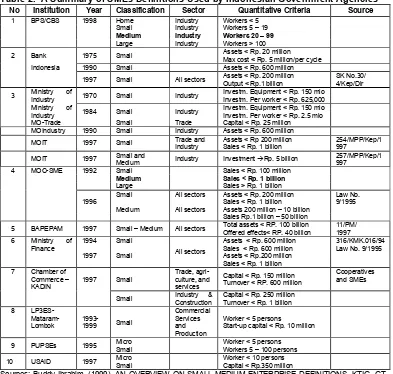
Table 2. A Summary of SMEs Definitions Used by Indonesian Government Agencies
No Institution Year Classification Sector Quantitative Criteria Source
1 BPS/CBS 1998 Home Industry Workers < 5 Small Industry Workers 5 – 19
Medium Industry Workers 20 – 99
Large Industry Workers > 100
2 Bank 1975 Small Assets < Rp. 20 million Max cost < Rp. 5 million/per cycle Indonesia 1990 Small Assets < Rp. 600 million
1997 Small All sectors Assets < Rp. 200 million Output < Rp.1 billion SK No.30/ 4/Kep/Dir
3 Ministry of Industry 1970 Small Industry Investm. Equipment < Rp. 150 mio Investm. Per worker < Rp. 625,000
Ministry of
Industry 1984 Small Industry
Investm. Equipment < Rp. 150 mio Investm. Per worker < Rp. 2.5 mio MO-Trade Small Trade Capital < Rp. 25 million
MOIndustry 1990 Small Industry Assets < Rp. 600 million
MOIT 1997 Small Trade and Industry
Assets < Rp 200 million Sales < Rp. 1 billion
254/MPP/Kep/1 997
MOIT 1997 Small and Medium Industry Investment ÆRp. 5 billion 257/MPP/Kep/1997 4 MOC-SME 1992 Small Sales < Rp. 100 million
Assets < Rp. 200 million Sales < Rp. 1 billion Assets 200 million – 10 billion
Law No. 9/1995
Sales Rp.1 billion – 50 billion
5 BAPEPAM 1997 Small – Medium All sectors Total assets < RP. 100 billion Offered effects< RP. 40 billion
11/PM/ Assets < Rp.200 million Sales < Rp. 1 billion
Capital < Rp. 150 million Turnover < RP. 600 million
Cooperatives and SMEs
Small Industry & Construction Capital < Rp. 250 million Turnover < Rp. 1 billion
8 LP3ES-
Worker < 5 persons
Start-up capital < Rp. 10 million
9 PUPSEs 1995 Micro Small
Worker < 5 persons Workers 5 – 100 persons
10 USAID 1997 Micro Small Worker < 10 persons Capital < Rp.350 million
Sources: Buddy Ibrahim, (1999), AN OVERVIEW ON SMALL-MEDIUM ENTERPRISE DEFINITIONS, KTIG, GT, and BAPPENAS.
6
policy formulation and implementation. Therefore given the pluralism of MEs, general definitions will not help government agencies policies for promoting MEs. For example, Japan use specific category for every sector and as result Japan has clear ideas on how to promote MEs development. Whilst Indonesia use general definition, for all economic sector but due to the merits of each government agencies, as they see it suitable to their agencies program but lacking sound program especially in the area of coordination to promote MEs (Table 2). This general definition has created a serious problem2 and therefore there is a need to revise it properly.As in Indonesia cases, Table 2 shows various definitions were applied by different government agencies. The diversity of the definition indicates that MEs treatment has not been comprehensive and clear yet. On one hand, MEs is still frequently viewed as have similarity to SEs, which in the reality of business is true, but on the other hand MEs is also being perceived have character similarities with LEs. Based on the industrial statistics released by Central Bureau of Statistic (CBS), medium industrial size data are always be unified with large industrial size data. The subsequently question and problem is the appropriateness of medium enterprises which characteristics similarities, as it looks for Indonesia case, is much more close to small enterprises. They are more deeply rooted in the domestic economy and less dependengt on import, Shilling, 2004.
However, our lesson learned from the impact of economic crisis is that, it gives us a new perspective. During economic crisis large number of medium enterprises are become client of Indonesian Banking Restructuring Agency (IBRA). This indicates before economic crisis, medium enterprises have actively borrowed overseas high interest capital. As result of the financial crisis derived from Asia crisis, medium enterprises are more close to the large enterprises. This implies that MEs also has strong similarities with LEs, which vulnerable to business cycle.
When the government of Indonesia trying to rescue of MEs from collapsed, the MEs association had applied political pressure asking government to get debt “hair-cut” as government did for LEs. Up to present time this has been a hot debate in Indonesia. One of key point from this debate is that government of Indonesia should established new definition of enterprises. Similar task should be taken by ASEAN governments, so that it is easier to set fiscal and credit allocation and also for any international trade agreements. The question then is should new entirely separate definition for micro, small, medium and large enterprises each independently be defined? Quiet frankly, we do not know yet whether necessary to separate rather than united small with medium enterprises. Alternatively separating (merging) medium with large enterprises or separating (merging) medium with small enterprises. This still remains in questioned.
B. The Potentiality Of Mes
Given all of those variety of MEs definitions, and since SMEs make up the largest portion of the employment base and, indeed still remain the backbone of the ASEAN countries private sector. Therefore, there is a need to look what and how MEs playing its role in South East Countries. Before comparing the role of MEs in most ASEAN countries putting MEs united to SMEs. As result it is very difficult for the author to separate between small and medium size enterprises. Although SMEs could—and should—play a much larger role in development, but too often MEs has lack of attention in the government industrial policy decision, because a series of serious problems such as lack unclear of definition, so that MEs was lost in the large versus small industrial development policy body.
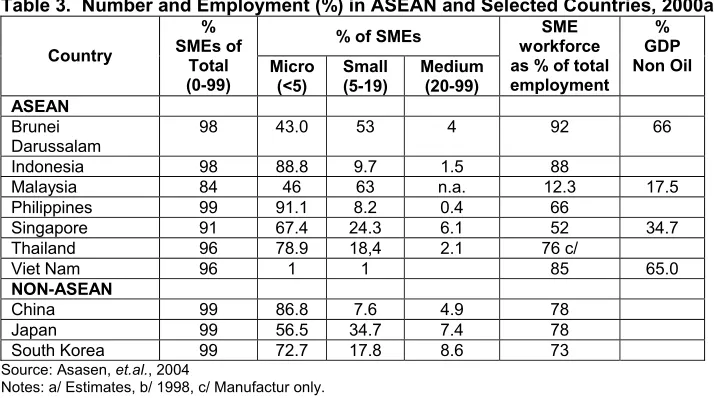
It is widely understood that SMEs are claimed as a “seedbed” for larger enterprises and thus for growth and innovation. The number of SMEs in an economy is one basic indicator of the entrepreneurial health and competitiveness of that economy. To show how import the role of SMEs figures presented in Table 3 shows the percentage number of SME
2
in ASEAN countries and the workforce. It shows that SMEs generally account more than 95% of business entity in every country, except for Malaysia and Singapore, and these SMEs absorb more than 75% of labor force. This means that SMEs are playing strategic role in most ASEAN economies.
Table 3. Number and Employment (%) in ASEAN and Selected Countries, 2000a/
% of SMEs
Notes: a/ Estimates, b/ 1998, c/ Manufactur only.
At this time, from economic crisis to economic recovery, most ASEAN economic policies are determined to pursue not only a high economic growth but also creating large employment opportunities. In order to achieve these two objectives in facing slower world economy, promoting of SMEs growth viewed as strategic option for searching the new source of economic growth. In the past like Indonesia, Thailand, the Phillipines and Malaysia resources and export were heavily relied on large-scale manufacture export, which achieved through promoting direct foreign investment (FDI) primarily from Japan. After economic crisis, this economic policy however due to massive capital outflow, may not be the same again.
It is widely believed, in order to achieve both a high economic growth and employment creation, ASEAN economies policy should identify the new source of economic growth. This paper offers a strategic policy for promoting the role of MEs because of its potentiality to contribute productivity of economy. This implies, if ASEAN government policies promoting MEs along efficient and competitive SEs and LEs through improving business environment and easy access to dynamic market factors, would ultimatelay contribute to the dynamic growth of ASEAN economies. Based on the reason outlined above, it is arguable, that the role of MEs in ASEAN economies is strongly promoted. Some other reason for promoting MEs, because of its peculiar characteristics, such as:
• its flexibility to adjust for economic changes, and
• its domestic market resource orientiation and less depending on banking credit market. This MEs sector able to absorb some of those laid off workers from LEs during economic crisis (Shilling, 2004). Because of these merits, it is imperative to argue ASEAN countries should pay a serious attention and better treatment are required to the overall economic (industrial) policy making especially in building of buiness network over global economy.
Back to the statistical figure of MEs across ASEAN countries, we found, it is quite difficult to separate the figure of MEs and SEs. In general however, the statistical number of MEs establishment cross ASEAN countries for unclear reason are relatively very small, about 5% of total SMEs, and this condition create a phenome called the missing middle. The problem of missing of the middle problem actually had been identified since 1970s but it never seriously taken into policy consideration in most ASEAN countries.
8
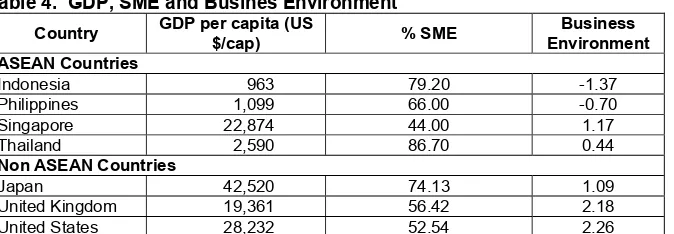
resource quality (entrepreneurship), low content of technology and poor management and accounting system, (3) unlike SEs, MEs relatively have legal formal and well organized as family owned firm. In the future, MEs growth contribution in the economy will largely hinged on how these two major constraints removed.Table 4 shows how is likely the business environment problem could have effect on SMEs growth. Beck,et.al. (2004) defining business environment as an aggregate indicator of the business climate in which firms operate that includes information on the degree of private property rights protection, the cost of contract enforcement, the cost of entering the market, and the efficiency of the bankruptcy system. The business environment was scored from –3 (the worst) to +3 (the best). The statistical table 4 shows that the worst business environments is in Indonesia, followed by the Philippines. The best is Singapore and for Non Asean countries is the United State economy
Table 4. GDP, SME and Busines Environment
Country GDP per capita (US
$/cap) % SME
Business Environment ASEAN Countries
Indonesia 963 79.20 -1.37
Philippines 1,099 66.00 -0.70 Singapore 22,874 44.00 1.17
Thailand 2,590 86.70 0.44
Non ASEAN Countries
Japan 42,520 74.13 1.09 United Kingdom 19,361 56.42 2.18 United States 28,232 52.54 2.26
*) Business environment is an aggregate indicator of the business climate in which firms operate that includes information on the degree of private property rights protection, the cost of contract enforcement, the cost of entering the market, and the efficiency of the bankruptcy system. The highest is the best.
Source: Beck, et.al., 2004.
What these statistical figures imply is that in facing much slower world economy growth and less capital inflow (capital loss), ASEAN economies should seriously working for improving business environment (burden licensing investment regulations and heavy local taxes) through political stability and adopting good governance to attract new investment where MEs could taking large benefits, which in turn, could generate the dynamic new source of domestic economic growth. Finally we have to make important notes here, despite of MEs are largely domestic output market orientation (not directly involve in international trade), but they face global competition and liberalization from imported goods and, therefore MEs also facing steep competition from imported (traded goods) (Shilling, 2004)
THE POTENTIAL ROLE OF MEDIUM ENTERPRISES:
A. Case Study On Indonesia
According to Anderson (1982)3, over time, the number and contribution of MEs and LEs in economy will increase, while the number and contribution of micro and small enterprises are steadily decreased. This Anderson proposition could be interpreted, over time micro and small enterprises either out of market or making vertical mobility to higher firm ladder to become MEs layer.
The critical role of MEs, as well as SEs, are widely critical for two different reason: First, MEs are regarded as has long range strategic role for strengthening or snowballing the process of industrialization of LDCs, and Second, the role of MEs are widely seen primarily
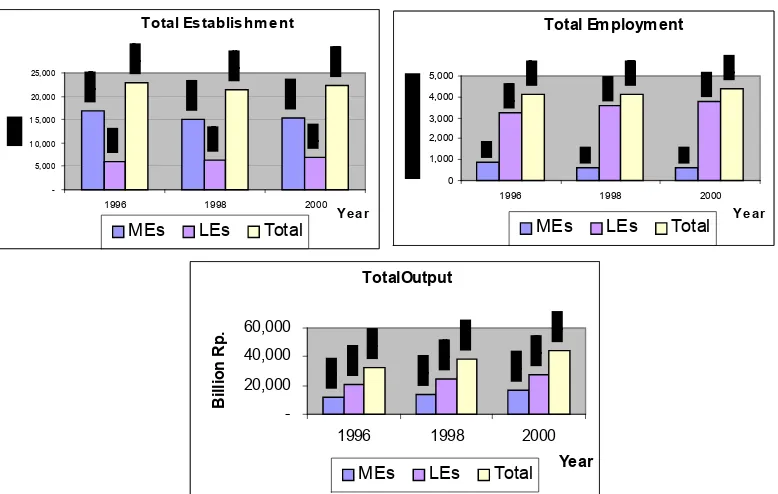
Table 5. Number of Firms Establishment and Assets According to Size of Employment
Size of Enterprises
Totally Establishment
(units)
Manufactures (units)
Output (billion rp)
Large 11,000 6,500 71,426
Medium 70,000 16,000 21,905
Small 640,000
/Micro/Cottage*) 19,000,000
2,600,000**) 8,706**)
*) Excluding agriculture which estimated of 20 million establishments.
**) Small and Micro Enterprises
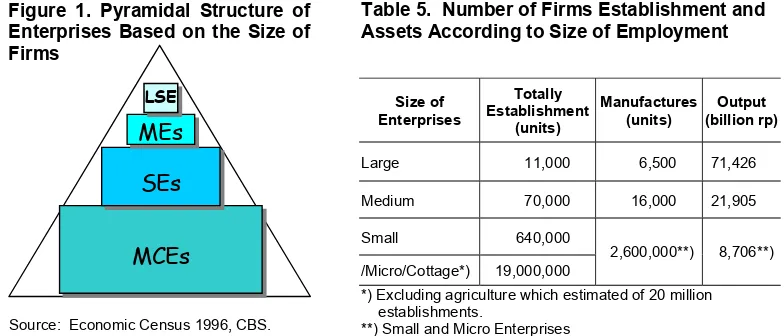
Figure 1. Pyramidal Structure of Enterprises Based on the Size of Firms
by political scientist (observers) as part of building democratic society through market creating “middle-income” segment of population. These small and medium enterprises would produce middle-income level population, where based on the premises the largest is the best would empower society from too much government interventions in the economy through democratic political process.
Apart from this critical political role of medium enterprises described above for increase our understanding further in industrial structure, the number of SMEs will be shortly presented in Figure 1 and Table 5. Notice, these medium enterprises are divided into two categories: number of total establishment of enterprises and number of manufactures.
Source: Economic Census 1996, CBS.
The Indonesian’s economic structure is essentially dominated by “grass-root economy” which consist of about 39 million of micro and small enterprises (MSEs) that self employed, which largely use family labor and widely known as informal sectors. Such industrial structure shows the vital role of small and micro enterprises. The micro enterprises (MCEs) is about 39 billion establishment and small enterprises (SEs) is only about 640.000 establishments. These SEs and MCEs altogether used almost 70% of industrial employment but their contribution to the value added is estimated only 30% (contribution to GDP). The industrial structures also show the medium enterprises (MEs) and especially large enterprises (LEs) that have relatively “thin” in numbers but reported contributed to almost 70% of value added in GDP growth. This industrial dualism actually confirms the missing of the middle phenomenon.
As shows in statistical figure in Table 5, the presence of missing of the middle can be confirmed by showing the number of establishment and the output produced by medium enterprises. The number of medium enterprises is 70,000 in total establishment or 16,500 establishments in manufacture. This number is regarded as very “thin layer”. Given the possibility and potentiality of SEs that could move to become MEs, that total MEs establishment should be larger than this figure indicates.
In Indonesian economic structure as shown in Figure 2, like other developed countries, the role of MEs is very significant. Figure 2 shows industrial sector is still as a major contributor to GDP growth. Furthermore, the incremental contribution of MEs in the industrial sector is larger than LEs. Based on this statistical figure, one can be concluded that MEs has strategic role in Indonesian economy.
MCEs
SEs
MEs
10
Figure 2. MEs Contribution on GDP (1996-1999)
Source: Economic Census 1996 and Yearly Industrial Survey 1999, CBS.
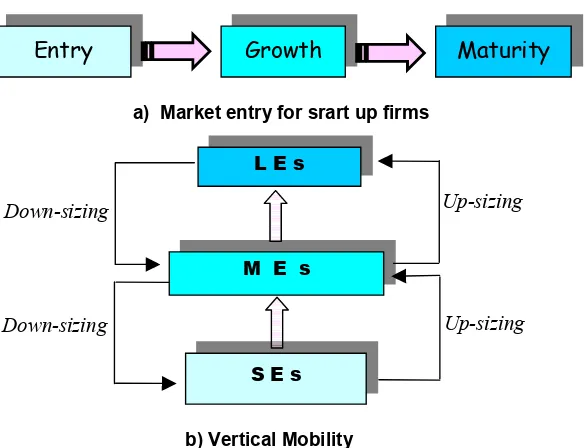
As we look at statistical figure of MEs and LEs as presented in Figure 3. It shows from employment creation point of view, it can be concluded that LEs can employ more labor than MEs. In term of output, however the incremental of MEs is higher than LEs output, except in the year of 1996/19977.
Figure 3. MEs and LEs Conditions
Source: Yearly Industrial Survey 1996-2000, CBS.
Some general conclusion on the role of MEs is follows: it is indeed playing a critical role in economic growth. Therefore, in order to strengthening MEs, Indonesian government should strongly make promotion effort by paying attention to improve business environment to various access regime, such as financial institutions, regulation, research, and human resources development.
B. The Great Vertical Immobility SEs To Become MEs
The research and analysis on MES, especially to investigate market entry barriers have never been undertaken in Indonesia. Most attention and studies focus on small and
Contributions on GDP (%) 1996
16,7 8,7
49,1
12,2
13,4 25,6
Agriculture Mining Others Manufacturing IM IB
Contributions on GDP (%) 1999
19,5 9,9
44,6
14,2
11,7 25,9
Agriculture Mining Others Manufacturing IM IB
Total Establishm ent
-5,000 1 0,000 1 5,000 20,000 25,000
1996 1998 2000
Y e a r
MEs LEs Total
Total Em ploym ent
0 1,000 2,000 3,000 4,000 5,000
1996 1998 2000
Y e a r
MEs LEs Total
TotalOutput
-20,000 40,000 60,000
1996 1998 2000
Year
Billion Rp.
large enterprises. The analytical framework for market entry barriers began by using the market competition requirements. The market entry barriers can be differentiated in to two types: (i) market entry barriers for start up firms, and (ii) vertical immobility faced by SEs.
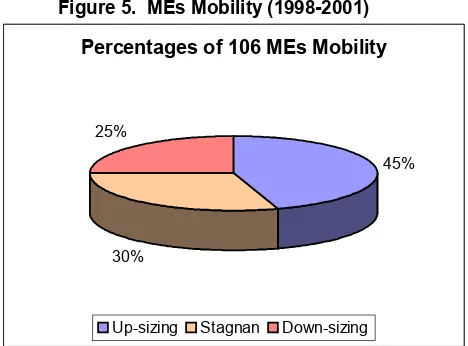
Figure 4. Start Up and Vertical Mobility of Enterprises
b) Vertical Mobility
For start up firms entering and industry, either in the perfect or imperfect market competition requires certain “transaction cost” for arranging such as business license, tax number and other regulatory requirements. Economic of scale through market and expansion or product differentiation is also regarded as significant barrier to entry. The analysis of transaction cost and economic of scale is, therefore, very important to know for any market barriers facing by firms. For vertical mobility firms, either for small and micro enterprises to enter MEs layer, factors limiting entry such as economic scale, capital accumulation, and technology capability are very often determine the possibility of vertical mobility. In this case, the size of market facing medium size firms may permit only a few efficient firms for making market entry.
Some firms in the marketplace may adopt “limit pricing strategy". Charging a price below that would result in profit maximization in order to discourage entrants (Nicholson. 1979)4. Alternative explanation is that, nothing wrong and it may for good reasons if firms decided not to move to the higher layer as long as firm maintaining their profitable position. From the perspective of creating healthy business environment, it is a great importance for reducing market and non-market barriers for making the market entry for either start up or through vertical mobility. One key factor is the minimum transaction cost and time to make entry. Very often, a firm stay in the same layer for long time may because the inability of entrants to differentiate products successfully. This product differentiation required high cost of capital and could become potential constraint. This analytical framework show how wide the problem should be taken, but this paper decided to limit its scope to discuss vertical immobility of SEs to become MEs
4
Walter Nicholson (1979). Intermediete Microeconomics, Second Ed., Dreyden Press, Illinois.
Entry
Growth
Maturity
a) Market entry for srart up firms
L E s
M E s
S E s Down-sizing
Down-sizing Up-sizing
12
C. The Findings On Vertical ImmobilityAccording to the result of 250 small business conference of FORDA Indonesia5, the general typical of problems facing by small firms either for not making profit for enlarging firms and products differentiation, that could result in vertical immobility, listed in orderly are: lack of capital, limited of knowledge and information of market, lack of technological knowledge to improve quality, government bureaucracy, skill and management (entrepreneurship) and availability of raw material at local level6.
According to the study of Levy (1991) there are constraint categories for hindering potential new entrants to join or to take part in the market place, namely: financial constraint, regulatory constraints, technical and marketing know-how, and non financial input constraints which eventually affecting cost. He further point out the first two problems is the most difficult problem to solve. For example, many LDCs struggling to improve the capability of financial institutions but it remain difficult to solve. The banking systems remain operating based on the collateral business and tend to operate conservatively and financially save. This financial reform, as long as Indonesia experiences, shows nothing much change.
In order to examine the possibility on how the stagnant7 of MEs layer or great immobility of SEs, the authors were decided to use of Indonesia number of establishment based on the selected years of economic census and annual industrial survey covering from 1985-2000. The result of data analysis is shown in Table 6. It shows there is indeed great immobility of SMEs to move to large size and this confirmed by looking at the total establishment figure that show relatively stable (not much changing) over time.
Table 6. Number or Enterprise Establishment (1985-2000)
Type 1985 1990 1996 2000
Large Enterprises 6.778 6.497
Medium Enterprises 12.909*) 16.498*) 16.919 15.377 (% MEs of SEs/CEs) n.a. n.a (0,58) (0,59) Small and Cottages
Enterprises 1.537.487 2.473.665 2.895.304 2.598.704
Source: Medium and Large Enterprises Census, CBS, (some years).
*) In 1985 and 1990 CBS publications the number of MEs was not separated from LEs. The separated figures in 1996 and 2000 can be afforded by analyzing raw data of the census.
Figures in Table 6 show there is an increasing of LEs and MEs establishment from the year of 1985 and 1990, but this may because of increasing number of LEs rather than MEs. This can be verified through data on number of establishment, from the period 1996 and 2000, which can be differentiated between LEs and MEs, where LEs increase by 12% while MEs establishment decrease by 20%.
Theoretically, vertical mobility constraints faced by SEs and MEs can be categorized to two: (1) structural constraints, and (2) business environment constraints. Structural constraints consist of: policy bias, high cost economy, wrong decision on industrial policy which heavily endorsed large scale industries and financial institutions bias in favor of LEs Business environment constraints can consists of: weak access to market and financial institutions, low technical ability of the entrepreneurs, small number of skilled labor, and non-conducive political law enforcement.
5
One of SMEs Associations in Indonesia that have almost 2,000 members.
6
See: Aji, 1999, Have SME Constituencies Truly Participated in Policy Making, Unpublished Paper Presented on Seminar on SMEs Development in Indonesia.
7
As comparison, the result of ADB/TA survey (2001)8 in Medan North Sumatera and Semarang Central Java shows same interesting result (Figure 5).
Figure 5. MEs Mobility (1998-2001)
It appears two major reasons for those MEs where experiencing of up-sizing firms, are: increasing in product demand and improving business partnership with other enterprises. However, the two major reason for MEs, which experiencing downsizing and facing serious problems, among other are: higher input price, economic crisis and instability of political and lack of law enforcement. Some economic factors may behind these facts, such as:
1) Economic crisis. When the Asia economic crisis hit Indonesian economy in 1997, many enterprises suffered from increasing cost and demand decreasing. Although the falling price of Indonesian rupiah to other currency be of advantage to many export orientated enterprises, many MEs are not able to capture the opportunities because facing overseas debt problem. According to our study there is only 2 % of MEs are able to export their products because suffered from the Asia economic crisis.
2) Downsizing in scale. Our findings show that MEs behavior is more closely to SEs rather than to LEs in various aspect, especially in: (a) their local market orientated, (b) widely used family labor, (c) the attitude not to rely on the formal banking financing activities, and (d) weak in the formal partnership (linkages) with LEs. So when economic crisis hit hard economy, large number of MEs down-sizing into SEs rather one-way around. Therefore, it is important to recommend and investigate further the “business environment” in term of transaction cost of doing business and regulatory burden faced by each layers of enterprises.
C. Market Entry Barriers
There is still limited data and information of MEs ready available. The following analysis was undertaken by using limited of manufacturing industries, as more or less, as proxies of MEs. From data analysis on MEs and LEs of manufacturing sector for year of 1996–2000, the dynamics changes of MEs could be measured in term of its labor utilization and changes in scale of firm. During economic crisis, as it turn out, there were 6,071 MEs reduced their labor utilization, and only 4,468 MEs increased their utilization of labor (see the details in Figure 6).
8
Conducted by AC Nielsen Indonesia for ADB-TA, 2001. Medan and Semarang was two of biggest cities and business cities in Indonesia. This Nielsen Survey was essentially designed to identify the problem of business environment, market access to capital and credit, government policy and regulations. The definition of MEs in this research should be treated as sample drawn within the top-part and bottom-part of MEs.
Percentages of 106 MEs Mobility
45%
30% 25%
14
What is interesting point here that one should examine here is the employment creation. During economic crisis, dynamic changing in term of employment creation is below of before and during economic recovery. During economic crisis and economic recovery, the stagnant (relatively stay put) condition is higher than during economic recovery. There is no much conclusion can be made from this data in Figure 6. In order to examine this problem further, there is a need to further examine the number of MEs according the layering based size of firms.Figure 6. Changes in Number of Worker Used
During economic recovery (1999–2000), the number of MEs increased labor used was found in 9,500 MEs, but at the same time about 5,300 MEs reduced labor utilization. What interesting explanation from Figure 7, is about the dynamics of MEs in term of firm size changes.
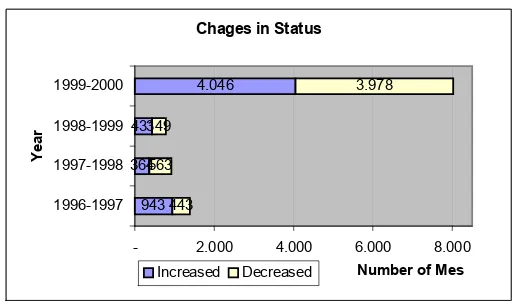
Figure 7. Changes in Status
Figure 7 shows during economic recovery (1999-2000) large number of MEs, which change its size of firm status. However, up to present time there is no much information available to explain what happened and therefore there is a need to further study over what is major reason for this status size firm changing. If we inspect again statistics in Figure 7, we can conclude despite of status size firm changing but the total change is relatively small. This confirm, there is hollow of the middle is maintained even though in the economic crisis time.
Further examination, it may useful to breakdown MEs according product market orientation, that is domestic vs. export market, and domestic produce input vs. import. For
Changes in Number of Worker
7.780 4.466
4.883 9.522
4.540 6.071 4.327
5.362
2.463 2.907 4.807
500
- 2.500 5.000 7.500 10.000 12.500 15.000
1996-1997 1997-1998 1998-1999 1999-2000
Year
Number of MEs Establishment
Increased Labor Used Decreased Labor Used No Change in Labor Used
Chages in Status
943 364 431
4.046
443 563 349
3.978
- 2.000 4.000 6.000 8.000
1996-1997 1997-1998 1998-1999 1999-2000
Year
Number of Mes
MEs, where domestically produced input may have take large advantages from rupiah depreciation, while MEs, which imported input, suffered from increased cost due to the appreciation of foreign currencies.
D. Problems On Networking
Analysisi on source of growth of MEs showed interesting results. One of the interesting result is most of SMEs are posses production coefficient of increasing return to scale with elasticity coefficient is bigger than 1.0. This implies, that based on this TFP model for examining the source of growth analysis for SMEs, shows a strong possibility for sizing-up its scale. One interpretation of this is that, if a country would promote SMEs it should be done through improving TFP rather than focused on technology factor alone. The greater and wider implication of this conclusion, related to the vertical mobility of SMEs, is that this result reinforces argument that SEs actually have potential source of growth to become MEs, provided that there is a healthy business environment created in each country or region.
However, many researchs conclusions either in developed or developing countries showed that clustering and networking would helps small- and medium-sized enterprises (SMEs) to raise their competitiveness. The European experience even suggested that local and regional government can play an important role, particularly where it cooperates with private sector organizations for fostering clustering and networking between SMEs. A strong networking between MEs in every ASEAN countries will be strengthening the role of MEs as new workhouse for economic development.
SOME CONCLUSIONS
There is no doubt that medium enterprises play a critical role as a new sorce for economic growth, especially in ASEAN countries. This paper, still empirically sketchy, but it permitted us to make a list of some finding on promoting MEs development in ASEAN countries:
(1) there is a significant contribution of MEs in the economic growth for each counties being analyzed,
(2) tend to labor intensive firms, and
(3) mostly MEs have capability to use "market niche" product development.
However MEs also face some serious problems that should be overcome to increase its rele in development, they are:
(1) most MEs are local resource based industries and this is the reason why may have play an important role in the "industrial safety-net" during economic crisis,
(2) ASEAN should build-up a MEs strong business network such as business association, cooperative, and also market information network, and
16
REFERENCES
Anderson, A,D, 1982, Small Industry in Developing Countries: A Discussion of Issues, World Development, 10 Novempber 1982.
______________, 1997, Indonesia’s Industrisal Transformations, Institute of South East Asian Studies, Singapore.
______________, 1996, Economic Cencus 1996, CBS, Jakarta.
______________, 1996-2000, Industrial Cencus 1996-2000, CBS, Jakarta.
Baud, I.S.A. and G.A. de De Bruijne, 1993, Gender, Small-scale Industry and Development Policy, Intermediate Technology Publications, London, UK.
Central Bureau of Statistic, 1980-2000, Indonesia Statistics 1980, CBS, Jakarta.
Claessens, S. et.al., 2000, Corporate Risk around the World, Policy Research Working Paper, World Bank, Washington D.C., USA.
Giaoutzi, M. et.al., ed., 1989, Small and Medium Size Enterprises and Regional Development, Routledge, London, UK.
Hill, Hal., 1988, Foreign Investment aand Industrialization in Indonesia, Oxford University Press, Singapore.
Ho, Sam P.S., 1980, Small-scale Enterprises in Korea and Taiwan, Staff Working Paper No. 384, World Bank, Washingkton D.C., USA.
Kang, Moon-Soo, 2001, Bank Loans to Microenterprises, SMEs and Poor Household in Korea: Country Study of the Republic of Korea, Paper for EASCAP-ADB Joint Workshop on Mobilizing Domestic Finance for Development, Bangkok, Thailand.
Levy, Brian, 1991, Obstacles to Developing Small and Medium-Sized Enterprises – An Emperical Assesment, World Bank Working Paper No. 588, World Bank, Washingkton D.C., USA.
Levy, Brian, 1996, South Africa- The Business Environment for Industrial Small and Medium Enterprises, Informal Discussion Paper No. 11, World Bank, Washingkton D.C., USA.
Shepherd, W.G., 1985, The Economics of Industrial Organizations 2nd Edition, Prentice-Hall International Editions, New Jersey, USA.
Shilling, J. D., 2004, Summary Report : Strengthening the Domestic Base for Participating the Global Economy in the 21st Century, in Indonesia. UNTACD.
Stewart-Smith, M.C., 1995, Industrial Structure and Regulation, Policy Research Working Paper No. 1491, World Bank, Washingkton D.C., USA.
Tambunan, M., (1999). Strategy and Policy for Overcoming SMEs Obstacles and Constraint n Indonesia. Unpublished Paper Presented in Seminar on Small Medium Enterprise Development in Indonesia, Jakarta.
Tambunan, M., dan Ubaidillah. 2001. “Prospek Perdagangan Dalam Negeri dalam Era Desentralisasi dan Dampaknya atas Pembangunan Ekonomi Daerah”. Makalah konferensi: Globalisasi, Perdagangan Domestik dan Desentralisasi, Hotel Borobudur Jakarta 3 April 2001.