Environmental impacts of large-scale oil palm enterprises
exceed that of smallholdings in Indonesia
Janice Ser Huay Lee1, Sinan Abood1, Jaboury Ghazoul1, Baba Barus2, Krystof Obidzinski3, & Lian Pin Koh1
1Department of Environmental Systems Science, ETH Z ¨urich, CHN G 73.1, Universit ¨atstrasse 16 CH-8092, Z ¨urich, Switzerland
2Center for Regional System Analysis, Planning and Development, Bogor Agricultural University, Jalan Raya Pajajaran, Baranangsiang, Bogor 16153,
Indonesia
3Center for International Forestry Research, Jalan CIFOR, Situ Gede, Bogor Barat 16115, Indonesia
Keywords
Elaeis guineensis; deforestation; carbon emissions; tree crop; farmer; agri-business; tropics.
Correspondence
Janice Ser Huay Lee, ETH Z ¨urich, ITES–Ecosystem Management, CHN H71, Universitaetsstrasse 16, 8092 Z ¨urich, Switzerland. Tel:+41-44-632-7559; fax:+41-44-632-1575.
E-mail: [email protected]
Received 18 February 2013 Accepted 16 May 2013
EditorJoern Fischer
doi: 10.1111/conl.12039
Abstract
The expansion of large-scale oil palm plantations in Indonesia has taken a heavy toll on forests, biodiversity, and carbon stocks but little is known about the environmental impacts from the smallholder sector. Here, we compare the magnitude of forest and carbon loss attributable to smallholdings, private enterprises, and state-owned oil palm plantations in Sumatra. During 2000– 2010, oil palm development accounted for the loss of 4,744 ha of mangrove, 383,518 ha of peat swamp forest, 289, 406 ha of lowland forest, and 1,000 ha of lower montane forest. Much of this deforestation was driven by private en-terprises (88.3%) followed by smallholdings (10.7%) and state-owned planta-tions (0.9%). Oil palm-driven deforestation in Sumatra resulted in 756–1,043 Mt of total gross carbon dioxide emissions, of which∼90% and∼9% can be attributed to private enterprises and smallholdings, respectively. While private enterprises are responsible for the bulk of environmental impacts, the small-holder oil palm sector exhibits higher annual rates of expansion (11%) com-pared to private enterprises (5%). Both sectors will need careful monitoring and engagement to develop successful strategies for mitigating future environ-mental impacts of oil palm expansion.
Introduction
Rising global demand for food, better nutrition, and crop-based alternatives to fossil fuel are rapidly transforming natural landscapes, leading to agricultural intensification and expansion (Gibbs et al.2010; Foley et al.2011). In the tropics, where several key agricultural commodities are produced, industrial-scale agricultural development has contributed to deforestation (Morton et al. 2006; Butler & Laurance 2008; Hansenet al. 2009), biodiver-sity loss (Fitzherbertet al.2008; Koh & Wilcove 2008), and greenhouse gas emissions (Nepstadet al.2008; Koh
et al. 2011). A case in point is Indonesia, where oil palm agriculture expanded from∼100,000 ha in 1967 to
∼8.4 million ha in 2010 (8,300%; Indonesian Ministry of Agriculture 2011). While this has led to Indonesia being the world’s top palm oil producer and exporter (World Bank 2011), it has also led to widespread conversion of
lowland forests and peat swamp forests (Miettinenet al.
2012; Carlsonet al.2013).
Based on 2012 figures from the Indonesian Ministry of Agriculture, Sumatra accounts for approximately 67% of Indonesia’s total planted oil palm area (9.2 million ha), and 74% of its national crude palm oil production (23.6 million tons) (Indonesian Ministry of Agriculture 2011). Over the last three decades, expansion of oil palm plantations in Southeast Asia has taken a huge toll on the environment and led to significant impacts on forest cover, biodiversity, and carbon emissions (World Wildlife Fund [WWF] Indonesia 2010; Azharet al.2011; Margono
Caroko et al. 2011). Smallholder oil palm plantations, hereafter also known as smallholdings, are on average 2 ha in size but can range up to 50 ha in Indonesia (Ver-meulen & Goad 2006; World Bank 2010). Oil palm small-holdings can be managed either independently by the farmer (independent smallholders) or in association with an oil palm company (scheme smallholders) where farm-ers receive technical assistance and agricultural inputs for their plantations (Vermeulen & Goad 2006). Whereas the environmental impacts of large-scale plantations have been well documented (Carlson et al. 2012; Miettinen
et al. 2012; Obidzinski et al. 2012; Carlson et al. 2013), relatively little is known about the impacts of oil palm smallholdings in Indonesia [but see Uryuet al.(2008)].
According to the Indonesian Ministry of Agricul-ture, Indonesia’s smallholder oil palm sector grew from 1,166,758 ha to 3,387,257 ha (190%) over the last decade, surpassing state-owned plantations (588,125– 631,520 ha; 7%) and private enterprises (2,403,194– 4,366,617 ha; 82%) (Indonesian Ministry of Agriculture 2002, 2011). Smallholder expansion had been concen-trated in Sumatra, increasing from∼891,000 ha in 2000 to∼2.7 million ha in 2010 (207%). In comparison, pri-vate enterprises increased by 68% from∼1.4 million ha in 2000 to∼2.4 million ha in 2010 (Indonesian Ministry of Agriculture 2002, 2011). As large contiguous land be-comes increasingly scarce in Sumatra, the rapid pace of smallholder oil palm expansion may suggest an increas-ingly important contribution to future land cover changes through small to medium size land conversion.
Here, we investigate the historical impacts of Indone-sia’s smallholder oil palm on the environment. Specif-ically, by performing a land cover change analysis we quantify forest loss and associated carbon emissions at-tributable to smallholder oil palm development in Suma-tra between 2000 and 2010. We also compare these en-vironmental impacts among three main oil palm sectors on the island: smallholders, private enterprises, and state-owned plantations.
Methods
Land cover maps
We extracted land cover data for Sumatra at two time periods (2000 and 2010) from 250 m × 250 m spa-tial resolution land cover classification maps (Miettinen
et al.2011). These maps were produced based on Mod-erate Resolution Imaging Spectroradiometer images and Daichi-Advanced Land Observing Satellite data. The overall accuracy of the land cover maps reported by Miettinen et al. (2011) is 85.3%. The land cover map for 2000 comprises 12 classes of land cover (including
water, mangrove, peat swamp forest, lowland forest, lower montane forest, upper montane forest, planta-tion/regrowth, lowland mosaic, montane mosaic, low-land open, montane open, urban); the map for 2010 in-cludes an additional class for large-scale palm plantation (Miettinenet al.2011; see Supporting Information for de-scription of each land cover class).
Oil palm sectorial boundaries
We obtained sectorial boundaries of oil palm planta-tions in Sumatra from Greenpeace and the Center for Regional Systems Analysis, Planning and Development (Pusat Pengkajian Perencanaan dan Pengembangan Wilayah, P4W). These sectorial boundaries were provided in the form of vector layers within a geographic information systems framework, in which individual polygons repre-sent the boundaries of smallholdings, private enterprises, and state-owned plantations. We treat these data sets as the two best available data sources on sectorial bound-aries of the oil palm industry in Indonesia (see Supporting Information for more details on data sets).
We merged the Greenpeace and P4W data sets to ob-tain a combined vector layer for each of the three oil palm sectors. We identified areas of overlap between lay-ers (298,760 ha), and excluded them from subsequent analyses since we were unable to ascertain their secto-rial ownership. Furthermore, we also excluded areas of overlap between oil palm plantations and industrial tim-ber plantation concessions or Hutan Tananman Industri
(920,212 ha), which we obtained from the Indonesian Atlas (Minnemeyeret al.2009) and the Indonesian Min-istry of Forestry (Indonesian MinMin-istry of Forestry 2011) (Supporting Information). The resultant total areas of private enterprise, state-owned, and smallholdings were 4,556,600, 511,647, and 798,815 ha, respectively. Since our data represent mostly scheme smallholders and inde-pendent smallholders with>25 ha plantations, we were
not able to capture smaller plantations (<25 ha) owned
by many unregistered independent smallholders. Hence, we acknowledge here that the results from our land cover analysis from oil palm smallholdings are conservative.
Land cover change analysis
change analysis tabulates land cover between the two time periods, and calculates net transitions between dif-ferent categories of land cover. Since we are mainly inter-ested in assessing the environmental impacts of different oil palm sectors, we focused our analysis on forest habitat changes within sectorial boundaries between 2000 and 2010. These habitats are represented by the land cover classes of mangrove, peat swamp forest, lowland forest (<750 m above sea level or a.s.l.) and lower montane
forest (750–1500 m a.s.l.).
We quantified forest cover loss instead of forest con-version into large-scale palm plantations to represent the environmental impacts, which occurred within our oil palm sectorial boundaries. The large-scale palm planta-tion land cover class described by Miettinenet al.(2011) captured only contiguous (>2 km2) and mature oil palm
(>8 years) plantations. Therefore, quantifying only
for-est conversion into large-scale palm plantations might underestimate recent forest cover transitions to imma-ture oil palm (<8 years), which are classified under
low-land open, lowlow-land mosaic, and plantation/regrowth low-land cover classes (J. Miettinen, personal communication). Hence, we assume here that all deforestation within the oil palm sectorial boundaries is related to land transi-tions toward oil palm plantatransi-tions. The geospatial data on oil palm sectorial boundaries and land cover change are available upon request from the authors.
Estimating gross carbon dioxide emissions from forest loss
We calculated gross carbon dioxide emissions resulting from the loss of biomass carbon stocks in mangrove, peat swamp forests, lowland forests, and lower montane forests within each oil palm sectorial boundary from 2000 to 2010. As illegal burning of land prior to oil palm cul-tivation is a common practice in Sumatra (Suyantoet al.
2004; Uryuet al.2008), we calculated carbon emissions for scenarios either with or without burning for land clearance (Germer & Sauerborn 2008; Uryuet al.2008; Carlsonet al.2013) (see Supporting Information for more details).
Results
Forest loss within oil palm sectorial boundaries
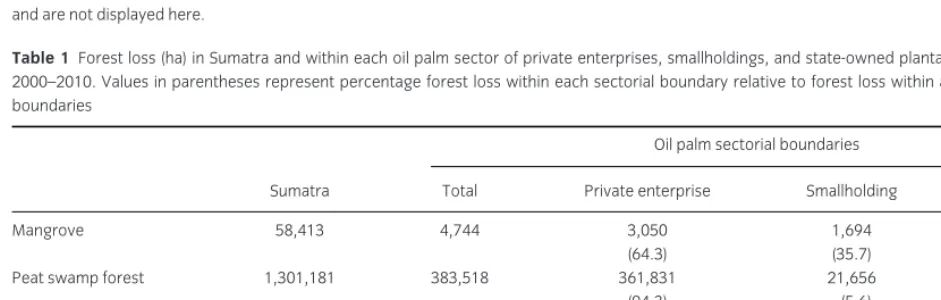
Between 2000 and 2010, Sumatra lost 3,508,938 ha of forest habitats (mangrove, peat swamp forest, lowland forest, and lower montane forest), of which 19.3% oc-curred within oil palm sectorial boundaries (Figure 1). Oil palm development was responsible for the loss of 4,744 ha of mangrove, 383,518 ha of peat swamp
for-est, 289,406 ha of lowland forfor-est, and 1,000 ha of lower montane forest (Table 1). A large proportion of this de-forestation within the oil palm sector was caused by pri-vate enterprises (599,281 ha; 88.3%) followed by small-holders (72,725 ha; 10.7%) and state-owned plantations (6,662 ha; 0.9%) (Table 1). Private enterprises developed more on peat swamp forests (361,831 ha; 60.4%) than lowland forests (234,250 ha; 39.1%), while smallholders converted more lowland forests (48,525 ha; 66.7%) than peat swamp forests (21,656 ha; 29.8%). Peat swamp for-est loss within private enterprises was 16.7 times higher than that in smallholdings (361,831 ha vs. 21,656 ha), and lowland forest loss within private enterprises was 4.8 times higher than that in smallholdings (234,250 ha vs. 48,525 ha) (Table 1). Only a small percentage of total de-forestation from oil palm development occurred in pro-tected areas (6,412 ha; 0.94%).
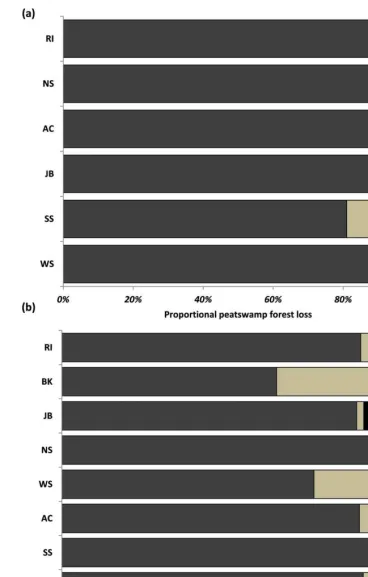
The highest levels of deforestation within oil palm sec-torial boundaries occurred in Riau, which accounted for 70% (266,212 ha) of peat swamp forest loss and 52% (148,987 ha) of lowland forest loss. Private enterprises were the main causes of deforestation across provinces, accounting for at least 80% of peat swamp forest loss and at least 60% of lowland forest loss in each province (Figure 2). Smallholder oil palm activity accounted for relatively higher levels of peat swamp deforestation in South Sumatra (3,362 ha; 19%), and lowland deforesta-tion in Bengkulu (10,475 ha; 39%) and West Sumatra (6,750 ha; 28%) (Figure 2). State-owned plantations ac-counted for relatively higher levels of lowland deforesta-tion in Jambi (3,637 ha; 14%) and North Sumatra (1,962 ha; 8%) but close to zero levels of peat swamp deforesta-tion across all provinces (Figure 2).
The largest land cover converted within both private enterprise and smallholder oil palm sectorial boundaries came from the lowland mosaic land cover class, which consisted of small plantations, agricultural fields, and fragmented forest patches (Miettinenet al.2011). Within private enterprises, lowland mosaic loss was more than 4.4 times higher than that in smallholdings (460,824 ha vs. 104,575 ha). However, the proportion of lowland mo-saic loss accounted for a higher proportion of total land cover losses within smallholdings (59%) compared to pri-vate enterprises (43%).
Figure 1 Forest loss (mangrove, peat swamp forest, lowland forest) within oil palm sectorial boundaries (smallholder, state-owned, private enterprise) in Sumatra from 2000 to 2010. The area of lower montane forest losses are small (1,000 ha) compared to other natural habitat losses (up to 380,000 ha) and are not displayed here.
Table 1 Forest loss (ha) in Sumatra and within each oil palm sector of private enterprises, smallholdings, and state-owned plantations for the period 2000–2010. Values in parentheses represent percentage forest loss within each sectorial boundary relative to forest loss within all oil palm sectorial boundaries
Oil palm sectorial boundaries
Sumatra Total Private enterprise Smallholding State-owned
Mangrove 58,413 4,744 3,050 1,694 –
(64.3) (35.7)
Peat swamp forest 1,301,181 383,518 361,831 21,656 31
(94.3) (5.6) (<0.1)
Lowland forest 1,999,931 289,406 234,250 48,525 6,631
(80.9) (16.8) (2.3)
Lower montane forest 149,413 1,000 150 850 –
(15.0) (85.0)
Total 3,508,938 678,668 599,283 72,725 6,662
(88.3) (10.7) (1.0)
Gross carbon dioxide emissions from forest loss
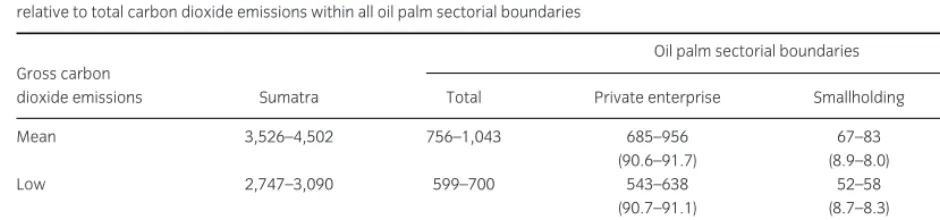
Between 2000 and 2010, deforestation in Sumatra re-sulted in an estimated 3,526–4,502 Mt of mean gross car-bon dioxide emissions, of which 21–23% (756–1,043 Mt)
Table 2 Mean, low, and high estimates of gross carbon dioxide emissions in megatonne (Mt) from deforestation in Sumatra and within each oil palm sectorial boundary of private enterprises, smallholdings, and state-owned plantations for the period 2000–2010 (range of numbers indicates scenarios without and with burning for land clearance). Values in parentheses represent percentage carbon dioxide emissions within each sectorial boundary relative to total carbon dioxide emissions within all oil palm sectorial boundaries
Oil palm sectorial boundaries Gross carbon
dioxide emissions Sumatra Total Private enterprise Smallholding State-owned
Mean 3,526–4,502 756–1,043 685–956 67–83 4.19–4.21
(90.6–91.7) (8.9–8.0) (0.6–0.4)
Low 2,747–3,090 599–700 543–638 52–58 3.49–3.50
(90.7–91.1) (8.7–8.3) (0.6–0.5)
High 4,387–6,231 919–1,462 830–1,342 84–115 4.89–4.93
(90.3–91.8) (9.1–7.9) (0.5–0.3)
75–82%), with peat land burning accounting for 51% more carbon dioxide emissions compared to a scenario with no peat land burning. This was followed by the loss of lowland forests (180 Mt; 17–24%), mangroves (9 Mt; 0.9–1.3%), and lower montane forests (1.6 Mt; 0.16– 0.22%). Of the total amount of carbon dioxide emissions released by the oil palm industry, 70–77% was a result of peat swamp forest loss within private enterprises.
An overwhelmingly large proportion of carbon dioxide emissions can be attributed to the private enterprise oil palm sector (685–956 Mt; 90–91%), followed by smallholders (67–83 Mt; 9–8%) and state-owned plan-tations (4.18–4.21 Mt; 0.5–0.4%). Under the scenario of burning for land clearing, gross carbon dioxide emissions increased by 40% for private enterprises and 24% for smallholders. Carbon dioxide emissions from private enterprises were∼10 times greater than that from small-holders, reflecting the magnitude of peat swamp defor-estation by private enterprises (361,831 ha) compared to smallholders (21,656 ha).
Discussion
Forest clearing activities by smallholders in Indonesia were more prominent up to the 1990s where transmi-gration programs and smallholder tree crop development projects facilitated forest access to both local and migrant smallholders (Holmes 2000; Rudelet al.2009). After the 1990s, private agricultural enterprises led most of trop-ical deforestation due to increased demand for agricul-tural commodities on the global market (Margonoet al.
2012). As shown from our study on the oil palm sector, the impact of private enterprises on tropical deforestation in Indonesia continues to outweigh that of smallholders. Rather than clearing new land, smallholder oil palm ex-pansion could have occurred over other forms of agri-culture, such as rubber plantations, rattan gardens, and
rice fields, all of which have been demonstrated to be less profitable for farmers in the short term compared to oil palm (Belcheret al.2005; Feintrenieet al.2010). In-deed as indicated by our results, lowland mosaic losses ac-counted for a higher proportion of total land cover losses within oil palm smallholdings as compared to private en-terprises. Previous research also show that forested lands are favored by oil palm private enterprises due to tim-ber revenues which help offset the costs of establishing a large-scale oil palm plantation (Casson 2000).
Between 2000 and 2010, Margonoet al. (2012) iden-tified oil palm and industrial timber plantation expan-sion as primary driving forces and transmigration activi-ties and fires as secondary driving forces of forest cover loss in Sumatra. We show here that within the same timeframe,∼20% of forest loss occurred within oil palm sectorial boundaries. While the smallholder oil palm sec-tor expanded faster than private enterprises in Sumatra (207% compared to 68%) between 2000 and 2010, the environmental impacts derived from the smallholder oil palm sector were lower compared to private enterprises. In terms of total forest losses in Sumatra, oil palm small-holdings accounted for 2.1%, while private enterprises accounted for 17.1% or eight times the impact relative to smallholders. State-owned plantations accounted for minimal deforestation (<1%) since recent expansion of
Sumatra’s oil palm industry was driven largely by pri-vate enterprises and smallholders. This is not the first study that has looked into the environmental impacts of oil palm private enterprises and smallholdings. Uryuet al.
(2008) looked into deforestation rates in Riau from 1982 to 2007 and reported higher deforestation from oil palm private enterprises (28.7%) than oil palm smallholdings (7.2%).
be related to higher establishment costs of developing oil palm on peat compared to mineral soils and lower competition for land use rights in peat swamp forests. The profitability of oil palm over peat is 35% lower than on mineral soils due to larger establishment costs from draining peat swamps and higher labor requirements (Budidarsono et al. 2012). Without the capital and expertise on establishing oil palm over peat, smallholders may avoid peatland areas unless they are associated with an oil palm company and receive financial and technical assistance. However, in some instances, peatlands are the only lands available to independent smallholders, and are cultivated without proper drainage and plantation man-agement (J.S.H. Lee, personal observation). Population densities around peat swamp forests tend to be lower due to the difficulties involved in developing peat swamp forests for communal agriculture [but see Chokkalingam
et al.(2007) for exceptions]. This has, therefore, led to large areas of peat swamp forests being allocated by the government for large-scale oil palm development, especially in the province of Riau (Anderson & Bowen 2000; Margonoet al.2012). Avoiding disputes with local communities over land tenure rights has been cited as an important consideration for private enterprise invest-ment in Indonesia (Elson 2009) as well as industrial oil palm development in Peru (Guti ´errez-V ´elezet al.2011).
The pressure is mounting on the oil palm industry in Indonesia to lower carbon dioxide emissions as Indone-sia strives to achieve 26% reductions in national carbon dioxide emissions by 2020 (Simamora 2010), and as de-veloped nations consider the potential of palm oil as a substitute fuel (Gilbert 2012). Associated with the level of deforestation, our results indicate that 70–77% of gross carbon dioxide emissions from 2000 to 2010 released by the oil palm industry in Sumatra occurred through the conversion of peat swamp forests within private enter-prises. Carlson et al.(2013) showed increasing oil palm development over peatlands in Kalimantan from 1990 to 2010 but demonstrated that 61–73% of carbon emissions from oil palm development came from forest conversion on mineral soils. Considering that oil palm plantations on Sumatra and Kalimantan account for>95% of
Indone-sia’s total oil palm planted area (Indonesian Ministry of Agriculture 2011), mitigating carbon emissions from In-donesia’s oil palm industry requires engagement with oil palm private enterprises to address the bulk of carbon dioxide emissions from oil palm development.
Halting the expansion of oil palm private enterprises over peat swamp forests and lowland forests is a crucial first step to mitigate carbon dioxide emissions from Indonesia’s oil palm industry. Currently, there are more economic incentives for provincial and district
level authorities to allocate forested lands rather than nonforested lands to private enterprises for oil palm plantation establishment (Irawan et al. 2013). These incentives are in the form of timber revenues that are institutionalized in various taxes and fees related to logging in the allocated concessions. Instead of distribut-ing the economic returns from oil palm development through extractive land uses, the Indonesian government could consider restructuring the distribution of revenues from oil palm development based on crude palm oil production. Beneficial policies such as tax reductions or subsidies to oil palm producers could also be provided when oil palm is developed over nonforested lands such asImperatagrasslands. Such policy adjustments can help spur provincial and district level authorities to prioritize improving oil palm agricultural yields and diverting oil palm expansion away from forested lands.
Understanding the relative contributions to deforesta-tion from various sectors of the oil palm industry en-ables the development of appropriate strategies for re-ducing conversion of Indonesia’s forests into oil palm. In Sumatra, private enterprises show the largest envi-ronmental impacts within the oil palm industry although higher growth has been reported within the smallholder oil palm sector. Targeting oil palm private enterprises through publicity campaigns and market incentives is un-doubtedly an easier task than influencing thousands of oil palm smallholders to reduce forest conversion to oil palm (Butler & Laurance 2008). Such efforts have already pres-sured some of the biggest oil palm producers to account for deforestation activities within their allocated conces-sions (Khor 2011) and consumer firms to be more proac-tive in reducing environmental impacts from their supply chains (Tabacek 2010). Within Sumatra’s smallholder oil palm sector, it is also important to distinguish environ-mental impacts derived from smallholders of varying so-cioeconomic backgrounds. Based on field experiences in South Sumatra, the lead author observed large parcels of agroforests cleared and transformed into oil palm plan-tations by wealthy transmigrant oil palm smallholders. While private enterprises represent the bulk of the last decade’s forest loss from the oil palm industry, we need to also anticipate future agents of land cover change es-pecially within a forest landscape like Sumatra that is in-creasingly fragmented and accessible to smallholder agri-cultural conversion.
by independent smallholdings, which were<25 ha.
Al-though we show that oil palm smallholders are responsi-ble for less deforestation than private enterprises, our es-timates are conservative and require further investigation especially since annual expansion rates of the smallholder oil palm sector is higher (11%) than that of private enter-prises (5%) (Indonesian Palm Oil Council 2010). Given the smallholder oil palm sector is expected to expand (Bahroeny 2009; McCarthy 2010) and that smallholder tree crops have in the past contributed significantly to Indonesia’s deforestation (Tomich & van Noorwijk 1995; Holmes 2000), we recommend careful monitoring and engagement with both oil palm smallholders and private enterprises to manage the environmental impacts derived from oil palm expansion in Indonesia.
Acknowledgments
We thank S. Webster for data on oil palm concessions in Indonesia, J. Miettinen for assistance on the interpreta-tion of land cover maps, and K. Carlson for comments on the manuscript and assistance on carbon emissions calcu-lations. We thank Z. Burivalova, J. Garcia-Ulloa, and four anonymous reviewers for helpful comments. J.S.H.L. and L.P.K. are supported by the Swiss National Science Foundation.
Supporting Information
Additional Supporting information may be found in the online version of this article at the publisher’s web site:
Table S1.Distribution of land cover classes within dif-ferent oil palm sectorial boundaries in 2010. Figures un-der Total Area (raster) are slightly higher that Total Area (vector) as a result of a vector to raster conversion.
Table S2. Carbon content values for above- and below-ground biomass for different land cover classes. Values in parentheses represent a 60% biomass loss when forest classes have been logged and/or degraded and were used in calculating gross carbon emissions from forest cover losses.
Table S3.Peat soil carbon estimates used to calculate carbon emissions from peat burning and peat oxidation.
Figure S1.Land cover class large-scale palm planta-tion which lie outside the oil palm sectorial boundaries are largely located along the North East (Inset A) and Central East side (Inset B) of Sumatra. They fall within the administrative districts of Asahan, Labuhan Batu, and Simalungan in North Sumatra, Indragiri Hilir from Riau, and Tanjung Jabung Barat and Tanjung Jabung Timur from Jambi.
References
Anderson, I.P. & Bowen, M.R. (2000)Fire zones and the threat to the wetlands of Sumatra, Indonesia. Forest Fire Prevention and Control Project, Jakarta.
Azhar, B., Lindenmayer, D.B. & Wood, J.,et al.(2011) The conservation value of oil palm plantation estates, smallholdings and logged peat swamp forest for birds.For. Ecol. Manage.,262, 2306-2315.
Bahroeny, J. (2009) Palm oil as an economic pillar of Indonesia. The Jakarta Post. http://www.thejakartapost. com/news/2009/12/02/palm-oil-economic-pillar-indonesia.html (visited Nov. 30, 2012).
Belcher, B., Rujehan, Imang, N. & Achdiawan, R. (2005) Rattan, rubber or oil palm: cultural and financial considerations for farmers in Kalimantan.Econ. Bot.,58, S77-S87.
Budidarsono, S., Rahmanulloh, A. & Sofiyuddin, M. (2012) Economics assessment of palm oil production. World
Agroforestry Centre–ICRAF SEA Regional Office, Bogor, Indonesia.
Butler, R.A. & Laurance, W.F. (2008) New strategies for conserving tropical forests.Trends. Ecol. Evol.,23, 469-472.
Carlson, K.M., Curran, L.M., Asner, G.P., Pittman, A.M., Trigg, S.N. & Marion Adeney, J. (2013) Carbon emissions from forest conversion by Kalimantan oil palm plantations. Nat. Clim. Ch.,3, 283-287.
Carlson, K.M., Curran, L.M., Ratnasari, D.,et al.(2012) Committed carbon emissions, deforestation, and community land conversion from oil palm plantation expansion in West Kalimantan, Indonesia.PNAS,109, 7559-7564.
Caroko, W., Komarudin, H., Obidzinski, K. & Gunarso, P. (2011)Policy and institutional frameworks for the development of palm oil-based biodiesel in Indonesia. CIFOR, Bogor, Indonesia.
Casson, A. (2000)The hesitant boom: Indonesia’s oil palm sub-sector in an era of economic crisis and political change. Center for International Forestry Research, Bogor, Indonesia. Chokkalingam, U., Suyanto, Permana, R.,et al.(2007)
Community fire use, resource change, and livelihood impacts: The downward spiral in the wetlands of southern Sumatra.Mitig. Adapt. Strateg. Glob. Change,12, 75-100. Elson, D. (2009)Palm oil business models for land use and
development planning in indonesia. Prepared for the Indonesian National Development Planning Agency (BAPPENAS) as part of a project supported by UK Department for International Development. Feintrenie, L., Chong, W. & Levang, P. (2010) Why do
farmers prefer oil palm? Lessons learnt from Bungo District, Indonesia.Small-Scale Forestry,9, 379-396. Fitzherbert, E.B., Struebig, M.J., Morel, A.,et al.(2008) How
Foley, J.A., Ramankutty, N., Brauman, K.A.,et al.(2011) Solutions for a cultivated planet.Nature,478, 337-342. Germer, J. & Sauerborn, J. (2008) Estimation of the impact of
oil palm plantation establishment on greenhouse gas balance.Environ. Dev. Sustain.,10, 697-716.
Gibbs, H.K., Ruesch, A.S., Achard, F.et al.(2010) Tropical forests were the primary sources of new agricultural land in the 1980s and 1990s.PNAS,107, 16732-16737. Gilbert, N. (2012) Palm-oil boom raises conservation
concerns.Nature,487, 14-15.
Guti ´errez-V ´elez, V.H., DeFries, R., Pinedo-V ´asquez, M.,et al. (2011) High-yield oil palm expansion spares land at the expense of forests in the Peruvian Amazon.Env. Res. Lett., 6, 044029.
Hansen, M.C., Stehman, S.V., Potapov, P.V., Arunarwati, B., Stolle, F. & Pittman, K. (2009) Quantifying changes in the rates of forest clearing in Indonesia from 1990 to 2005 using remotely sensed data sets.Env. Res. Lett.,4, 034001.
Holmes, D. (2000)Where have all the forests gone? Environment and social development East Asia and Pacific Region discussion paper. The World Bank, Jakarta.
Indonesian Ministry of Agriculture. (2002) Tree crop estate statistics of Indonesia 2000–2002 Oil Palm. Directorate General of Estates, Jakarta.
Indonesian Ministry of Agriculture. (2011) Tree crop estate statistics of Indonesia 2010–2012 Oil Palm. Directorate General of Estates, Jakarta.
Indonesian Ministry of Forestry. (2011)Data Spasial Kehutanan. Indonesian Ministry of Forestry. http://webgis.dephut.go.id/. (visited Nov. 20, 2012). Indonesian Palm Oil Council. (2010)Indonesian palm oil in
numbers 2010. Indonesian Palm Oil Producers Association, Jakarta.
Irawan, S., Tacconi, L. & Ring, I. (2013) Stakeholders’ incentives for land-use change and REDD+: the case of Indonesia.Ecol. Econ.,87, 75-83.
Khor, Y.K. (2011) The oil palm industry bows to NGO campaigns.Lipid Technol.,23, 102-104.
Koh, L.P., Miettinen, J., Liew, S.C. & Ghazoul, J. (2011) Remotely sensed evidence of tropical peatland conversion to oil palm.PNAS,108, 5127-5132.
Koh, L.P. & Wilcove, D.S. (2008) Is oil palm agriculture really destroying tropical biodiversity?Conserv. Lett.,1, 60-64. Margono, B.A., Turubanova, S., Zhuravleva, I.et al.(2012)
Mapping and monitoring deforestation and forest degradation in Sumatra (Indonesia) using Landsat time series data sets from 1990 to 2010.Env. Res. Lett.,7, 034010.
McCarthy, J.F. (2010) Processes of inclusion and adverse incorporation: oil palm and agrarian change in Sumatra, Indonesia.J. Peas. Stud.,37, 821-850.
Miettinen, J., Hooijer, A. & Tollenaar, D.,et al.(2012) Historical analysis and projection of oil palm plantation expansion
on peatland in Southeast Asia. CRISP, Deltares, ICCT. The International Council on Clean Transportation, Washington, DC.
Miettinen, J., Shi, C., Tan, W.J. & Liew, S.C. (2011) 2010 land cover map of insular Southeast Asia in 250-m spatial resolution.Rem. Sense Lett.,3, 11-20.
Minnemeyer, S., Boisrobert, L., Stolle, F.,et al.(2009) Interactive atlas of Indonesia’s forests (CD-ROM). World Resources Institute, Washington, DC.
Morton, D.C., DeFries, R.S., Shimabukuro, Y.E.et al.(2006) Cropland expansion changes deforestation dynamics in the southern Brazilian Amazon.PNAS,103, 14637-14641. Nepstad, D.C., Stickler, C.M., Filho, B.S. & Merry, F. (2008)
Interactions among Amazon land use, forests and climate: prospects for a near-term forest tipping point.Phil. Tran. R. Soc. B: Biol. Sci.,363, 1737-1746.
Obidzinski, K., Andriani, R., Komarudin, H. & Andrianto, A. (2012) Environmental and social impacts of oil palm plantations and their implications for biofuel production in Indonesia.Ecol. Soc.,17, 25.
Rudel, T.K., DeFries, R., Asner, G.P. & Laurance, W.F. (2009) Changing drivers of deforestation and new opportunities for conservation.Conserv. Biol.,23, 1396-1405.
Simamora, A.P. (2010)Indonesia ready for binding targets on emissions reduction. The Jakarta Post. http://www. thejakartapost.com/news/2010/01/15/indonesia-ready-binding-targets-emissions-reduction.html (visited Nov. 20, 2012).
Suyanto, S., Applegate, G., Permana, R.P., Khususiyah, N. & Kurniawan, I. (2004) The role of fire in changing land use and livelihoods in Riau–Sumatra.Ecol. Soc.,9, 15. Tabacek, K. (2010) Nestl ´e uses NGO to clean up palm oil
supply chain.The Guardian. http://www.guardian.co.uk/ sustainable-business/nestl-ngo-clean-up-palm-oil-supply-chain (visited Nov. 20, 2012).
Tomich, T.P. & van Noorwijk, M. (1995) What drives deforestation in Sumatra?Regional Symposium on Montane Mainland Southeast Asia in Transition. Bogor, ICRAF, Chiang Mai, Thailand.
Uryu, Y., Mott, C., Foead, N.,et al.(2008)Deforestation, degradation, biodiversity loss and CO2 emission in Riau, Sumatra, Indonesia. World Wildlife Fund (WWF), Washington, DC. Vermeulen, S. & Goad, N. (2006)Towards better practice in
smallholder palm oil production. International Institute for Environment and Development, London, UK.
World Bank. (2010)Improving the livelihoods of palm oil smallholders: the role of the private sector. International Finance Corporation, World Bank Group, Washington, DC, USA. World Bank. (2011)The World Bank Group framework and IFC
strategy for engagement in the palm oil sector. International Finance Corporation, Washington, DC, USA.