THE IMPACT OF INDONESIAN EXPORT PROMOTION AGENCIES (EPAs) ON INDONESIAN EXPORT
CASE STUDY FROM INDONESIAN FOOTWEAR EXPORT
HELGANITA DEVIYANTI SINAGA
POSTGRADUATE SCHOOL
BOGOR AGRICULTURAL UNIVERSITY BOGOR
STATUTORY DECLARATION
I, Helganita Deviyanti Sinaga, hereby declare that the master thesis entitled ”The
Impact of Indonesian Export Promotion Agencies (EPAs) on Indonesian Export, Study Case from Indonesian Footwear Export” is my original work under the supervision of Advisory Committee and has not been submitted in any form and to another higher education institution. This thesis is submitted independently without having used any other source or means states therein. Any source of information originated from published and unpublished work already stated in the part of references of this thesis. Herewith I passed the thesis copyright to Bogor Agricultural University.
Bogor, February 2016
Helganita Deviyanti Sinaga
RINGKASAN
HELGANITA DEVIYANTI SINAGA, Dampak Indonesian Export Promotion Agencies
(EPAs) pada Ekspor Indonesia, Studi Kasus pada Ekspor Alas Kaki Indonesia. Dibimbing oleh PARULIAN HUTAGAOL dan FLORIAN PLOECKL.
Export Promotion Agency (EPA) telah banyak diterapkan oleh banyak negara di dunia guna mendukung pertumbuhan ekspor melalui promosi. Hal ini juga diterapkan oleh Indonesia pada lebih dari 20 tahun. Namun, terkait dengan dampak dari EPA Indonesia, hal tersebut masih mengundang banyak pertanyaan akan dampaknya pada total ekspor Indonesia maupun dampaknya pada produk yang spesifik seperti alas kaki. Untuk itu, penelitian ini bertujuan untuk mengetahui dampak EPA pada ekspor Indonesia.
Saat ini banyak penelitian telah dilakukan untuk mengestimasi dampak EPA pada total ekspor suatu negara. Namun demikian, masih sangat jarang ditemukan penelitian yang mempelajari dampak EPA pada produk tertentu. Untuk itu penelitian ini dapat berguna untuk menjawab beberapa pertanyaan. Pertama, penelitian ini bertujuan untuk mempelajari dampak EPA Indonesia pada total ekspor Indonesia. Yang kedua, penelitian ini juga bertujuan untuk mempelajari dampak EPA Indonesia pada ekspor alas kaki Indonesia.
Produk alas kaki ini dipilih karena produk tersebut merupakan salah satu dari produk utama dalam klasifikasi Kementerian Perdagangan RI. Terlebih lagi, tren perdagangan produk tersebut meningkat pada lima belas tahun belakangan. Alas kaki juga berkontribusi sekitar 2% pada ekspor Indonesia. Sehingga, dengan melihat tren yang ada, penelitian ini ingin mempelajari apakah ada keterkaitan antara EPA Indonesia terhadap ekspor alas kaki Indonesia.
Untuk memperoleh hasil yang valid, data yang digunakan adalah sepuluh tahun observasi. Periode yang digunakan adalah antara tahun 2004 sampai 2013, pemilihan tahun berdasarkan pada tahun re-opening EPA Indonesia setelah penutupan beberapa tahun sebelumnya akibat krisis moneter. Analisa juga mencakup 30 negara yang dibagi atas 18 negara yang telah memiliki EPA Indonesia dan 12 negara yang tidak memiliki EPA Indonesia.
Penelitian ini menggunakan pendekatan gravity model dengan menambahkan beberapa variabel yang terkait EPA dan FTA. Data yang digunakan adalah data panel yang terdiri atas 30 negara untuk periode sepuluh tahun. Estimasi model dilakukan dengan mempertimbangkan tiga pendekatan, yakni pooled least square (PLS), fixed effect (FE) danrandom effect (RE) model.
2
berikutnya setelah penandatanganan FTA juga sama dengan 1. Variabel-variabel lainnya yang digunakan dalam penelitian adalah variabel terkait gravity model seperti border, language, dan landlocked.
Hasil analisa menunjukkan bahwa EPA Indonesia memberikan dampak yang positif ketika dianalisa menggunakan pooled least square (PLS). Namun dengan menggunakan random effect (RE) dan fixed effect (FE), pengaruh positif EPA tidak terkonfirmasi. Selanjutnya, tidak ditemukan pula bukti adanya pengaruh EPA juga terjadi pada analisa dampak EPA Indonesia pada ekspor alas kaki. Hal ini dapat terlihat pada tiga pengujian dengan PLS, RE dan FE. Sehingga kita dapat menyimpulkan bahwa dampak Indonesia EPA tidak terdapat pada ekspor produk tertentu (pada studi ini digunakan komoditas alas kaki). Hal tersebut dapat terjadi dikarenakan produk alas kaki mayoritas berasal dari produk berbasis luar negeri seperti Adidas dan Nike. Sehingga terkadang dukungan dari EPA tidak diperlukan.
SUMMARY
HELGANITA DEVIYANTI SINAGA, The Impact of Indonesian Export Promotion Agencies (EPAs) on Indonesian Export, Case Study from Indonesian Footwear Export. Under Supervision of PARULIAN HUTAGAOL and FLORIAN PLOECKL.
Export promotion agencies (EPAs) have been used by many countries as a support for export led growth, including Indonesia. However, in regards to Indonesian EPAs, there are still many questions regarding the impact of Indonesian EPAs on Indonesian export performance.
Recently, there were many studies analyzing the impact of EPAs on aggregate export. However, there have never been any studies analyzing the EPAs impact on specific product. Therefore, in order to fill the gap in the literature, this study has two main objectives. Firstly, this study examines the impact of Indonesian EPAs on Indonesian total export. Secondly, this study also examines the impact of Indonesian EPAs on specific product which is footwear.
Footwear as a specific product was chosen because its category as one of the ten main export products based on the Ministry of Trade classification. Its trends have been increasing on the last fifteen years. Footwear also contributes to around 2% of Indonesian export. Therefore, looking to the potency and achievement of the product, we would like to study whether the increasing export was influenced by the existence of EPAs.
In regards to the model, the estimated models considered three approaching panel data methods, namely, pooled least square (PLS), fixed effect (FE) and random effect (RE). To obtain the valid result, ten year observations are used. The years were taken from 2004 to 2013 which were the re-opening year after the closing of Indonesian EPAs because of monetary crisis era. Analysis also used 30 countries observations which are divided as 18 countries that have an EPA or more, and 12 countries that have no EPA.
This study uses gravity model, and it also uses the dummy variables related, which are FTA and EPA added to the equations. In regards to the variables, EPA on the gravity model is represented by two dummies. The first dummy is given for the opening year of EPA on a country, while, the second dummy is given for the following years after an EPA opened. The dummy is equal to 1 when a year is on the criteria. Trade is also related to the existence of free trade agreement (FTA). Therefore, beside the EPA dummies, the dummy of FTA is used. The other controlling variables are the standard gravity variables such as border, language, and landlocked. These variables usually have a strong relation to the trade impact.
The estimation result shows that Indonesian EPAs have an impact on total exports as estimated by a pooled least square (PLS) model. However, by further research using FE and RE, the significance and positive coefficient is not found. The insignificance impact is also found in analyzing the impact of EPAs on footwear export which can be seen on the three tests using PLS, FE and RE. Therefore, we can consider that the EPA does not have an impact on footwear export and EPAs services are not needed.
@Copyright belongs to IPB, 2016 All rights Reserved Law
Prohibited quoting part or all of this paper without including or mentioning the source. The quotation is only for educational purposes, research, scientific writing, preparation of reports, writing criticism, or review an issue; and citations are not detrimental to the interest of IPB.
THE IMPACT OF INDONESIAN EXPORT PROMOTION AGENCIES (EPAs) ON INDONESIAN EXPORT
CASE STUDY FROM INDONESIAN FOOTWEAR EXPORT
HELGANITA DEVIYANTI SINAGA
Master Thesis
As a requirement to obtain a degree Master of Science in
Economics Program
POSTGRADUATE SCHOOL
BOGOR AGRICULTURAL UNIVERSITY BOGOR
AKNOWLEDGEMENT
‘Trust in the LORD with all your heart and do not lean on your own understanding’
(proverbs 3: 5). My greatest gratitude goes to God Almighty in Jesus Christ, for the wisdom, strength and good health in order to accomplish this mini dissertation.
I would like o express my gratitude towards my family for the encouragement which helped me in completion of this dissertation. My beloved and supportive husband, Iwan Pandjaitan who is always by my side when times I needed him most and helped me a lot in making this study, and my lovely daughter, Gracya Laurent, who served as my inspiration to pursue this undertaking.
I highly appreciate all lecturers in the School of Economics Institut Pertanian Bogor (Bogor Agricultural University) and the University of Adelaide who shared their valuable knowledge and perspectives in economics.
I would like to thank the Ministry of Trade and Australian Awards Scholarship for providing sponsorship to undertake my study in Bogor and Adelaide. I also wish to thank the University of Adelaide and Institut Pertanian Bogor for providing me the chances to pursue my academic achievement. Special thanks are given to my institution, the Directorate General for National Export Development-the Ministry of Trade.
I owe more gratitude and honour to my parents, who have supported and encouraged me throughout this challenging period of study. I am very grateful for having their spiritual blessing, tender love and patience. I dedicate my dissertation to them.
Helganita Deviyanti Sinaga I would like to express my special gratitude and thanks to both supervisor,
Prof. Dr. M.Parulian Hutagaol and Dr Florian Ploeckl, for their guidance, outstanding
knowledge, worthwhile suggestions, ideas, constant supervision and encouragement during the course of this thesis. Their guidance and technical assistance led me to finish my dissertation.
All errors are, of course, my own.
TABLE OF CONTENTS
LIST OF FIGURES i
LIST OF TABLES i
1 INTRODUCTION 1
Background 1
Problem Formulation 3
Research Objective 4
Research Benefit 4
Scope of Research 5
2 LITERATURE REVIEW 6
EPAs and asymmetric information 6
EPAs and Products Differentiation 7
EPA and export per capita 7
Previous Studies 8
The Gravity Model and Its Variables 11
Research Hypothesis 13
3 RESEARCH METHODOLOGY 14
Model Specification 14
Source of Data 16
Methodology 16
4 RESULT AND ANALYSIS 21
Testing the models 22
Impact of Indonesian EPAs on Indonesia total export 23
Discussion 25
5 CONCLUSION AND SUGGESTION 28
Conclusion 28
Suggestion 29
APPENDICES 31
LIST OF FIGURES
1 Indonesian total export to 30 countries 3
2 Footwear export trend compare to other Indonesia main product 4
3 EPAs based on budget and export per capita 8
4 Indonesia Total Export to 10 countries 21
5 Indonesia Footwear Export to 10 countries 22
LIST OF TABLES
1 Indonesian EPA offices 2
2 Source of Databases 16
1
1
INTRODUCTION
Background
All of the countries in the world pursue high economic growth since high economic growth will lead to new industrialized economies or emerging countries (Hayakawa 2011). However, to obtain high economic growth, countries should have effective strategy. Hayakawa and others (2011) assert that for a long time, the high economic growth was stimulated by an export-led growth strategy. The export-led growth strategy means a strategy to promote and increase export production for obtaining a rapid growth development (Shahid 2013).
In targeting the export-led rapid growth, one of the strategy is to establish representative offices in overseas as the front line in export promotion, termed export promotion agencies (EPAs) (Hayakawa and others 2011). Meanwhile, Kang (2011) define an EPA is an institution providing efforts or activities to boosting export or foreign trade. Therefore, they have found that EPAs have positive impact in helping local companies gain international access to foreign trade.
Over the last few decades a growing number of EPAs have been established. Historically, the first appearance of the export promotion agency (EPA) was in Finland by the Bolivian in 1919. Following this, many countries have established EPA offices in foreign countries. According to Lederman et al. (2005), there were national EPAs in 88 of the 116 countries in their survey in 2005, and since then the number of EPAs has been increasing gradually. Those countries have experienced the impact of EPAs in helping local export companies gain access to import markets.
Recently, EPAs have become well known tools to boost bilateral trade between countries. Some of the countries have set up export promotion offices with different names, for example, Trade Commissioner Office (TCS-Canada), Regional Export Promotion Offices (REPO-Spain), Korean Trade (KOTRA), Japan External Trade Organisation (JETRO), Indonesian Trade Promotion Center (ITPC-Indonesia), Serbia Investment and Export Promotion Agency (SIEPA), International Trade Center (ITPC-France), Australian Trade (AUSTRADE), International Trade Center (ITC) and International Promotion Office (IPO).
The composition of EPAs in the world has about 15% is private entities, around 62% are semi-autonomous companies which report to a president or prime minister and about 23% of the offices are units in ministries or government
institutions (Lederman et al., 2005). Lederman et al also reveal that all types of EPAs
generally do not have specific differences in terms of function. Moreover, regarding funding sources, about 52% of EPAs obtain their budget from public funding, around 15% gained funding from the private sector or by selling their services and the remaining 33% obtain funding from bilateral or multilateral cooperation (Lederman et al., 2005) .
2
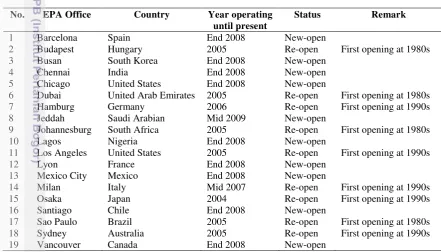
countries. When operating in 1980s there were approximately 20 offices. Unfortunately, no data has been found to trace their existence. In 1997, their operations were threatened due to a monetary crisis and budget deficit. Consequently, all of the EPA offices were closed for several years. After the crises, start from 2004 to 2007, nine previous offices were re-opened. Since 2008 onwards, there are ten new EPAs opened. Currently, there are 19 EPAs offices at 18 countries. As shown in Table 1,the EPAs offices are existed on several countries. However, there are some important trading partner countries such as China and some European countries not having Indonesian EPA.
Table 1 shows the Indonesian EPA offices in overseas countries. It states the opening year when an EPA was opened. From the table, it can be seen there are already 18 countries have Indonesian EPAs, and a country which is USA has two EPA offices. For operational, they used fully government funding. Due to the government funding and have been operating for more than 2 decades, the legislators have questioned about the Indonesian EPAs impact on Indonesian export performance, including the impact on specific products.
Table 1 Indonesian EPA offices No. EPA Office Country Year operating
until present
Status Remark
1 Barcelona Spain End 2008 New-open
2 Budapest Hungary 2005 Re-open First opening at 1980s
3 Busan South Korea End 2008 New-open
4 Chennai India End 2008 New-open
5 Chicago United States End 2008 New-open
6 Dubai United Arab Emirates 2005 Re-open First opening at 1980s 7 Hamburg Germany 2006 Re-open First opening at 1990s 8 Jeddah Saudi Arabian Mid 2009 New-open
9 Johannesburg South Africa 2005 Re-open First opening at 1980s
10 Lagos Nigeria End 2008 New-open 18 Sydney Australia 2005 Re-open First opening at 1990s
19 Vancouver Canada End 2008 New-open
Source: Indonesian Ministry of Trade
3 Problem Formulation
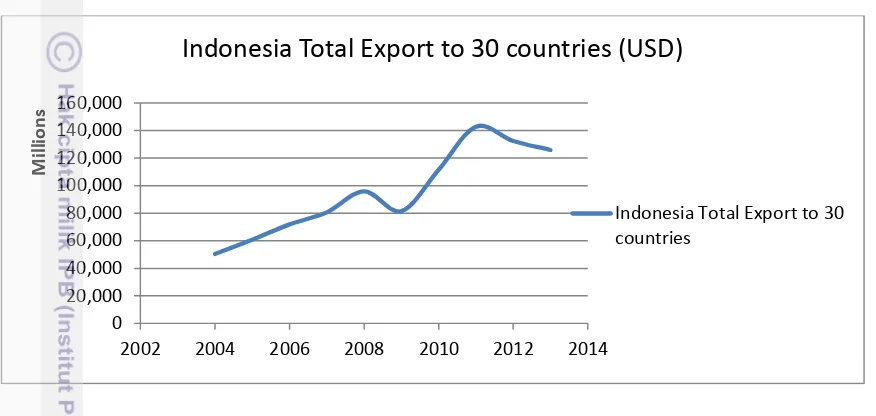
Indonesian total export to the world has an increasing trend as shown in the Figure 1, over the last ten years. The increasing trend was also shown in specific products (Figure 2). The figures showed that the values were increasing significantly. However, by looking at the Indonesian total export and footwear export to the 30 countries, it raises the question whether the increasing trend have relations to the role of Indonesian EPAs.
Data source : UN Commtrade Database
Figure 1 Indonesian total export to 30 countries
The Ministry of Trade had classified 10 products as the main Indonesian export products. Those 10 products include coffee, prawn, cacao, TPT, footwear, CPO, rubber, electronics, vehicle and furniture. Those products classification are Indonesian main products that have the largest exports. Therefore, in order to measure the impact of Indonesian EPA on specific product exports, we need to further research whether the promotional agencies have worked satisfying to increase export of one of these products.
4
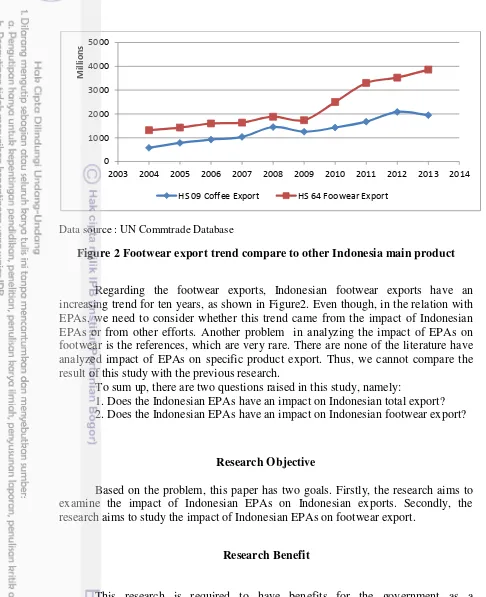
Data source : UN Commtrade Database
Figure 2 Footwear export trend compare to other Indonesia main product
Regarding the footwear exports, Indonesian footwear exports have an increasing trend for ten years, as shown in Figure2. Even though, in the relation with EPAs, we need to consider whether this trend came from the impact of Indonesian EPAs or from other efforts. Another problem in analyzing the impact of EPAs on footwear is the references, which are very rare. There are none of the literature have analyzed impact of EPAs on specific product export. Thus, we cannot compare the result of this study with the previous research.
To sum up, there are two questions raised in this study, namely:
1. Does the Indonesian EPAs have an impact on Indonesian total export? 2. Does the Indonesian EPAs have an impact on Indonesian footwear export?
Research Objective
Based on the problem, this paper has two goals. Firstly, the research aims to examine the impact of Indonesian EPAs on Indonesian exports. Secondly, the research aims to study the impact of Indonesian EPAs on footwear export.
Research Benefit
This research is required to have benefits for the government as a consideration in improving policies. This research is also required to have benefit for business to use more the Indonesian EPAs services.
0 1000 2000 3000 4000 5000
2003 2004 2005 2006 2007 2008 2009 2010 2011 2012 2013 2014
M
il
li
o
n
s
5 Scope of Research
6
2
LITERATURE REVIEW
This research has two objectives which are to examine the impact of Indonesian EPAs on total export and footwear export. Regarding these matters, this study presents several theories that explain the posible positive impact of EPA on export performance. EPA function basically is based on the principal of asymmetric information and externalities theorem. In further, to analyse the impact on trade, we need to define each factors determine the EPA impact on export. By using gravity model equation, it can be found that the gravitational variables influencing the total export and footwear export. In addition, the other variables that closely related to trade can be defined.
EPAs and asymmetric information
How actually the EPAs have roles on exports? The justification for successful government involvement in EPAs should be based on asymmetric information and externalities, economies of scale and productivity spillover (Kang 2011; Lederman et al., 2005). Economies of scale and productivity spillover are related to the cost advantage that arises with an increase in product output (Kang 2011). Meanwhile, asymmetric information refers to situations in which some agencies have trade information while other agencies in a similar trade do not have that information (Do 2013). In other words, when two or more individuals make a trade agreement trade one has some information but the others do not. In this regard, an EPA has a role in distributing information to avoid market failure. Akerlof (1970) provides a simple example to explain the relationship of quality and uncertainty, about a seller who has information about the quality of a used car. As the buyer cannot compare the quality, owners of lower quality cars will claim they are selling a quality car to gain the highest price. Similarly, EPAs have a function to overcome asymmetric information. There are several ways to manage asymmetric information, such as providing a media slot that can be used in campaigning products, exclusive information networks and mass surveys, all of which can contribute to larger industrial sector export volumes (Auronen 2005).
7
used by other rival companies as free rider information (Hausman et al., 2003). Therefore, establishing EPAs aims to address those particular issues to increase local exporters engaging in foreign trade. In this regard, EPA impacts are related to obtaining foreign market information such as consumer preferences, business opportunities, quality and technical requirements, which provide positive externalities to the trader.
EPAs and Products Differentiation
EPAs are expected to have impact on country’s export and able to generate product differentiation and create specific product export. Martincus and others (2010) claim a larger margin of EPA impact was obtained in Latin American and Caribbean countries. They found that EPAs trigger the number of differentiated goods exported, while diplomatic representatives only improve export of homogeneous goods.
Similarly, Alvarez and Crespi (2004) also found that product diversification and the expand of the number of markets were positively affecting expanding Chilean export promotion programs. This was also revealed in earlier research by Martincus and Carballo (2008)regarding market and product diversification in Peru. They indicate that the effectiveness of export promotion programs can be seen on the various products sold to the other countries. Gil et al. (2008) also assert that as the number of export agencies is added to the gravity model the coefficient will be significantly high. This action contributes to the increase of foreign trade products by 74%, respectively (Gil et al., 2008). In this regards, by the existence of an EPA in a country, the possibility to sell more and various products are greater. Specifically, EPAs will help to promote mature products or new products on the market. EPAs have function to find out the trend of a product and disseminating it to domestic people. Thus, it will provide the new differentiated product.
EPA and export per capita
8
By the advancement of EPAs in the world, we can consider how important EPAs in supporting export. Therefore, Indonesia has already had EPAs in several countries and has been operating Indonesian EPAs for more than two decades.
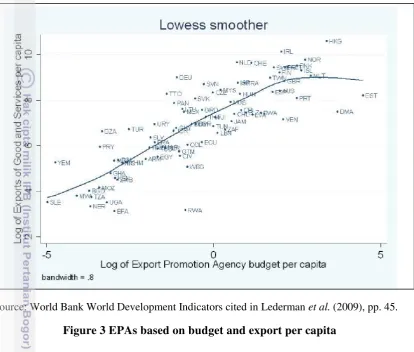
Source: World Bank World Development Indicators cited in Lederman et al. (2009), pp. 45.
Figure 3 EPAs based on budget and export per capita
The positive EPA results were also shown by Hayakawa et al. (2011) when analyzing Japanese and Korean EPAs. In addition, Martincus et al. (2010) also have almost the same result, even though, the countries involved on the research were Latin America and Carribean countries. Both studies had used gravity equation with different study scope. However, different analysis with Gil and others (2008), Hayakawa et al. (2011) separates high and low per capita income trading partners in order to precisely estimate the result and imply that the existence of export promotion
institutions increase the host country’s foreign trade by 49% annually. This result has
a slight smaller amount estimated by Gil et al. (2008). Similarly, Hayakawa et al.
(2011) also claims an increase in trade around 59% while there is at least one EPA office in a country.
Previous Studies
9 survey of country’s national EPAs covering 104 countries by obtaining cross-section data. The results generated a plot that suggests EPAs have a strong positive effect on exports, where for one dollar budget spent on trade promotion trade increases by approximately 200 dollars (Lederman et al., 2009, pp. 16). However, there is still a heterogeneity in the effective EPAs which depends on geography, demography development and types of measurements. The results also suggest that on average EPA offices have to apply budgeting of around 0.11% of their export value Lederman
et al. (2009).
In addition, Hogan et al. (1991) argue that the limitation of EPAs is their shortage of budget source and bad policy circumstances which could be overcome if well-funded. However, the Lederman et al. (2009) study reveals significant EPA welfare and be concentrated on the aims of accessing export growth and opening new markets. Lederman et al. (2005) also reveal the effect and strategies of EPA where, on average, EPAs have a strong effect on markets and a statistically significant impact on exports. According to these authors, every 1 US$ budget in export promotion will increase exports by 40 US$ suggesting that EPAs have a significant and cost-effective role in developing exports.
Another empirical method was applied by Biesbroeck et al. (2011) using random sampling survey with Average Treatment Effect (ATE) analysis. Different with Lederman et al. (2009) which surveyed 104 countries, this research surveyed the impact on a company that uses Trade Commissioner Services (TCS) Canada services. The study found consistent positive effects of TCS services on export growth where exporters who use TCS services can increase exports by 17.9% (Biesbroeck et al.,
2011). Consequently, TCS have played an important role in market and product diversification in Canada. Recently, TCS had 140 offices around the world and provided six main services: information about market opportunities, help to find contacts, generation of local company information, company visits, problem solving and dispute handling, which are similar activities to those discussed by Lederman et al. (2009).
10
effectively with SMEs (Alvarez &Crespi 2004; Yu&Chen 2008; Martincus et al., 2010). A study of Australian Trade (AUSTRADE) also states the view that EPA activities can be used to grant SMEs in relation to trade finance and financial assistance (Lederman et al., 2009; Marcelin& Malokele 2013).
In addition to non-empirical results, Gil et al., (2008) reveal point evaluation of Spain EPAs (REPO) to analyse product export numbers, transactions, average of export transaction and EPA effect to the country and the effect to product differentiation on regional industry. The REPO itself was claimed have positive effects on the total exports number in Spain using the OLS model. Furthermore, REPO also has significant impact on the increase of trade transactions per product. The impact was estimated by conventional OLS and the coefficients were statistically and economically significant which indicates that Spanish REPOs have had a positive impact on Spanish bilateral trade showing the impact is bigger for more product differentiation. In further research, EPAs also contribute to build a good country’s image which indirectly promotes other products from its country (Schlaeppi 2012).
On the other hand, there are many reports against positive benefit of EPAs which suggest no impact of EPA on exports. Hogan et al. (1991) imply that until the past decade the empirical literature has failed to find positive impact of EPAs on exports. These authors consider export agencies fail to provide positive impacts to export growth due to the programs of EPAs not supporting exporters to enhance their business in a new country. Moreover, excessive involvement by government play a role in hindering EPA activities designed to help exporters or businesses. Therefore, exporters do not rely on EPAs or fewer exporters use their services. This study also supports Bernard and Jensen’s (2001) finding that U.S. state-level export promotion expenditure had no significant effect on the probability of local firms exporting products because the EPA did not engage with local exporters.
Another analysis shows that EPAs work inefficiently. Keesing et al. (1991) found that EPAs has failed to achieve targets and suggest the agencies had a negative impact on exports. The problem was due to poor service by civil servants or staff involved in the agencies. EPA staff did not consider marketing oriented and low capabilities in marketing products, although not all EPAs showed this problem. Moreover, EPAs were not directing new enterprises to open a new market and providing the best service. Consequently, weak leadership, inadequate funding and bureaucratic problems resulted in EPA inefficiency. However, further analysis is required to undertake external evaluation, as agencies will work effective only when they are subject to serve private and public sectors.
11
causing foreign representatives to fail in their role of gathering information and decision making which are very important for local exporters.
The Gravity Model and Its Variables
A considerable number of empirical studies have researched the impact of EPAs on trade. Most of the studies used the gravity model as the method of empirical testing. The gravity model, in particular, is used to analyse bilateral trade between major trading partners, because the model can explain international trade flow which allows the user to include the geographical, cultural and political variables.
The gravity model was introduced from the law of gravity presented on Jan
Tinbergen’s seminal in 1962. It implemented the equation for international trade flow studies. On its first use, it was applied for all social interaction such as migration, tourism, and foreign direct investment. The gravity equation has analogy with the
Newton’s theory of gravitation where planets are attracted in proportion sizes and
proximity by mutually. The theorem basically is mathematical models based on
Newton’s law of gravitational force. Newton law states that: “Every particle of matter
in the universe attracts every other particle with a force that is directly proportional to the product of masses of the particles and inversely proportional to the square of the
distance between them.” (Khan 2013).
The equation is the most common statistical method for analyzing bilateral trade flows with different geographical condition. The gravity theorem itself was
founded in 1687, and more famous with the name of theorem Newton’s law of
gravity equation. The basic formulation is given like below:
= � �
�
Where:
is the attractive force or force gravity
�and � are the masses of particles
� is the distance between two objects (square of straight line) G is gravitational constant, which depends on the unit measurement
The expression of the general gravity law has the same notation:
= G � � people, the unit measure is adjusted with the populations.
• Dij is the distance between the locations.
12
The research contribution related to the theorem foundation of the gravity model involves the specifications or variables in the theory of economy by drawing suitable inferences estimation. For example, Anderson et al. (2003) state that export is determined by cost of trade (weighted average trade cost). Specifically, the possibility of a country to import from another country is determined by relative trade cost, which also determined by the country’s geographical position such as being surrounded by other large trading economies, or surrounded by oceans, desert or mountains. Moreover, the trade between countries is also influenced by multilateral or bilateral trade agreements. Therefore, estimation of a gravity equation requires data on bilateral trade, GDPs, population, distances (DIST), tariffs and other determinants of bilateral trade including contiguity (common border), common language, colonial ties and so on.
Therefore, by using logarithmic, the standard gravity equation is given as: ln = � + αln ���+ βln ���+ θln�� + ⋯+ �. In this regard, Y is the value of export. The GDP and population are controlling variables which have functioned to the purchasing power of a country. Therefore, these variables should be included in empirical testing.
Another controlling variable is variable related to multilateral and bilateral agreement. In this regard, we use dummies of FTA between Indonesian and the other countries involved in this research. Some researchers had found a positive impact of EPAs on international trade. Empirical result found that about 153%t of exports will be added to the regions when they apply dummy free trade agreement (FTA) with a partner country (Gil et al., 2008, pp. 142). In reality, FTA provided a good impact to trade. The result of Martincus et al. (2010) and Hayakawa et al. (2011) found that FTA triggers EPAs in supporting the opening of new markets and product development. Moreover, Gil et al. (2008) asserts that FTAs generate the number of transactions and value of export on average. This research also claimed that the use of common language, not landlocked and common borders between paired countries increases trade gradually. Furthermore, another research also implied the increase of 153% was achieved by Chilean exports while the country applied trade agreement to a partner country. Therefore, FTA dummies are needed to use in this research.
Moreover, based on the Spain experience, Gil et al. (2008) address the issue of bilateral trade by implementing analysis of the effect of Spanish EPA called Regional Trade Agencies (REPO) on their foreign trade. The REPO itself has function to support and provide information for regional companies to sell products
abroad. The analysis sampled 188 international markets from 17 Spanish regions. The
13 Research Hypothesis
14
3 RESEARCH METHODOLOGY
Model Specification
There are two objectives that should be examined on this research to answer the impact of Indonesian EPAs on total export and footwear export. The literature showed that several variables are involved to examine the two questions. Therefore, there will be two models to be examined. The first model aims to examine the impact of Indonesian EPAs on total export, and the second model aims to examine the impact of Indonesian EPAs on footwear export. Both models use the same independent variables, while the dependent variables are total export and footwear export.
Using determinants given on the literature, the variables can be divided into three groups. Firstly, variables represent the demand from the importers which describe the total demand. These variables are included GDP per capita and population. In the model, the GDP of the importing countries are used to represents the purchasing power from the countries. This means the higher the GDP, the higher the demand for products. Secondly, variables indicate the potency of the exporters. These variables represent the ability to offer the product and the value added from the country. The dummy variables of FTA and EPA are required to increase the potency to sale products greater. Particularly for EPA, there will be two dummies represent the year EPA was opened and the following years the EPA was operated in a country. This separation will easier to know the impact on the two categories. Thirdly, supporting variables include in gravity determinants, such as, distance, landlocked, border, language. Krugman (1980) implies that those factors influence the cost of trade. Therefore, the two equations are given as below.
In regards to the variables, EPA on the gravity model is represented by two dummies. The first dummy is given for the opening year of EPA on a country, while, the second dummy is given for the other years other than the opening year. The
The first equation is the model to examine the impact of Indonesian EPAs on total export. The equation as below:
Ln EXPORTij = α0+β0lnPOPULATIONjt+β1lnGDPjt+β2lnDistanceij+ β3Landlockedj+
β4Borderij+ β5Languageij+ β5Languageij+ β6FTAij+ β7OpeningEPAij +
β8NonOpeningEPAijt + β9EUij + ᵞ*b + Ɛt
15
Ln FOOTWEARijt = α0+β0lnPOPULATIONjt+β1lnGDPjt+β2lnDistanceij+
β3Landlockedj+ β4Borderij+ β5Languageij+ β5Languageij+ β6FTAij+ β7OpeningEPAij
+ β8NonOpeningEPAijt + β9EUij + ᵞ*b + Ɛt
The description of the variables is described as below:
Export = Export represents the export value of total products from Indonesia to importing country j in year t, measured at current US$ in period 2004-2013.
Footwear = Footwear represents the footwear export value from Indonesia to country j, measured at current US$ in period 2004-2013.
Population = Population represents The large of population in destination country
j in year t.
GDP = GDP denotes the value of goods and services from the country’s
boundaries in a year with unit in Dollars. GDP per capita is used in this model since this factor lead to higher purchasing power, demand and economy size of the importing country which enlarge market size. Measured in billion US dollars. The data used Gross Domestic Product (Year based 2005) at country j in period t. Distance = Distance denotes the distance between country i and j in kilometer.
Distance is influencing trade respectively.
Landlocked = Landlocked is the number of country-regions in the pair that have no direct access to the sea. It is given Dummy equal to 1 when a country has an access to the sea and 0 otherwise.
FTA = The dummy of FTA represents any bilateral, multilateral or
regional agreement that belong to two countries. Dummy is equal to 1 when there is an FTA signed, and 0 otherwise.
Language = A binary dummy variable for common language between two countries. Dummy is equal to 1 when both countries have a common language, and 0 otherwise.
OpeningEPA = The Opening EPA is the year when an EPA was opened in j country. A binary dummy variable is equal to 1 for the year when EPA was opened, and 0 otherwise.
NonOpeningEPA= The Non Opening EPA are the following years after an EPA was opened in j country. Dummy is equal to 1 for the years intended, and 0 otherwise.
EU = A binary dummy EU is dummy for the countries member in
European Union. Dummy is equal to 1 when a country is EU member, and 0 otherwise.
Yb* = Time dummies are introduced to capture shocks per year in both models ranging from 2004 to 2013. The dummy is equal to 1 for the year indicated, and 0 otherwise.
i = The exporting country, in this regard is Indonesia.
16
randomly taken, which are, Sweden, Denmark, Poland, Czhec Republic, Austria, Argentina, Colombia, Kenya, China, Malaysia and Pakistan.
t = The year of observation from 2004 to 2013. The complete description of the variables is described as below.
Source of Data
The model equations contained many variables which need different sources. Most of the data can be found from online databases. The sources of the data are described in Table 2.
Table 2 Source of Databases
Data Source
Value of Indonesian total export and footwear export
United Nations (UN) Commtrade Database
Statistic of population and GDP World Development Indicator (WDI)
Data for the gravity model such as Distance, Landlocked, border and Language
CPII
Data for the FTA signed between Indonesia and other countries
aric.adb.org
Data for the Indonesian EPA opening year
Ministry of Trade
Methodology Panel Data
There are two kind of panel data model, which are, fixed effect model (FEM) and random effect model (REM). FEM and REM are distinguished based on the correlation between error and regressors. The basic equation is:
yit = α0 + Xitβ+ Ɛit .
Regarding the error term, there are also two kinds of model, which are, one way error component model and two ways error component model. In one way error component model, the error is specified as:
17
For the two ways error component, the error is specified as: Ɛit = λi + ᵞi + uit.
In one way error component term, the error term only involve error component which is the individual effect λi. While, for two way error component, it is involved the time effect ᵞi into the error component. Therefore, the different between
FEM and REM is in the correlation between λi and ᵞi with Xit. FEM rises when the
individual effect and controlling variable have a correlation with Xit or have the same structure but not random.
There are three approaches to estimate panel data model, namely, pooled least square (PLS), FEM and REM. PLS assumed that there is no heteroscedasticity between cross section at slope on intercept. While, in the FE model, it assumed consistency does not required, that the individual intercepts αi and Xit are
uncorrelated, and E(Xituit) = 0 must hold. FE has three approaches, namely within group (WG), lest square dummy variable (LSDV) and two way error component FE model (TWEC). While, REM assume that the entity’s error term is not correlated with the predictors which allow for time-invariant variables to play a role as explanatory variables.
On the two way model, the equation model is given as Yit= αi + Xit’β + λi + ᵞb* + Uit. This second model used time effects model ᵞb* for catching the shocks effect
which could be happened each year. Without this time effects, model may be providing significances, but biased because the significance could be provided by other factors. On the other hand, the RE model is given as Yit = β0 + Xit’β + αi +Uit.
The value αi is specific for individual. The overall mean is captured in β0 and αi is time invariant and homoscedasticity across individuals.
Fixed Effect-Within Group (WG)
This approach is used to overcome the bias problem in PLS. The technical way is using deviation data from the individuals. Therefore, if
yit = αi + Xitβ + uit, , then
yit – yi= (αi - αi) + Xitβ+(uit – ui)’β+ (uit – ui), or y*it = X*’itβ + u*it.
Therefore, in this equation, FEM with WG does not have an intercept.
Fixed Effect-Least Square Dummy Variable (LSDV)
This method aims to represent the difference on intercept with dummy variable. As an example, the equation is the same with PLS, which is,
yit = αi + Xitβ + Ɛit
LSDV has an advantage that is providing the unbiased β parameter. But the weakness is when the observation has large unit, it become cumbersome. To test the intercept is significant or not, F test is used with hypothesis,
Ho: α1= α2= α3= …. = αN Hi : one of α is different.
18 Two way component error Fixed Effect Model
This model is arranged based on fact that sometimes fixed effect is not originated from the individual variations (time invariants) but also is originated from the time variations or time effect, therefore, the model as below,
yit = αi + ᵞt + X’itβ + uit, where ᵞt represents time effect.
By adding dummy variables into the model will cause the problem to use two way fixed effects, which is the less use of degree of freedom. This will lead to inefficiency on the estimated parameter.
When using FE we assume that something within the individual may impact or bias the predictor or outcome variables and we need to control for this. This is the rationale behind the assumption of the correlation between entity’s error term and predictor variables. FE remove the effect of those time-invariant characteristics so we can assess the net effect of the predictors on the outcome variable.
Another important assumption of the FE model is that those time-invariant characteristics are unique to the individual and should not be correlated with other
individual characteristics. Each entity is different therefore the entity’s error term and
the constant (which captures individual characteristics) should not be correlated with the others. If the error terms are correlated, then FE is no suitable since inferences may not be correct and you need to model that relationship (probably using random-effects), this is the main rationale for the Hausman test (presented later on in this document).
Pooled Least Squares (PLS)
Pooling data refers to two or more independent data sets of the same type and forms N X T observation. N refers to unit cross section and T refers to the series. The model is given as:
yit = α0 + Xitβ + Ɛit, where α is constant.
By combining all data cross section and time series, it will increase the degree of freedom and generate the efficient result. However, this method has a bias for
variable β. The bias is caused by PLS cannot distinguish the same observation in the different period.
Random Effect Model
Random effects assume that the entity’s error term is not correlated with the
predictors which allows for time-invariant variables to play a role as explanatory variables. In random-effects, we need to specify those individual characteristics that may or may not influence the predictor variables. The problem with this is that some variables may not be available therefore leading to omitted variable bias in the model. RE allows to generalize the inferences beyond the sample used in the model.
There are two ways in analyzing panel data model. The first is one way error component. This model is given as Yit = α0 + Xitβ + λi + uit. αi are individual intercept
(fixed for given N), no overall intercept is usually included on the model, λi + Uit is
equal to eit. The second is two way error component. The model is given as Yit = α1 + Xitβ + λi + uit + ᵞt.
19
difference between individual, which determine how the OLS estimator in a regression is calculating the rate of individuals y in x individual. Between estimators is consistent for indefinite N which assumed the error is uncorrelated each other, and so is for the rate of error.
The other approach to estimate REM is GLS. GLS approach by combining the information from dimension between and within a regression. If the coefficient is fixed, then the estimator obtained will be called random effect estimator. The
equation is described as βRE = ωβ + (Ik-ω)βwithin.
Validity Test
In choosing the best model between FE and RE, the testing of assumption is done to study the correlation between regressor and individual effect. This specification test is based on the difference between FE and RE estimation given by Hausman (1978). The main idea behind the test is that the FE estimator is consistent whether effects are correlated or not with the ��variable (Wooldridge 2000). If there is no correlation between regressors and effects, then FE and RE are both consistent, but FE is inefficient. If there is correlation, FE is consistent and RE is inconsistent.
Under the null hypothesis of no correlation, there should be no differences between the estimators. To carry out the Hausman test:
Calculate �̂RE - �̂FE and its covariance.
The Hausman test is a test for the independence of the λi and the Xit. The
covariance of an efficient estimator with its difference from an inefficient estimator should be zero. Under the null hypothesis:
W = (βRE-βFE)’∑̂− (βRE-βFE) ~ �2(k)
If W is significant, we should not use the random effects estimator.
However, if the null hypothesis is true, the FE estimator is not efficient under the RE specification since it relies only on within variation in the data. On the other hand, the RE estimator is efficient under the null hypothesis but is biased and inconsistent when effects are correlated with �� variable. The difference between these estimators (FE-RE) tend to zero in probability limits under the null hypothesis and is non-zero under the alternative (Wooldridge 2000). The null hypothesis is
20
The last validity test is robust test, which correcting the standard error of the model. Robust is defined as a white test for standard error correction. This test also corrects the heteroscedaticity in a model. In STATA, this robust test only adds a
variable “robust” at the end of the variables observed. With robust test, the standard
21
4
RESULT AND ANALYSIS
General Overview
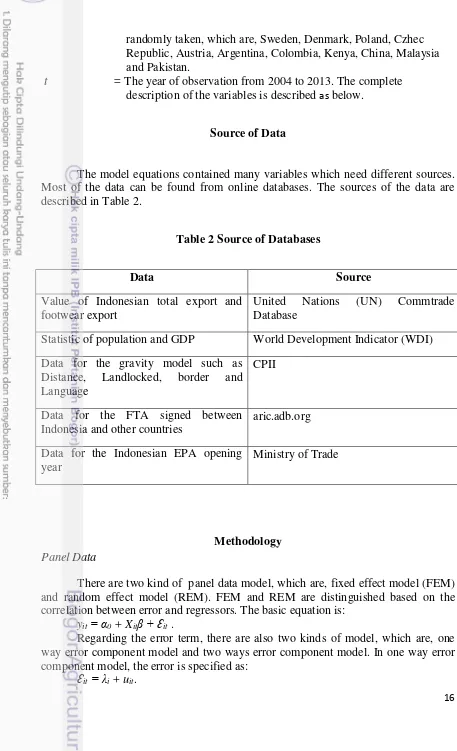
To examine the two objectives of this research, we need an overview of the condition of Indonesian total export and Indonesian footwear export. Particularly for Indonesian total export to 30 countries covered in this research, the trends for the last fifteen years were increasing substantially. However, in specific, the trends were fluctuating. As can be seen on Figure 4, some major importing countries such as USA, South Korea and India has a fluctuating sharp increase in 10 years observed. Whereas, the other importing countries such as Germany, Hungary, and Spain, have the fluctuating trends occurred at around 2008 and 2011, which were closely related to macro condition on global trade.
Data Source : UN Commtrade Database
Figure 4 Indonesia Total Export to 10 countries
In regards to value of footwear exports, based on Indonesian Custom Tariff Book or two digits harmonised system (HS), it has a number HS 64. The types included in HS 64 are footwear, gaiters and parts thereof including essentially every type and style from athletic shoes to flip-flops. According to (Cogitamus 2009), footwear has two categories, athletic footwear and non-athletic footwear. Athletic footwear includes shoes for athletics, sport and active lifestyle for men, women and children, such as hiking boots, sandals and sneakers. Non-athletic footwear covers casual and dress footwear for men, women and children, such as pumps and loafers, and also includes house slippers, various types of work shoes and boots. The trend of footwear export to several countries is presented on Figure 5.
22
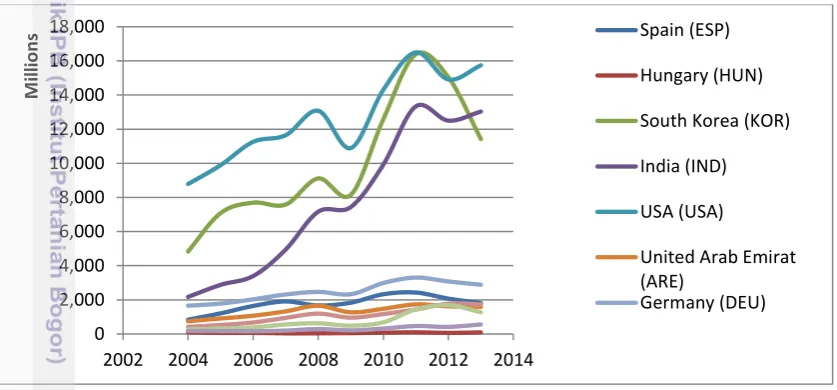
Data Source: UN Commtrade Database
Figure 5 Indonesia Footwear Export to 10 countries
As shown in Figure 5, the trends were fluctuated over the 10 countries but tend to increase. The sharp increase was occurred in Indonesian footwear trade with Japan from 2009 to 2013. Meanwhile some increases trends were occurred in fluctuating graphs. In addition, in global trade, Indonesia was the fourth largest footwear exporter to European countries with a share of around 5% in the European market after the major exporters such as China, Vietnam and Romania (Commission 2006, page 22). The biggest Indonesia footwear exports share was in European
countries in 2014 with 8.8% for a value of 1,654 million €(Commission 2015, page 7). Therefore, Indonesian footwear faced the hard competition with other countries in terms of value of export. Therefore, a strong support in promotion is needed to continually increasing the footwear export value.
Testing the models
There are two results given from two models which attempt to answer the objectives of the research. By using panel data analysis FEM and REM, the study examines the impact of Indonesian EPAs on aggregate export and the impact of EPAs on Indonesian footwear export. After runningthe models, the results should be tested with the validity test to ensure the best model chosen. Models were tested with Hausman test and F test to choose the best model among PLS, FE and RE model. The use of robust test also was applied to get standard error corrected. The complete validity test result of Hausman test and F test are given in the appendices.
23
Appendix 2 showsthat the F test probability is insignificant with 68%, above 5% significance. Therefore, the null hypothesis cannot be rejected. The null hypothesis stated that PLS is the most appropriate model to use for whole testing. Based on the Hausman and F test results, it can be concluded that PLS regression is the most appropriate estimation for the study.
Impact of Indonesian EPAs on Indonesia total export
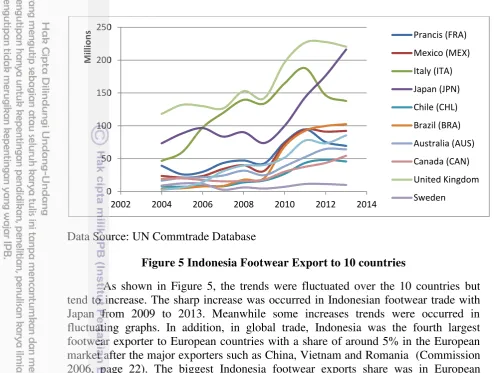
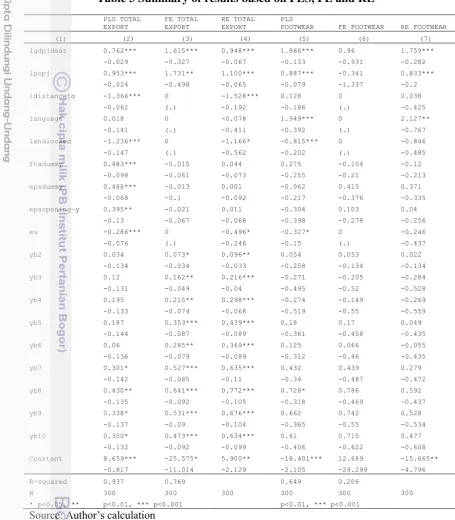
The result of estimations is described in Table 3. The first estimation used pooled OLS with total export as dependent variable and GDP destination, population in destination, distance, language, landlocked, FTA dummies, EPA opening dummies, EU dummies and time dummies as independent variables. The result, as shown in Table 3, is that GDP and population have a positive coefficient of 0.76 and 0.95, respectively, with significant P value. This means that for every increase 1% in GDP and population in destination country, the Indonesian export number increases 0.76% and 0.95%. In other words, the higher the GDP and population in a country destination, the larger the export value. In addition, by returning to the exponential logarithm of dummies coefficients, the results indicate that a FTA between Indonesia and the destination country or the existence of an EPA in the destination country increase exports by a factor of 1.6, so about 60%.
The distance and landlocked of countries contribute to decrease in export. Adding 1% to the distance (in kilometer) between countries trading reduces exports 0.36%.It seems the greater the distance, the lower the trade. And, to have a trade relationship with a country that is landlocked, exports are lower by about 0.70 or 70%.In line with landlocked, a membership of the destination country in the EU (European Union) also reduces exports by 25% to about 0.75 of the expected size. Meanwhile, language is the insignificant variable in determining exports. Since the language dummy is for Malaysia only, common language is insignificant to export value. The following result is time dummies coefficients which show inconsistent P value which are varying significant and insignificant for the ten years. The time dummy coefficients show an increase of export has occurred every year, whereas, in the last four years from 2010 to 2013 the probabilities were significant with the increase in export of around 1.34-1.53 or an increase by 34-53%. Moreover, the PLS result shows R squared is significant with 93%, which means the goodness of fit, or the ability of the model to explain the dependent variable is convincing.
24
coefficients decisively generated significant and positive results by increasing export every year.
Table 3 Summary of results based on PLS, FE and RE
PLS TOTAL
FOOTWEAR FE FOOTWEAR RE FOOTWEAR
25 Impact of Indonesian EPAs on Indonesia footwear export
GDP, population, language and landlocked have significant probabilities on footwear export with PLS regression (Table 3 column 5). The result shows that an increase about 1% GDP was occured, while the population showsan increase about 1.8% and 0.8% in export, respectively. Surprisingly, the result shows that language can increase export about 6.6 times, respectively. This is an unusual result as theoretically the increase in trade barriers, such as language, should decrease foreign trading. On the other hand, unlike the regression result for Indonesian total export, in the regression result for footwear export, EPAs and FTA have insignificant probabilities, even though the value is still positive. Moreover, unexpectedly, the result for time dummies effect was only significant in year 2011-2012, while in the remaining years they were insignificant for all variables. RE estimation shows that most of the variables were insignificant (Table 3 column 7). Unlike the RE result for total export, the RE result for footwear suggests that GDP, population and language are significantle affect footwear export. Meanwhile, EPA, FTA, EU, distance, landlocked and time dummies are insignificant in the RE estimation. This means there is not enough evidence to be certain that there is an effect of EPA on exports. Furthermore, from FE estimation result shown in Table 3 column 6, unexpectedly, P values are statistically insignificant for all variables with 5% significances. These mean all variables are not significantly associated with increase in footwear export, although EPAs showed positive coefficient in the estimation.
PLS, FE and RE show different coefficients when estimating Indonesia’s total export value and footwear export value. Therefore, further tests were undertaken to determine a relevant result. The first test undertaken was the Hausman test to compare RE and FE effects. The Probability of Hausman test has generated a significant result; hence, we rejected the null hypothesis which asserts that random effect (RE) is appropriate. Therefore, FE was determined to be the appropriate estimation. It is also needed to compare FE and PLS regression by doing F test. The F test result generates the insignificant probability. Thus, the null hypothesis cannot be rejected. It can be concluded that PLS is the most appropriate model . However, PLS is time series analysis which measurement scope is limited in detecting dynamic databases with panel data (Baltagi 2011).
Discussion
The results of the estimations show that the coefficients and probabilities of the variables are different among several tests. The Indonesia EPAs have a positive impact on Indonesia export when tested by PLS. This means, the positive impacts were occurred on a year or some years involved in the study. Particularly for the EPAs variable in the total export estimation, a significant and positive coefficient was implied by the rise of 60% when an EPA is opened in a destination country. This can be assumed that the existence of EPAs in the countries contribute to positive impact of Indonesian EPAs on Indonesia total export.
26
impeding market access overseas. EPAs also may increase export and investment through trade facilitation, such as by reducing impediments in customs processing, improving the regulatory environment, enhancing investor protection and increasing regulation transparency.
Looking further to the last ten years from 2004 to 2013, Indonesia total export to several countries had been increasing and fluctuating as shown in Figure 4. In these years, the Indonesian EPAs had chances to make more business matching, exhibitions and some other promotion activities. Since 2004 to 2008, the economic global condition was also in a stable condition, and Indonesia economic development was also growing rapidly. In 2004, it was the starting year of the new era of Indonesian EPAs after the closing due to monetary crisis 2007. Since 2004, government had risen their funding for establishing EPAs in overseas countries. In the same time, government also has established bilateral and multilateral cooperation which support EPAs to work more effectively.
Since 2004 to 2008, the economic global condition was also in a stable condition. Moreover, Indonesian economic development was also growing rapidly. In 2004, it was the starting year of the new era of Indonesian EPAs after the closing due to monetary crisis 2007. Government had risen their funding for establishing EPAs in overseas countries. In the same time, government has established bilateral and multilateral cooperation which support EPAs to work more effectively. It was proven by the establishment FTA between Indonesia and South Korea, Indonesia with Chile, Indonesia with Australia, and Indonesia with Japan. Therefore, indirectly, by these trade agreements, EPAs can work more effective.
As shown on the result, EPAs have contributed to the positive impact on Indonesia total export which given by study using PLS. However, choosing the PLS method as the appropriate estimation has a bias problem. PLS is not identically distributed for all individual, so, if the model is yit = αi + Xitβ + Ɛit, , the β is biased. It
means the gradient of PLS is not paralel with regression line on each individual. This bias is caused by the PLS cannot distinguish the different observation in the same period or the same observation in different period. In other words, when examining the impact of Indonesian EPAs in a country such as USA, PLS assumed the EPAs impact on USA is similar with the impact on other countries. In addition, PLS also cannot distinguish the same observation in different period. Therefore, it is assumed the increase of total export was occurred for all years, instead of a year.
Regarding the result of the Indonesian EPAs impact on footwear export, the significances cannot be found on the probabilities of three models PLS, RE and FE (Table 3 column 5, 6, 7). It can be assumed that Indonesian EPAs does not have impacts on footwear export. Hence, it raises the questions about the role of Indonesian EPAs on Indonesian exports.
27 country’s they are assigned. Moreover, Indonesian EPAs are also funded for general export promotion with no special budget for promoting specific products.. Indonesian EPAs also experienced the lack of funding, particularly for a specific product promotion. As a comparison, US had added funding for their export promotion services and events in 2010 for about 73 billion USD, and Indonesia had only approximately five percent of their budgeting (NEI 2012). By the lack of Indonesian EPAs budget, the promotional activities for specific product such as footwear exhibition in overseas countries cannot be fully done. The other promotional activities such as business matching, importers visit and others to support a specific product cannot be applied due to the lack of government funding.
Especially for Indonesian footwear export, indeed, the major producers are multinational companies (MNCs) such as Adidas and Nike. In order to keep the sustainable of footwear selling in overseas, some major brands usually develop special entity from the country producers. Nike, for example, to increase their selling in Europe, they tried to develop shoes with Indonesian batik accent in their products. However, this kind of effort is also need promotional efforts from Indonesian EPAs.
Not only the famous brands, but also small and medium footwear products Harrods. However, the support for promoting special brands cannot be applied every year. The promotional activities only focus on general product instead of specific products since the limitation on budget.
The kind of efforts to promote footwear product, also should be applied to other kinds of Indonesian products. There are a lot of potential Indonesian products need promotional efforts from EPAs. Most of them are usually produced in small medium companies that still have limit budget to promote their brands. This potency, in the long term will increase the Indonesian exports and also the value added can be benefited Indonesian people.
Thus, there are two major problems to make the Indonesian EPAs have positive impact on specific products. Firstly, is EPAs budget, since the lack of government funding causes the lack of Indonesian EPAs in providing specific products promotional activities. Secondly, only a few business or exporters have used Indonesian EPAs services in overseas countries. We have a lot of potential export products with potential resources which can be promoted. However, Indonesian government should encourage business or exporters to use EPAs. Government through the Ministry of Trade has to distribute market information from Indonesian EPAs, increase the dissemination of business potency from the destination countries of Indonesian EPAs.
28
5
CONCLUSION AND SUGGESTION
Conclusion
1. The Indonesia EPAs have a positive impact on Indonesian export when tested by PLS. This means, the positive impact might be occurred on a year or some years and not all of the years involved in the study. For example, an increase of Indonesia total exports in South Korea can be occurred on years after the FTA between countries was signed and EPAs have chances to work more effective. Therefore, the FTA and EPA have positive coefficients on years involved since implementing trade agreements generates positive correlation to EPA effectiveness. However, on some other years, the impact was not occurred.
2. When analyzing the impact of Indonesian EPAs on Indonesia footwear export, the significant results had not occurred. Even though, the trends of footwear exports were increased. The majority of footwear products are from foreign giant brands and the operational are more handled by business to business relationship; therefore particularly for footwear, more supports from EPAs are not really needed. However, the studies for examining impact on specific products should be done.
3. Studying the impact of EPAs on a specific product had not previously been examined. Most of previous research had examined the impact of EPAs only on total export, instead of a specific product such as footwear. This paper is the first research regarding impact of EPAs study using a specific product as evidence. Therefore, this study does not have a specific reference to compare.
4. Indonesian EPAs are not focusing their export promotions on a specific product. This is because they are more focus on general products. It might be occurred because of the lack of funding since promotion for special products in many events need more budgets.
5. The literature has shown that EPAs have various non-empirical impacts. EPAs can improve trade services activities which can take over company’s promotion budget. The trade activities are, such as, exporter training, technical assistance, logistics, capacity building, packaging, pricing regulatory compliance, trade finance knowledge and marketing.