308 IEEE TRANSACTIONS ON RELIABILITY, VOL. 56, NO. 2, JUNE 2007
A Lifetime Distribution With an Upside-Down
Bathtub-Shaped Hazard Function
Theodora Dimitrakopoulou, Konstantinos Adamidis, and Sotirios Loukas
Abstract—A three-parameter lifetime distribution with in-creasing, dein-creasing, bathtub, and upside down bathtub shaped failure rates is introduced. The new model includes the Weibull distribution as a special case. A motivation is given using a com-peting risks interpretation when restricting its parametric space. Various statistical properties, and reliability aspects are explored; and the estimation of parameters is studied using the standard maximum likelihood procedures. Applications of the model to real data are also included.
Index Terms—Bathtub curve, competing risks, hazard function, lifetime distribution, maximum likelihood estimation, survival function, upside-down bathtub curve.
NOTATION
—parameters of the distribution. pdf of at , depending on .
survival function of at , depending on . cdf of at .
quantile function of at .
hazard function of at , depending on . probability function.
observed information matrix.
I. INTRODUCTION
A
LTHOUGH the most popular lifetime models are those with monotone hazard rates (e.g. gamma, Weibull), re-flecting a wear out or a work hardening behavior of the popu-lation under study, there are several situations where the failure pattern is somehow different. For instance, when studying the life cycle of an industrial product, or the entire life span of a biological entity, it is very likely that a three-phase behavior of the failure rate will be observed. For example, consider a high failure rate in infancy which decreases to a certain level, where it remains essentially constant for some time, and then increases from a point onwards due to wear out or aging (Gaver & AcarManuscript received February 13, 2006; revised May 18, 2006; accepted July 23, 2006. This work was supported in part by the program “Heraklitos” of the Operational Program for Education and Initial Vocational Training of the Hel-lenic Ministry of Education, under the 3rd Community Support Framework and the European Social Fund. Associate Editor: L. Cui.
T. Dimitrakopoulou and S. Loukas are with the Department of Mathematics, University of Ioannina, 45 110 Ioannina, Greece (e-mail: [email protected]).
K. Adamidis is with the Department of Business Administration of Agri-cultural Products and Food, University of Ioannina, 30 100 Agrinio, Greece (e-mail: [email protected]).
Digital Object Identifier 10.1109/TR.2007.895304
[1]). Thus, in this case, a model with a bathtub or ‘U’ shaped failure rate would be appropriate to describe the population’s survival capacity. A systematic account of such distributions can be found in Rajarshi & Rajarshi [2], and Laiet al.[3]. Other sit-uations are those who call for a model with unimodal failure rate, often modeled by the lognormal, or the inverse Gaussian distributions (Johnsonet al.[4]).
This paper aims to provide a new lifetime model with a min-imum number of parameters, at least as flexible as the Weibull distribution, yet adequate to describe more complex failure pat-terns; two shape, and one scale parameters are included to ac-commodate for increasing, decreasing, bathtub shaped, and up-side-down bathtub-shaped failure rates. The model belongs to the class proposed by Gurvich et al. [5], for generalizing the Weibull distribution, and it is further discussed by Nadarajah & Kotz [6] (see also Laiet al.[7], Lie & Murthy [8], and Xie
et al.[9]). A motivation is given using a competing risks inter-pretation when restricting one of its parameters to be a positive integer. Several statistical properties are explored, and the es-timation of parameters is studied by the method of maximum likelihood; the fit of the distribution to two sets of real data is also examined.
II. THEMODEL
The pdf of the distribution is given by
(1)
for with where are shape
param-eters, and is a scale parameter. It can be shown that, for , the pdf is monotone decreasing with
, for , the same shape is exhibited
with , and
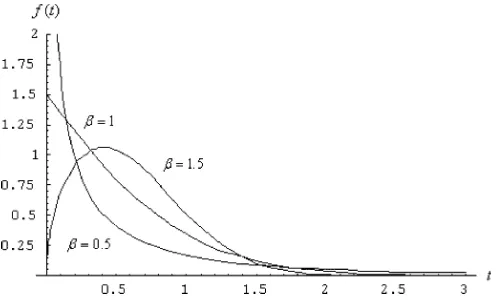
How-ever, for the pdf assumes the limiting value of zero at the origin, increases to a maximum, and then decreases, ap-proaching the value of zero at infinity; the different shapes of the pdf are illustrated in Fig. 1, for selected values of the parameters.
III. STATISTICALPROPERTIES,ANDRELIABILITYASPECTS
A. Relations With Other Distributions
When , the proposed model reduces to the Weibull distribution with shape, and scale parameters , and , respec-tively. Also, by setting in the Nadarajah & Kotz [6] presentation of the Gurvichet al.[5] model, one ob-tains the model in (1). Furthermore, it can be verified by stan-dard techniques that, if has the distribution given by (1), then: i follows the Weibull distribution with shape, and scale parameters , and 1 respectively,
trun-cated in .
DIMITRAKOPOULOUet al.: LIFETIME DISTRIBUTION WITH UPSIDE-DOWN BATHTUB-SHAPED HAZARD FUNCTION 309
Fig. 1. Probability density functions of the distribution for = 1, = 1:5, and = 0:5, 1, 1.5.
ii follows the exponential
distribu-tion with mean 1.
iii follows the modified extreme value
distribution with shape, and scale parameters 1, and , respectively.
iv follows the power exponential
distribution (Smith & Bain [10]) with shape, and scale parameters , and , respectively.
Relations with other distributions may be established through those encountered above.
B. Probabilities, Moments, and the Hazard Function
By straightforward integration, the corresponding survival probabilities, and the quantile function are calculated to be
(2)
for where is the distribution function, and
for , respectively. Hence, the median is .
The th moment of the distribution is given by
the relevant computations involve the straightforward use of standard numerical integration proce-dures, available in most every mathematical package.
From (1), and (2), the hazard (or failure rate) function is
(3)
for , exhibiting various shapes depending on the param-eter values; in fact, its monotonicity varies along the segments produced in the parametric space by the curves , , and . More specifically, by differentiating (3), it can be readily verified that
(a) for , is constant,
(b) for , and ( , and ), is monotone
increasing (decreasing),
(c) for , and ,
(i) if , is monotone decreasing,
Fig. 2. Hazard functions of the distribution.
(ii) if , is bathtub shaped,
(d) for , and ,
(i) if , is unimodal,
(ii) if , is monotone increasing.
Furthermore, when the assumptions stated in c(ii), or d(i) hold,
attains its global point at . Thus
the results in (a)–(d) offer insight into the merits of the proposed model; apart from having the bathtub or upside-down bathtub property, it also provides a wide class of monotone failure rates including those of the Weibull family. The distinct types of hazard shapes are illustrated in Fig. 2, for selected values of the parameters.
IV. MOTIVATION
The distribution can be viewed as an extension of a model de-scribed below, resulting when expanding the latter’s parametric space. Indeed, by restricting the hazard function in (3) can be written as
(4)
for , where , and .
Thus, the hazard rate can be expressed as the sum of terms, and consequently (4) is the hazard function of a series system of components with independent Weibull lifetimes; equiva-lently, by assuming that failures can be classified into dis-tinct types, the observed lifetime modeled by (4) corresponds to
, where are independent with , . The probability of failure in from cause (or failure type) in the presence of all other risks, conditional on surviving all risks until time , is given by
310 IEEE TRANSACTIONS ON RELIABILITY, VOL. 56, NO. 2, JUNE 2007
where all component hazard rates are monotone decreasing (where the system exhibits a work hardening behavior). On the other hand, when , and , (4) comprises of at least one monotone increasing, and at least one monotone decreasing term exhibiting, according to preceding arguments, a bathtub shape.
V. INFERENCE
Given a sample from the distribution in (1), the normal equations1, to be solved (numerically) for , are given by
Consequently, the elements in the upper triangular part of the symmetric observed information matrix , , , 2, 3, evaluated at , are given by
1By “normal equations” in statistics, we mean the equations that stem from
differentiating partially the log-likelihood function, with respect to the parame-ters, and setting the resulting expressions equal to zero.
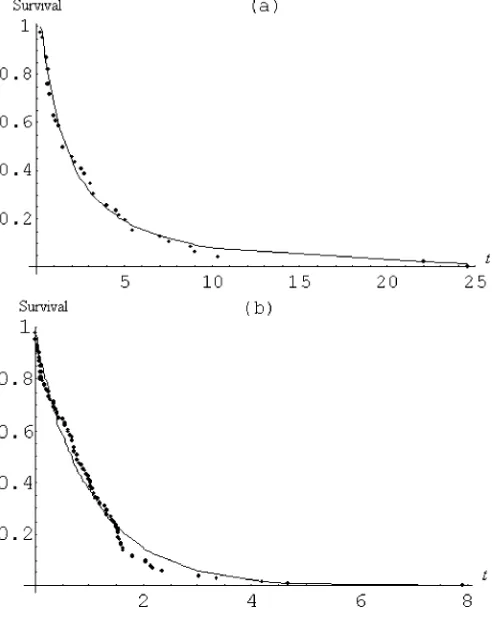
Fig. 3. Survival probability curves of the empirical distribution (dotted line), and the new distribution (solid line) fitted using maximum likelihood estimates for, (a) the repair times of an airborne communication transceiver, and (b) the Kevlar/epoxy strand-life data.
The latter, being a consistent estimate of the expected informa-tion matrix, provides an asymptotic estimate of the covariance matrix of .
VI. EXAMPLES
Two applications of the proposed model with real data are considered. The first one concerns 46 observations reported on active repair times (hours) for an airborne communication trans-ceiver (Chhikara & Folks [11]). The data encountered in the second application involve 101 observations on times to failure of Kevlar 49/epoxy strands tested at a 90% stress level (Andrews & Helzberg [12], p. 182). The parameters of the distribution were estimated by the method of maximum likelihood; and the fits were examined by graphical methods, and the Kolmogorov-Smirnov (K-S) goodness of fit test. The estimates of the parame-ters were (0.1226, 3.3643, 12.4828), and (1.3082, 0.8618, 0.6925), for the first, and second sets of data, respec-tively; therefore, the fitted hazard function is unimodal in the first case, and bathtub shaped in the second. The values of the K-S test statistic were 0.073 , and 0.086
DIMITRAKOPOULOUet al.: LIFETIME DISTRIBUTION WITH UPSIDE-DOWN BATHTUB-SHAPED HAZARD FUNCTION 311
ACKNOWLEDGMENT
The authors would like to thank the referees for useful com-ments, and suggestions.
REFERENCES
[1] D. P. Gaver and M. Acar, “Analytical hazard representations for use in reliability, mortality and simulation studies,”Communications in Sta-tistics—Simulation and Computation, vol. 8, pp. 91–111, 1979. [2] S. Rajarshi and M. B. Rajarshi, “Bathtub distributions: A review,”
Communications in Statistics—Theory and Methods, vol. 17, pp. 2597–2621, 1988.
[3] C. D. Lai, M. Xie, and D. N. P. Murthy, “Bathtub shaped failure rate distributions,” inHandbook of Statistics [on Reliability], N. Balakr-ishnan and C. R. Rao, Eds. Amsterdam: North Holland, 2001, pp. 69–106.
[4] N. L. Johnson, S. Kotz, and N. Balakrishnan, Continuous Univariate Distributions. New York: John Wiley and Sons, 1994, vol. 1. [5] M. R. Gurvich, A. T. Dibenedetto, and S. V. Ranade, “A new statistical
distribution for characterizing the random strength of brittle materials,”
Journal of Materials Science, vol. 32, pp. 2559–2564, 1997. [6] S. Nadarajah and S. Kotz, “On some recent modisfications of Weibull
distribution,”IEEE Trans. on Reliability, vol. 54, pp. 561–562, 2005. [7] C. D. Lai, M. Xie, and D. N. P. Murthy, “Reply to: On some recent
modifications of Weibull distribution,”IEEE Trans. on Reliability, vol. 54, p. 563, 2005.
[8] C. D. Lai, M. Xie, and D. N. P. Murthy, “Modified Weibull model,”
IEEE Trans. on Reliability, vol. 52, pp. 33–37, 2003.
[9] M. Xie, Y. Tang, and T. N. Goh, “A modified Weibull extension with bathtub-shaped failure rate function,”Reliability Engineering & System Safety, vol. 76, pp. 279–285, 2002.
[10] R. M. Smith and L. J. Bain, “An exponential power life-testing dis-tribution,”Communications in Statistics—Theory and Methods, vol. 4, pp. 469–481, 1975.
[11] R. S. Chhikara and J. L. Folks, “The inverse Gaussian distribution as a lifetime model,”Technometrics, vol. 19, pp. 461–468, 1977.
[12] D. F. Andrews and A. M. Herzberg, Data. A Collection of Problems from Many Fields for the Student and Research Worker. New York: Springer-Verlag, 1985.
Theodora Dimitrakopoulouis a research associate in statistics at the Depart-ment of Mathematics, University of Ioannina, GR. She holds a B.Sc. in mathe-matics, and an M.Sc. and a Ph.D. in statistics from the University of Ioannina. She has coauthored research articles in international refereed journals in distri-bution theory, statistical inference, and survival analysis.
Konstantinos Adamidisis an assistant professor of applied statistics at the De-partment of Business Administration of Agricultural Products & Food, Univer-sity of Ioannina, GR. He holds a B.Sc. in mathematics from Essex UniverUniver-sity, U.K., an M.Sc. in statistics from the University of Kent at Canterbury, U.K., and a Ph.D. in statistics from the University of Ioannina. He is the author or coauthor of one textbook (in Greek), and of research articles in international refereed journals. His research interests are in distribution theory, statistical in-ference from incomplete data, the EM algorithm, survival analysis, and applied statistics & data analysis.
Sotirios Loukasis a professor of statistics at the Department of Mathematics, University of Ioannina, GR. He holds a B.Sc. in mathematics from the Univer-sity of Ioannina, an M.Sc. in probability theory & statistics from Sussex Uni-versity, U.K., and a Ph.D. from Bradford UniUni-versity, U.K. He is the author or coauthor of two textbooks (in Greek), and of research articles in international refereed journals. His research interests are in distribution theory, statistical inference, non parametric statistics, simulation-statistical computing, survival analysis, statistical packages, and statistics in medicine. He served as an elected Head of the Department of Mathematics, and Director of the Section of Prob-ability, Statistics & Operations Research. Recently, he was elected Vice Rector of the University of Ioannina for the period 2006-2010.